MAMMOTH-Grism: Revisiting the Mass-Metallicity Relation in Protocluster Environments at Cosmic Noon
Abstract
We present one of the first measurements of the mass-metallicity relation (MZR) in multiple massive protoclusters at cosmic noon, using Hubble Space Telescope (HST) G141 slitless spectroscopy from the MAMMOTH-Grism survey. We identify 63 protocluster member galaxies across three overdense structures at with robust detections of [O III], H, and [O II] emission. The sample spans gas-phase metallicities of , dust-corrected H-based star formation rates (SFRs) of -, and stellar masses of -, derived via spectral energy distribution fitting using deep HST and ground-based photometry. We stack spectra in five bins to obtain average metallicities and SFRs. Relative to field galaxies at similar redshifts, protocluster members show elevated SFRs at and a systematically shallower MZR: . We detect a mass-dependent environmental offset: massive protocluster galaxies are metal-poor compared to field counterparts of similar mass, whereas lower-mass systems exhibit comparable or mildly enhanced metallicities. This trend is consistent with a scenario where cold-mode accretion dilutes the interstellar medium (ISM) across the full mass range, while efficient recycling of feedback-driven outflows preferentially enriches the ISM in low-mass galaxies. Finally, we assess the dependence of metallicity offsets on local overdensity and find no significant trend, likely reflecting the survey’s bias toward protocluster cores.
I Introduction
The gas-phase metallicity (hereafter referred to as metallicity) is a crucial observational diagnostic parameter in the study of galaxy formation and evolution. This parameter can be influenced by many processes, including star formation, gas inflow, gas outflow (Lacey and Fall, 1985; Kirkpatrick and McNamara, 2015; Ceverino et al., 2016; Lian et al., 2018; Wang and Lilly, 2021; Bertemes et al., 2023; Li et al., 2025a), and AGN feedback (Haas et al., 2013; Eisenreich et al., 2017; Werner et al., 2019; Choi et al., 2020; Peluso et al., 2023; Yang et al., 2024). The environment plays a significant role in these processes throughout cosmic time (Conselice, 2014; Andreon, 2018; Torres-Ríos et al., 2024; Ghodsi et al., 2024), with emerging evidence suggesting the onset of environmental effects as early as redshift (Helton et al., 2024; Morishita et al., 2025; Li et al., 2025b). During the cosmic noon (), a critical epoch when galaxies experienced their most vigorous growth, we expect to observe more significant environmental effects on those processes. In this active epoch, an ideal laboratory for developing our understanding of the physical phenomena associated with this impact is galaxy protoclusters, which are the progenitors of today’s massive galaxy clusters (Chiang et al., 2013; Muldrew et al., 2015; Overzier, 2016; Chiang et al., 2017). Recent studies have explored different aspects of galaxy formation and evolution in protocluster environments, including the star formation rate (SFR) (Christlein and Zabludoff, 2005; Hatch et al., 2011; Chiang et al., 2017; Hatch et al., 2017; Rihtaršič et al., 2024; Daikuhara et al., 2024), quenching (Kawinwanichakij et al., 2016, 2017; Tomczak et al., 2017; Edward et al., 2024; Pan et al., 2025), active galactic nuclei (AGN) activity (Rihtaršič et al., 2024; Vito et al., 2024; Travascio et al., 2025; Daikuhara et al., 2025), cold gas content (Dannerbauer et al., 2017; Pérez-Martínez et al., 2025; Zhou et al., 2025b; Daikuhara et al., 2025) and many other aspects (Kulas et al., 2013; Shimakawa et al., 2015; Valentino et al., 2015; Shimakawa et al., 2018; Sattari et al., 2021; Chartab et al., 2021; Wang et al., 2022; Li et al., 2022; Liu et al., 2023; Pérez-Martínez et al., 2024; Zhou et al., 2025a; Baxter et al., 2025). One of the key diagnostics for understanding the interplay between galaxy properties and their environments is the mass - metallicity relation (MZR). The MZR defines a well-established correlation between a galaxy’s stellar mass and its metallicity, observed consistently in both the local and distant universe (Tremonti et al., 2004; Erb et al., 2006; Andrews and Martini, 2013; Maiolino and Mannucci, 2019; Sanders et al., 2021; Henry et al., 2021; Calabrò et al., 2022). Furthermore, the influence of environment on galaxy metallicity has been extensively studied at low redshift (), revealing that galaxies in denser regions, such as clusters and groups, tend to exhibit higher metallicities compared to those in less dense, field regions (Baldry et al., 2006). However, the relationship between environment and metallicity becomes more complex and remains under active investigation at cosmic noon, with conflicting evidence of the existence of any environmental effects (Kulas et al., 2013; Kacprzak et al., 2015; Shimakawa et al., 2015; Valentino et al., 2015; Sattari et al., 2021; Chartab et al., 2021; Wang et al., 2022; Pérez-Martínez et al., 2023, 2024).
Cai et al. (2016) first confirmed the existence of the extremely massive overdensities at traced by groups of Coherently Strong Intergalactic Ly Absorption (CoSLA) using a technique referred to as MApping the Most Massive Overdensity Through Hydrogen (MAMMOTH). MAMMOTH utilizes the largest library of quasar spectra, SDSS-III Baryon Oscillations Spectroscopic Survey (BOSS), to locate strong HI absorption and identify the most massive protocluster candidates (e.g., Liang et al., 2021). Using the MAMMOTH technique, the protoclusters BOSS1244 (), BOSS1441() and BOSS1542 () were selected from the early data release of SDSS-III BOSS and confirmed by the follow-up observations (Cai et al., 2017b, a; Zheng et al., 2021; Shi et al., 2021). These protoclusters were selected based on their extreme overdensities and their potential to evolve into structures more massive than the Coma cluster, making them excellent candidates for studying the effects of environment on galaxy formation and evolution.
In this paper, we aim to disentangle environmental effects from the intrinsic properties of galaxies and to understand how these factors influence the MZR and the star formation rate (SFR). Extending our previous work on BOSS1244 (Wang et al., 2022), we incorporated improved photometric measurements and included two additional protoclusters (BOSS1441 and BOSS1542). With the expanded sample, we presented one of the first measurements of the MZR in multiple massive protoclusters at cosmic noon. We employed the deep Hubble Space Telescope (HST) Wide-Field Camera 3 (WFC3) grism spectroscopy and multi-wavelength broadband imaging to derive the stellar masses, SFRs, and metallicities of these galaxies. In addition, we analyzed the relationship between the metallicity and the galaxy overdensity in these protoclusters.
This paper is structured as follows. In Section II, we describe the observations and the data reduction process. In Section III, we outline the methods used to derive stellar masses, SFRs, and metallicities for our sample galaxies, along with the stacking procedure and AGN removal. In Section IV, we present the MZR of galaxies in overdense environments, the metallicity offset compared to field galaxies, and the relationship between galaxy overdensity and metallicity offset. In Section V, we interpret our findings in the context of environmental effects on galaxy evolution, focusing on gas accretion and feedback processes. Finally, we summarize our conclusions and their implications for galaxy formation in Section VI. Throughout this paper, we adopt the AB magnitude system and the standard concordance cosmology (, ). The metallic lines are denoted in the following manner, if presented without wavelength:
5008[Oiii], 3727,3730[Oii],
3869[Neiii], and 6585[Nii].
II Observations
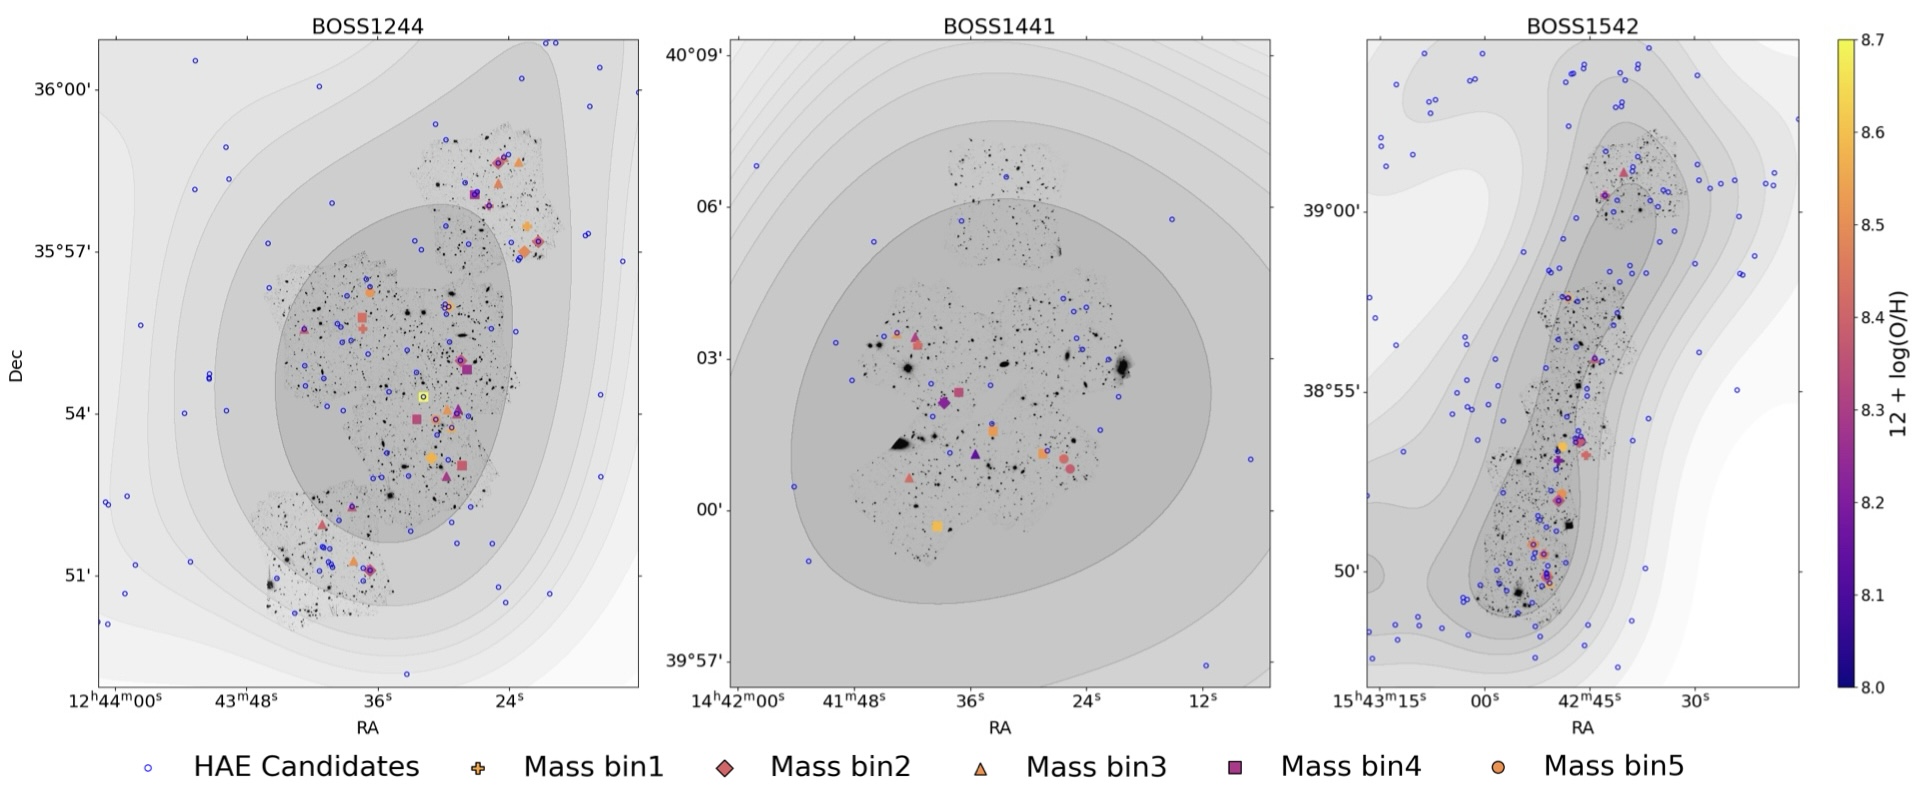
We have conducted an HST Cycle-28 medium program, the MAMMOTH-Grism survey (GO-16276, P.I.: X. Wang), a slitless spectroscopic survey designed to obtain deep WFC3/G141 grism and F125W imaging data in three of the most massive galaxy protoclusters at (see Figure 7 in Appendix). Each protocluster core was mapped with five WFC3/IR pointings, yielding a total effective area of 20 arcmin2 per field. For each pointing, we obtained exposures at three position angles (i.e., 10-15 degrees) to minimize spectral overlap and confusion. The G141 has a spectral resolution of R = 130 and covers a wavelength range of 1.1–1.7 m, allowing us to observe key rest-frame optical emission lines such as [O III]4960,5008, H, and [O II]3727,3730 for galaxies at . The total integration times are about 30 ks for G141 spectroscopy and about 9 ks for F125W imaging per field.
We also leveraged the existing multi-wavelength imaging data available in these fields, including HST/WFC3 F160W, LBT/LBC, CFHT/WIRCam, and KPNO/MOSAIC imaging data, the details of which are summarized in Table 1. These images were processed using the AstroDrizzle software and aligned with the GAIA DR2 astrometric frame.
| Telescope/Instrument | Filter | Integration Time | Angular Resolution (arcsec) | 5 Limiting Magnitude (AB) | Protocluster |
|---|---|---|---|---|---|
| Space-based Observations | |||||
| HST/WFC3 | F125W | 1.8 ks | 013 | 24.95 | All three protoclusters |
| HST/WFC3 | F160W | 2.6 ks | 015 | 24.97 | All three protoclusters |
| Ground-based Observations | |||||
| LBT/LBC | 4.7 hr, 6.0 hr, 4.8 hr | 096, 060, 080 | 26.7, 26.5, 26.4 | BOSS1244, BOSS1441, BOSS1542 | |
| LBT/LBC | 2.5 hr | 060 | 26.4 | BOSS1441 | |
| LBT/LBC | Sloan | 4.0 hr, 9.2 hr | 081, 090 | 25.1, 26.2 | BOSS1244, BOSS1542 |
| CFHT/WIRCam | 5.0 hr, 5.2 hr | 078 | 23.3, 23.2 | BOSS1244, BOSS1542 | |
| KPNO-4m/MOSAIC | 3.0 hr | 132 | 25.9 | BOSS1441 | |
Note. — Integration times for the two HST/WFC3 filters are given per protocluster field. The angular resolution of ground-based imaging refers to the median seeing values. The 5 limiting magnitudes are measured within a circular aperture of 1.0 arcsec diameter for the HST data and 2.0 arcsec for the ground-based data.
We utilized the GRIZLI software (Brammer, 2019) to reduce the WFC3/G141 data. This software operates through a series of steps to analyze the paired direct imaging and grism exposures.
-
1.
Pre-processing of the raw WFC3 exposures, which includes tasks such as relative/absolute astrometric alignment, flat-fielding, and variable sky background subtraction due to He I atmospheric airglow.
-
2.
Forward-modeling of the full field of view (FoV) grism exposures at the visit level.
-
3.
Redshift fitting via spectral template synthesis, which involves fitting linear combinations of spectral templates to the observed optimally extracted 1D grism spectra to determine the best-fit grism redshifts. These grism redshifts were derived from simultaneous fitting of several emission lines。
-
4.
Refinement of the full-FoV grism model.
-
5.
Extraction of 1D/2D grism spectra and emission-line maps for individual extended objects.
III Measurements
III.1 Sample Selection

The grism redshift fit for each source was considered secure only if it met certain goodness-of-fit criteria, including a reduced chi-squared value less than two, the width of the redshift posterior () being less than 0.005 and the Bayesian information criterion being more than 30.
In the redshift deriving procedure, we performed a fit for the intrinsic nebular emission lines to our samples with 1D Gaussian profiles, resulting in the acquisition of flux measurements of [Oii], H, H, H, [Neiii], and [Oiii]. Then, to secure accurate metallicity estimates, we selected sources with SNRs more than three in [Oiii] and [Oii]. The sample selection procedures resulted in a total of 77 member galaxies: 18 from BOSS1441, 20 from BOSS1542, and 39 from BOSS1244 (which were previously identified in Wang+22) with secure grism redshifts in the range of and prominent nebular emission features suitable for our analyses (see Figure 1). To double-check, we visually review the 1D spectrum to exclude sources that may be contaminated by nearby objects, which caused strong continua and abrupt flux jumps. There are 6 sources removed in this step. After removing active galactic nuclei (AGNs; see Section III.5), a sample of 63 galaxies was retained for the final analysis.
III.2 Stellar Mass
We performed aperture photometry on the HST images using SExtractor (Bertin and Arnouts, 1996) in dual-image mode, with the stacked F125W and F160W mosaics serving as the detection image to increase the depth.
To account for the resolution differences between HST and ground-based images, we used the T-PHOT software (Merlin et al., 2016), which fits the low-resolution images using templates derived from high-resolution images. This approach enables accurate photometric measurements across a broad wavelength range through a multi-step procedure to model low-resolution images based on high-resolution templates and perform the photometric calibration. Here, we used the same grism and imaging data of BOSS1244 as in our previous study, while the datasets for BOSS1441 and BOSS1542 are newly incorporated. We also improved the photometric analysis by employing newly constructed effective PSFs (ePSFs) in the T-PHOT fitting process to enhance the flux accuracy. The use of these new ePSFs reduces residuals in the photometric fitting compared with our previous analysis, resulting in more reliable stellar mass measurements. To ensure uniformity across the sample, the new ePSFs were applied to all three protoclusters, including BOSS1244.
-
1.
Create cutouts from the high-resolution images using SExtractor outputs.
-
2.
Match the PSFs of the high-resolution images to those of the low-resolution images using Fourier convolution, resulting in a kernel with the same pixel scale as the high-resolution image.
-
3.
Create low-resolution templates by convolving the high-resolution cutouts with the kernel obtained in the previous step.
-
4.
Fit the templates to the low-resolution images to derive the photometric measurements.
By minimizing the difference between the observed images and the templates, we obtain accurate photometric measurements from the ground-based images that are consistent with the isophotal fluxes of the HST images (Laidler et al., 2007). These measurements allow us to robustly estimate the stellar masses of the sample galaxies via spectral energy distribution (SED) fitting. We use the BAGPIPES software (Carnall et al., 2018) to fit the BC03 (Bruzual and Charlot, 2003) SED models to the photometry, assuming an initial mass function from Chabrier (2003) an extinction law from Calzetti et al. (2000) with prior listed as Table 2. We adopted an exponentially declining star formation history (SFH) model in the fitting process. The best fit grism redshifts were adopted with a conservative uncertainty of (Momcheva et al., 2016). We also found that the actual errors estimated by GRIZLI were smaller than this value (Wang et al., 2022), as our protoclusters lie at redshifts where the G141 grism is particularly efficient and accurate for redshift measurements. Given that the selected galaxies exhibit strong emission lines, we included nebular emission in the SED fitting. We include some of our SED fitting cases in the Appendix FIgure 8.
| Parameter | Range | Prior Description |
|---|---|---|
| 0 - 2.5 dex | Gas-phase metallicity | |
| 0 - 3 | Dust extinction | |
| SFH | = 0.01 - 10 Gyr | Star formation history |
Note. — SFH follows an exponentially declining model. The time since star formation began is allowed to vary from 0.01 Gyr up to the age of the Universe at the galaxy’s redshift, while the e-folding timescale () varies from 0.01 to 10 Gyr.
III.3 The Gas-Phase Metallicity
We used the observed emission line fluxes (e.g, [Oii], [Oiii], H, H) and their uncertainties to obtain three parameters: metallicity, nebular dust extinction, and the dereddened line flux , , . Building upon our previous works (Wang et al., 2017, 2019, 2020, 2022), we applied a forward-modeling Bayesian inference method. The key advantage of this approach is that, rather than calculating observed emission line flux ratios, it directly forward-models the observed line fluxes. This approach is superior to conventional methods as it marginalizes over faint, low-SNR lines (see Wang et al., 2020, Figure 6). We adopted the extinction law Calzetti et al. (2000) to correct for dust attenuation and derived from the parameter sampling. In practice, the extinction is corrected during the parameter-sampling process, as each is drawn from the 3D parameter space via Markov Chain Monte Carlo (MCMC) algorithm. The likelihood is defined as:
| (1) |
where denotes the expected line flux ratio, either the Balmer decrement () or a metallicity diagnostic such as . The observed emission-line fluxes and their uncertainties are denoted by and , respectively. We used the emcee sampler (Foreman-Mackey et al., 2013) for posterior sampling during the calculation. In this work, we adopt the empirical strong-line calibrations of Bian et al. (2018) (hereafter B18), derived from local analogs of high-z galaxies selected by their BPT diagram positions. The coefficients for these strong line calibrations are given in Table 3. We stress that metallicities shown below are on the empirical calibration of B18 applied consistently across our sample; absolute values may shift under alternative calibrations and therefore inter-study comparisons should be interpreted in a relative sense.
| Strong line calibrations of Bian et al. (2018) | ||||
| [Oiii] 4960,5008/H | 43.9836 | -21.6211 | 3.4277 | -0.1747 |
| [Oii]/H | 78.9068 | -45.2533 | 7.4311 | -0.3758 |
| Balmer decrement | ||||
| H/H | -0.3279 | |||
Note. — The empirical flux ratios are computed in the polynomial functional form of , where .
We note that our selection requiring S/N 3 in both [O III] and [O II] may introduce biases in the resulting metallicity distribution. Because weaker [O III] emission is typically associated with higher gas metallicity and lower ISM temperature, such a criterion could preferentially exclude metal-rich systems, particularly among massive galaxies. Consequently, our sample may be slightly skewed toward lower-metallicity sources compared to studies using [N II]/H-based diagnostics, which are more sensitive to the high-metallicity regime.
III.4 Star Formation Rate
We used the Balmer line luminosities to estimate the instantaneous SFR of our sample galaxies. Using the forward-modeling Bayesian method, we can conduct constraints on the dereddened flux. We note that the emission line we used as an SFR calibrator, may be affected by underlying stellar absorption from older populations, particularly in massive galaxies. Consequently, while our forward modeling yields tight constraints, these should be interpreted as lower limits on the true uncertainties, which include systematic effects from stellar absorption. Assuming the Kennicutt (1998) calibration and the Balmer decrement ratio of from the case B recombination for typical Hii regions, we can obtain the SFR of our sample galaxies as follows, which is suitable for the Chabrier (2003) initial mass function.
| (2) |
The derived and SFR values of our galaxy samples are listed in Table 5 in the Appendix. In Figure 2, we present the SFR - relation of the protoclusters members in gray.

III.5 AGN Identification and Removal
We identified and removed AGNs using the mass-excitation (MEx) diagram to distinguish between AGNs and Hii regions in emission-line galaxies. The well-known MEx diagram, proposed by Juneau et al. (2011, 2014) and modified by Coil et al. (2015), utilizes () as a proxy for the [Nii]/H ratio to differentiate between AGNs and Hii regions. By applying this modified version, we removed AGN contamination from our galaxy sample, ensuring that the galaxies selected for stacking were primarily photoionized by massive stars in Hii regions rather than by AGNs. As shown in Figure 3, eight sources classified as AGNs by the MEx diagram were excluded from the stacking analysis described below. At z , there is a high uncertainty using the MEx diagram (showing after) to identify AGNs, and the low SNR of individual galaxies adds to this uncertainty. Some of our sources in Figure 3 have large error bars in y-axis, in the result of the low SNR of H line. Therefore, we exclude the AGNs using relatively relaxed (0.15 dex more tolerance) conditions. If we remove these sources at low mass bins, we will possibly include significant systematic errors here as we have very few low mass samples after removal.

III.6 Spectral Stacking
In this subsection, we stacked the grism spectra of our sample galaxies to enhance the SNRs of the emission lines. From the previous procedures, we found that the of our galaxies range from to . To investigate potential mass-dependent trends, we divided the samples into five mass bins (see Table 4). We then utilized the following stacking procedures, similar to those in Henry et al. (2021).
-
1.
Subtract continuum models constructed by the GRIZLI software from the observed grism spectra, combined from multiple orients.
-
2.
Normalize the continuum-subtracted spectrum of each object by the measured [[Oiii] ] flux, to avoid excessive weighting toward objects with stronger line fluxes.
-
3.
Deredden each normalized spectrum to its rest frame on a common wavelength grid.
-
4.
Take the median value of the normalized fluxes at each wavelength grid.
-
5.
Re-create the stacked spectra 1000 times with bootstrapping replacement, and adopt the standard deviation as the measurement uncertainty.
Next, we fit multiple Gaussian profiles to the stacked spectra using nonlinear least-squares minimization with LMFIT software (Newville et al., 2015) to derive line flux ratios within each mass bin. The Gaussian profiles were centered at the rest-frame wavelengths of emission lines ([Oii]. [Neiii], , H, H, and 4960, 5008 doublet). Here we fixed the amplitude ratio of the [Oiii] doublet to 1:2.98. following Storey and Zeippen (2000). The resulting stacked spectra and best fit emission line models (red dashed curves) are shown in Figure 4, and the line flux ratios are summarized in Table 4. For each stellar-mass bin, we derived the metallicity using the same Bayesian method as described in Section 3.3, based on the emission line fluxes obtained from the stacked spectra. The stellar masses and SFRs of the stacked samples are calculated as the medians of the individual galaxies within each bin, with their uncertainties estimated using bootstrapping resampling. The derived metallicities, stellar masses, and SFRs of the stacked samples are listed in Table 4. We need to stress here that as the SFRs of stacked sample shown in Figure 2 are the medians of the individual galaxy SFRs within each stellar-mass bin, the error bars represent the 1 dispersion of those individual SFRs and therefore quantify the intrinsic scatter of the population rather than the measurement uncertainty propagated from the stacked spectra.
| mass bin | log() | SFR | [Oiii]/H | [Oii]/H | H/H | [Oiii]/[Oii] | |||||
|---|---|---|---|---|---|---|---|---|---|---|---|
| range | [] | [/yr] | [ ] | using B18 calibrations | |||||||
| 1 | 10 | [10.35, 10.95) | 1010.40 | ||||||||
| 2 | 12 | [10.20, 10.35) | 1010.30 | ||||||||
| 3 | 21 | [9.95, 10.20) | 1010.10 | ||||||||
| 4 | 12 | [9.75, 9.95) | 109.88 | ||||||||
| 5 | 8 | [9.30, 9.75) | 109.60 | ||||||||
Note. — Physical and spectral properties of stacked galaxy samples in five stellar mass bins. The multiple emission line flux ratios are measured from the stacked spectra shown in Figure 4. The stellar masses, , and SFR results refer to the median value of galaxies within each mass bin, with 1 uncertainty represented by the standard deviation. Stacked spectra are used solely for emission-line ratio measurements and metallicity inference via the forward-modelling procedure and do not enter into the calculation of the median SFRs. Consequently, a formally high S/N on a binned SFR (i.e., the low-mass bin where H and H are weak or undetected in the stack) indicates a small spread in individual SFRs within the bin, not a high-significance detection of recombination lines in the stack.

IV Results
IV.1 SFRs in The Three Protoclusters
In Figure 2, our stacked samples shown in orange dots are compared with the stacked field field galaxies from Sanders et al. (2021) shown in blue squares. The star-forming main sequence (SFMS) at derived by Speagle et al. (2014) is also included here, and represented by the green shaded region with a 0.2 dex scatter. We find that our stacked samples are generally consistant with the SFMS, although there is a slight elevated SFR in the lowest mass bin 5 (log), which could be due to the detection limit of our grism data. As the 3 SFR detection limit we plot in Figure 2 as the gray dashed line, it suggests that the elevated SFR of the mass bin 5 could be an artifact of the limited sensitivity of our observations rather than a true enhancement in star formation activity. To be conservative we flag the lowest-mass bin as possibly elevated but not robustly above the SFMS. The result of the SFRs closely following the SFMS is consistant with the results of Spiderweb protocluster (Pérez-Martínez et al., 2023) and the NICE-COSMOS protoclusters (Travascio et al., 2025).
IV.2 MZR in The Overdense Environments

Our main results are presented in Figure 5, which shows the stellar mass-metallicity relation relation and the metallicity offset compared to field galaxies as a function of stellar mass for protoclusters in the most overdense environments at cosmic noon (), when star formation activity in massive galaxies was at its peak.
In the left panel of Figure 5, the individual galaxies are shown in gray dots, with their median error bar plotted at the upper left of the diagram. The stacked results are shown in red, along with 1 uncertainties. The linear regression of the stacked data is displayed by the red dotted line. The derived MZR in the range of is . The slope of our result is consistent with the previous work (Wang et al., 2022). Here we need to stress that different studies of the MZR are subject to several systematic effects that can mimic environmental signatures. Strong-line calibrations (e.g. N2, O3N2, R23) show systematic offsets and different sensitivities to ionization and ISM conditions, while selection criteria like emission-line S/N, UV/narrow-band selection, or photometric cuts will bias samples in SFR, dust and line strength, altering both MZR normalization and slope. The choice of reference field sample and any SFR/FMR treatment also affects apparent offsets. To reduce these issues we compare our protocluster measurements to the MOSDEF field sample of Sanders et al. (2021) using the same B18 empirical calibration; nevertheless, residual systematic uncertainties remain, so reported metallicity differences should be interpreted as relative rather than absolute. We clearly observe that the slope of our result is significantly shallower than that of field galaxies, implying that the galaxies in the overdense environment at cosmic noon may be undergoing different evolution processes.
The fundamental metallicity relation (FMR) (Mannucci et al., 2010; Bothwell et al., 2013; Sanders et al., 2018; Curti et al., 2020) shows that at a fixed stellar mass, galaxies with higher SFRs have lower metallicities both in local and high-redshift universe (up to ). Recent JWST observations suggest that this relation may persist at even higher redshifts () (Nakajima et al., 2023; Sarkar et al., 2025). Considering SFR differences between our samples and the field galaxies, we calculate the metallicity offset by using the equation from Sanders et al. (2021) as reference metallicity:
| (3) |
| (4) |
Where . We then compare the offset between our samples and the field galaxies, represented by dark blue markers with a dashed line of the same color connecting them in the right panel of Figure 5.
Our galaxies in the mass bin 5 (log), galaxies show slight metal enrichment of dex, comparable to field galaxies. The mass bin 4 (log) exhibits a small metal deficiency of dex, which becomes more pronounced in the mass bin 3 (log: dex). The deficiency increases with mass, reaching dex in the mass bin 2 (log) and dex in the mass bin 1 (log).
We also include results from the literature (Kulas et al., 2013; Kacprzak et al., 2015; Shimakawa et al., 2015; Valentino et al., 2015; Sattari et al., 2021; Chartab et al., 2021; Wang et al., 2022; Pérez-Martínez et al., 2023, 2024) that measured the offsets between field galaxies and galaxies in protoclusters at similar redshifts () for comparison, as the right panel of Figure 5. What should be kept in mind is that our metallicity are rely on [OIII]-dependent diagnostics, which is more sensitive to low-metallicity regimes. In contrast, most literature results at similar redshifts Kulas et al. (2013); Kacprzak et al. (2015); Valentino et al. (2015); Sattari et al. (2021); Chartab et al. (2021); Pérez-Martínez et al. (2023, 2024) are based on [NII]/H diagnostics, which are more sensitive to high-metallicity regimes. The different choice of metallicity can result in systematic offsets, especially when comparing metallicities in the high mass bins. Our samples could be more metal-poor compared to these studies. We observe that the metallicity offset in more massive galaxies, compared to field galaxies, is smaller than that in less massive galaxies, with the exception of the results from Valentino et al. (2015) and Pérez-Martínez et al. (2024). Valentino et al. (2015) analyzed 6 galaxies in an X-ray-selected cluster, CL J1449+0856, at and detected a metallicity deficiency of dex. Due to their small sample size, they did not detect a mass dependence on the metallicity offset. Pérez-Martínez et al. (2024) analyzed 27 HAEs in the USS1558 protocluster at and found metallicity deficit in low-mass galaxies, with no significant difference in high-mass galaxies. This may be because they did not correct the metallicity of field galaxies using the FMR, as their low-mass samples have significantly higher SFRs than the main sequence of galaxies shown in their Figure 5.
Shimakawa et al. (2015) compared their narrow-band selected galaxies with UV-selected field galaxies from Erb et al. (2006), which could explain the metal enhancement in their samples, as UV-selected galaxies tend to be metal-poor due to selection bias. The results of Kulas et al. (2013) may be influenced by the mass offset between their sample and field galaxies (see their Figure 2).
The results of Sattari et al. (2021) and Chartab et al. (2021) are consistent with our findings, showing a similar mass dependence of the metallicity offset, with the metallicity deficit being more significant in high-mass galaxies than in low-mass galaxies.
We also note that some authors report no clear environmental shift in the MZR. In particular, Kacprzak et al. (2015) found essentially identical cluster and field MZRs at using MOSFIRE/ZFIRE spectroscopy, while Pérez-Martínez et al. (2023) report only mild or mixed metallicity differences in the Spiderweb protocluster. These apparently discordant findings likely reflect differing sample definitions and target regions, metallicity calibrations, and the presence or absence of heavily obscured starbursts in the surveyed areas. Such selection and environmental-definition differences can naturally reconcile null-results with the mass-dependent dilution/enrichment pattern we observe.

To further examine whether galaxy overdensity affects metallicity, we computed the metallicity offset relative to the derived MZR as a function of the galaxy overdensity (), as shown in Figure 6. The galaxy overdensity, , is estimated from the surface density of H emitters (HAEs) in BOSS1244 and BOSS1542, or Ly emitters (LAEs) in BOSS1441, using the relation . Here, represents the surface density of HAEs or LAEs per arcmin2 within the protoclusters, while refers to the corresponding surface density in random fields at similar redshifts. The luminosity limits for selecting HAEs and LAEs in the protoclusters are erg s-1 and erg s-1, respectively (Cai et al., 2017a; Shi et al., 2021). We adopt a field surface density of HAEs per arcmin2, following Shi et al. (2021). The field surface density of LAEs is estimated to be LAEs per arcmin2, following Cai et al. (2017a). We then generate the maps of the three protoclusters by applying the 2D kernel density estimation (KDE) to the HAE or LAE maps, using a Gaussian kernel of 150″ () smoothing scale. To assess the relationship between galaxy overdensity and metallicity offset, we performed both Pearson and Spearman rank correlation tests. The resulting correlation coefficients are r = 0.15 (p = 0.25) and r = 0.13 (p = 0.29), respectively. These results indicate that there is no statistically significant correlation between galaxy overdensity and metallicity offset in our sample, which is different with the findings of Pérez-Martínez et al. (2023). They found a mild anti-correlation between the metallicity offset and local density in PKS1138 at . However, in Pérez-Martínez et al. (2024), their results show no significant trends of metallicity offset on local density in USS1558 at . This may be attributed to the fact that the galaxies in our sample are primarily located in the dense core regions of protoclusters, where variations in local density are relatively small. Additionally, the apparent scatter across different densities is likely a consequence of the limited sample size.
V Discussion
We have presented one of the first MZR measurements in multiple massive protoclusters at cosmic noon. By synthesizing our results with those from the literature into a mass-metallicity offset diagram, we identify a trend: massive protocluster galaxies tend to be more metal-poor than their field counterparts, while low-mass galaxies exhibit comparable or slightly enhanced metallicities. These results may be explained by the interplay of two physical processes: (1) the presence of small-scale (kiloparsec) filamentary gas streams, and (2) the efficient recycling of feedback-driven outflows.
-
1.
Small-scale gas stream: Wang et al. (2023) used EAGLE simulation to investigate the environmental impact on MZR at . They found that central galaxies in protoclusters at typically reside in more massive halos, experience enhanced cold-mode gas accretion, and consequently show lower metallicities, consistent with our observations. Galárraga-Espinosa et al. (2023) used the output of the TNG50-1 simulation to examine the relationship between galaxy connectivity (i.e., the number of small-scale filamentary streams connected to a galaxy) and cosmic environment at . They also explored the impact of connectivity on the SFR. Their findings indicate that galaxies in cosmic web knots (i.e., protoclusters or clusters) have higher connectivity than field galaxies, meaning that galaxies in these environments at can accrete more fresh gas from the cosmic web, leading to the dilution of their metallicity. Interestingly, the galaxy connectivity is found to significantly enhance SFR in low-mass galaxies (, or when h = 0.7), but has no significant effect on high-mass galaxies, which is consistent with our results (Figure 2). This scenario suggests a transition in dominant accretion modes from cold-mode to hot-mode accretion in galaxies of different masses using the relation from Moster et al. (2010) with a dark matter halo threshold mass from Dekel and Birnboim (2006). While the gas streams can account for the observed metallicity deficit and elevated SFR in our results, another process is needed to explain the lack of significant metallicity deficit in low-mass galaxies.
-
2.
Efficient recycling of feedback-driven winds: Ma et al. (2016) used simulations and found galaxies above are able to retain a large fraction of their metals as metal-enriched winds are unable to fully escape and are instead recycled back into the galaxy. Zhang et al. (2023) detected emission lines from ionized carbon that extended 100 kpc from a massive galaxy at , with kinematics consistent with an inspiraling stream, indicating the presence of chemically enriched gas in the circumgalactic medium.The combination of inspiraling motion and high carbon abundance suggests that the gas was previously ejected and is now reaccreting, providing direct evidence for gas recycling. Oppenheimer and Davé (2008) used cosmological hydrodynamic simulations and found that the recycling of gas and metals ejected by momentum-driven winds is primarily influenced by environmental density. In denser environments, the recycling of wind material is more efficient, which facilitates the enrichment of galaxy metallicity. This recycling effect is more pronounced in low-mass galaxies, as they and El-Badry et al. (2018) found high-mass galaxies are inherently less affected by ejective feedback mechanisms due to their deeper potential wells. Anglés-Alcázar et al. (2017) also showed that in lower-mass galaxies, a greater proportion of the gas supply comes from wind recycling, with these systems re-accreting more gas relative to their stellar mass.
Finally, we note two observational subtleties that help reconcile the apparent tension with simple FMR expectations and with some literature results. First, our dataset is emission-line selected and comprises galaxies with only moderate dust extinction; it therefore lacks the heavily obscured starburst population that some protocluster studies target. If such dusty starbursts dominate certain core regions, they could produce elevated SFRs at the high-mass end and thereby alter the comparison. Second, inflow and recycling efficiencies vary systematically with halo mass and local density: pristine cold streams preferentially feed massive galaxies located at filament nodes and can dilute nebular abundances without necessarily triggering an immediate SFR boost (e.g., when the accreted gas has high angular momentum or is temporarily heated). By contrast, low-mass satellites inhabit very dense sub-environments where outflows are more readily trapped and recycled, promoting both higher retained metallicity and short-term SFR. The same deep potentials that enhance recycling can also impede some cold inflows (or strip them), so inflow and recycling efficiencies are anti-correlated with halo mass and local density. These competing, mass-dependent effects naturally produce dilution at the massive end (with little SFR response) and enhanced metallicity at the low-mass end, and are consistent with a crossover mass near . We stress, however, that confirming this picture requires complementary data (dust-sensitive SFR tracers and direct gas-mass measures) which are beyond the present dataset. Last but not least, we note a straightforward observational route to test the cold-stream + recycling picture. Keck/KCWI can reveal extended Ly nebulae and spatially resolved interstellar absorption, which trace cool CGM gas, inflow kinematics and metal content. These diagnostics can help separate pristine, low-metallicity inflows from metal-rich recycled gas via morphology, velocity structure and absorption strength. By contrast, obtaining resolved H maps for our targets with HST grisms is not feasible at these redshifts. Thus, combining KCWI Ly mapping with dust-sensitive SFR tracers and direct cold-gas measurements (e.g. ALMA/NOEMA) offers the most practical near-term path to distinguish the roles of cold accretion and wind recycling.
VI Conclusion
In this paper, we studied the MZR of galaxies in the overdense environments at cosmic noon, using a sample of 63 galaxies from the protoclusters BOSS1244, BOSS1441, and BOSS1542. Using grism data acquired by MAMMOTH-Grism, and our forward-modeling Bayesian inference method, we obtained the gas-phase metallicities and SFRs of these galaxies. By taking advantage of existing multi-wavelength imaging data, we estimated the stellar masses of the sample galaxies. Using the MEx diagram, we excluded AGN contamination from the galaxy sample, ensuring that primarily ionized by massive stars in Hii regions rather than AGNs. We divided our sample into five mass bins and stacked the grism spectra in each bin to derive the MZR of galaxies in overdense environments at cosmic noon.
Our main results are as follows:
-
1.
The MZR of galaxies in the most overdense environment at cosmic noon is shallower than that of field galaxies, with a slope of .
-
2.
The metallicity offset between galaxies in the protoclusters and field galaxies is mass-dependent, with more massive galaxies showing a more significant metallicity deficit than less massive galaxies.
-
3.
The metallicity deficit in high mass galaxies is more significant than in low mass galaxies, which may be caused by the combination of small-scale gas streams and efficient recycling of feedback-driven winds.
-
4.
The density of the local environment does not significantly affect the metallicity of galaxies in our sample.
We thank the anonymous referee for a careful read and useful comments that helped improve the clarity of this paper. We thank Hang Zhou, Xunda Sun, and Hanwen Sun for helpful discussions. Some of the data presented in this article were obtained from the Mikulski Archive for Space Telescopes (MAST) at the Space Telescope Science Institute. The specific observations analyzed can be accessed via [https://doi.org/10.17909/4012-2q76] (catalog doi:10.17909/4012-2q76). This work is supported by the China Manned Space Program with grant no. CMS-CSST-2025-A06, the National Natural Science Foundation of China (grant 12373009), the CAS Project for Young Scientists in Basic Research Grant No. YSBR-062, the Fundamental Research Funds for the Central Universities, the Xiaomi Young Talents Program. CWT is supported by NSFC 12588202. This work is also supported by NASA through HST grant HST-GO-16276 and HST-GO-17159. D.D.S. acknowledges support from the National Science Foundation of China (Grant No. 12303015), the National Science Foundation of Jiangsu Province (Grant No. BK20231106). X.Z.Z. is supported by the National Key Research and Development Program of China (2023YFA1608100), the National Science Foundation of China (NSFC, Grant No. 12233005), the China Manned Space Program with grants nos. CMS-CSST-2025-A08 and CMS-CSST-2025-A20, and Office of Science and Technology, Shanghai Municipal Government (grant Nos. 24DX1400100,ZJ2023-ZD-001).
Appendix A Individual Galaxies Properties
| ID | R.A. | Dec. | Observed emission line fluxes [ ] | Derived physical properties | ||||||||
|---|---|---|---|---|---|---|---|---|---|---|---|---|
| [deg.] | [deg.] | AV | SFR [/yr] | |||||||||
| Mass bin 5 | ||||||||||||
| 1394 | 190.877806 | 35.898194 | 2.213390 | |||||||||
| 2731 | 190.902840 | 35.937397 | 2.286767 | … | ||||||||
| 3032 | 220.359566 | 40.016983 | 2.337503 | |||||||||
| 3745 | 220.404855 | 40.038908 | 2.246653 | … | ||||||||
| 3904 | 220.356893 | 40.013687 | 2.304711 | |||||||||
| 2808 | 235.703888 | 38.869335 | 2.312362 | |||||||||
| 3443 | 235.703550 | 38.891068 | 2.284314 | … | … | |||||||
| 3534 | 235.692625 | 38.893567 | 2.204170 | |||||||||
| Mass bin 4 | ||||||||||||
| 1071 | 190.867795 | 35.884012 | 2.236753 | … | … | |||||||
| 1397 | 190.884983 | 35.898280 | 2.318674 | … | ||||||||
| 1573 | 190.882538 | 35.905175 | 2.227217 | … | ||||||||
| 1890 | 190.865939 | 35.913638 | 2.250783 | |||||||||
| 2474 | 190.905843 | 35.929694 | 2.191480 | … | ||||||||
| 3331 | 190.862922 | 35.967686 | 2.223014 | … | ||||||||
| 3382 | 220.390044 | 40.026162 | 2.307205 | … | ||||||||
| 3028 | 220.414100 | 39.994593 | 2.261937 | … | ||||||||
| 4179 | 220.368649 | 40.018750 | 2.320003 | … | ||||||||
| 4508 | 220.390078 | 40.026171 | 2.306926 | |||||||||
| 4971 | 220.404805 | 40.038917 | 2.246954 | |||||||||
| 1292 | 235.712784 | 38.831004 | 2.185424 | … | ||||||||
| Mass bin 3 | ||||||||||||
| 381 | 190.909141 | 35.854547 | 2.179024 | … | ||||||||
| 613 | 190.921119 | 35.865813 | 2.243770 | |||||||||
| 769 | 190.909740 | 35.871348 | 2.241579 | |||||||||
| 996 | 190.873758 | 35.880726 | 2.320312 | |||||||||
| 1335 | 190.871757 | 35.895697 | 2.235818 | |||||||||
| 1435 | 190.869813 | 35.900036 | 2.209610 | |||||||||
| 1464 | 190.873403 | 35.901270 | 2.211873 | … | ||||||||
| 1467 | 190.869254 | 35.901455 | 2.210074 | |||||||||
| 2327 | 190.927963 | 35.926164 | 2.238317 | … | ||||||||
| 3385 | 190.853893 | 35.971115 | 2.300365 | … | ||||||||
| 3496 | 190.846119 | 35.977685 | 2.235796 | … | ||||||||
| 3516 | 190.851775 | 35.979114 | 2.233867 | |||||||||
| 4479 | 220.422619 | 40.054613 | 2.340896 | |||||||||
| 4582 | 220.423681 | 40.057109 | 2.276418 | |||||||||
| 4640 | 220.431501 | 40.058304 | 2.310424 | |||||||||
| 3750 | 220.426202 | 40.010749 | 2.271204 | |||||||||
| 4189 | 220.397710 | 40.018591 | 2.287011 | |||||||||
| 1203 | 235.711177 | 38.828104 | 2.237434 | … | ||||||||
| 1704 | 235.714941 | 38.841340 | 2.240712 | … | … | |||||||
| 4943 | 235.684359 | 38.932112 | 2.236404 | |||||||||
| 6235 | 235.667089 | 39.018249 | 2.245371 | … | ||||||||
| Mass bin 2 | ||||||||||||
| 313 | 190.902894 | 35.851659 | 2.227321 | … | ||||||||
| 1112 | 190.879330 | 35.886279 | 2.300383 | … | … | |||||||
| 1998 | 190.868202 | 35.916375 | 2.213119 | … | ||||||||
| 2588 | 190.872857 | 35.933017 | 2.244739 | |||||||||
| 2992 | 190.843993 | 35.949979 | 2.347807 | |||||||||
| 3061 | 190.838668 | 35.953087 | 2.225519 | … | ||||||||
| 3495 | 190.853920 | 35.977367 | 2.231189 | … | ||||||||
| 3652 | 220.411198 | 40.035707 | 2.180092 | |||||||||
| 1291 | 235.712874 | 38.830797 | 2.241750 | |||||||||
| 1893 | 235.720995 | 38.845859 | 2.244002 | … | ||||||||
| 2702 | 235.705996 | 38.866214 | 2.255019 | |||||||||
| 3531 | 235.693722 | 38.893516 | 2.269391 | |||||||||
| Mass bin 1 | ||||||||||||
| 2330 | 190.905581 | 35.926178 | 2.294822 | |||||||||
| 3155 | 190.842877 | 35.957764 | 2.317641 | … | ||||||||
| 3276 | 190.857451 | 35.964185 | 2.207442 | |||||||||
| 5861 | 220.422593 | 40.054581 | 2.340491 | |||||||||
| 1705 | 235.714718 | 38.841504 | 2.242345 | … | ||||||||
| 3214 | 235.706084 | 38.884699 | 2.173583 | |||||||||
| 3305 | 235.689707 | 38.887214 | 2.311889 | … | … | |||||||
| 5585 | 235.700570 | 38.959942 | 2.234094 | |||||||||
| 5586 | 235.700082 | 38.960015 | 2.235445 | … | ||||||||
| 5947 | 235.678266 | 39.007549 | 2.225628 | … | ||||||||
Note. — All uncertainties reflect confidence intervals. Missing or undetected emission lines are indicated by ellipses (…), representing lines that are either below the detection threshold or masked due to contamination.
Appendix B HST Observed Layouts
Appendix C SED fitting examples

References
- The cosmic epoch dependence of environmental effects on size evolution of red-sequence early-type galaxies. A&A 617, pp. A53. External Links: Document, 1807.03060 Cited by: §I.
- The Mass-Metallicity Relation with the Direct Method on Stacked Spectra of SDSS Galaxies. ApJ 765 (2), pp. 140. External Links: Document, 1211.3418 Cited by: §I.
- The cosmic baryon cycle and galaxy mass assembly in the FIRE simulations. MNRAS 470 (4), pp. 4698–4719. External Links: Document, 1610.08523 Cited by: item 2.
- Galaxy bimodality versus stellar mass and environment. MNRAS 373 (2), pp. 469–483. External Links: Document, astro-ph/0607648 Cited by: §I.
- Quantifying the Impact of Incompleteness on Identifying and Interpreting Galaxy Protocluster Populations with the TNG-Cluster Simulation. ApJ 990 (2), pp. 225. External Links: Document, 2504.03836 Cited by: §I.
- MASCOT: molecular gas depletion times and metallicity gradients - evidence for feedback in quenching active galaxies. MNRAS 518 (4), pp. 5500–5521. External Links: Document, 2211.12518 Cited by: §I.
- SExtractor: Software for source extraction.. A&AS 117, pp. 393–404. External Links: Document Cited by: §III.2, MAMMOTH-Grism: Revisiting the Mass-Metallicity Relation in Protocluster Environments at Cosmic Noon.
- “Direct” Gas-phase Metallicity in Local Analogs of High-redshift Galaxies: Empirical Metallicity Calibrations for High-redshift Star-forming Galaxies. ApJ 859 (2), pp. 175. External Links: Document, 1805.08224 Cited by: §III.3, Table 3.
- A fundamental relation between the metallicity, gas content and stellar mass of local galaxies. MNRAS 433 (2), pp. 1425–1435. External Links: Document, 1304.4940 Cited by: §IV.2.
- Grizli: Grism redshift and line analysis software Note: Astrophysics Source Code Library, record ascl:1905.001 Cited by: §II, MAMMOTH-Grism: Revisiting the Mass-Metallicity Relation in Protocluster Environments at Cosmic Noon.
- Stellar population synthesis at the resolution of 2003. MNRAS 344 (4), pp. 1000–1028. External Links: Document, astro-ph/0309134 Cited by: §III.2.
- Mapping the Most Massive Overdensities through Hydrogen (MAMMOTH). II. Discovery of the Extremely Massive Overdensity BOSS1441 at z = 2.32. ApJ 839 (2), pp. 131. External Links: Document, 1609.02913 Cited by: §I, Figure 1, §IV.2, §IV.2.
- Mapping the Most Massive Overdensity Through Hydrogen (MAMMOTH) I: Methodology. ApJ 833 (2), pp. 135. External Links: Document, 1512.06859 Cited by: §I.
- Discovery of an Enormous Ly Nebula in a Massive Galaxy Overdensity at z = 2.3. ApJ 837 (1), pp. 71. External Links: Document, 1609.04021 Cited by: §I.
- The environmental dependence of the stellar and gas-phase mass-metallicity relation at 2 < z < 4. A&A 664, pp. A75. External Links: Document, 2203.04934 Cited by: §I.
- The Dust Content and Opacity of Actively Star-forming Galaxies. ApJ 533 (2), pp. 682–695. External Links: Document, astro-ph/9911459 Cited by: §III.2, §III.3.
- Inferring the star formation histories of massive quiescent galaxies with BAGPIPES: evidence for multiple quenching mechanisms. MNRAS 480 (4), pp. 4379–4401. External Links: Document, 1712.04452 Cited by: §III.2, MAMMOTH-Grism: Revisiting the Mass-Metallicity Relation in Protocluster Environments at Cosmic Noon.
- Gas inflow and metallicity drops in star-forming galaxies. MNRAS 457 (3), pp. 2605–2612. External Links: Document, 1509.02051 Cited by: §I.
- Galactic Stellar and Substellar Initial Mass Function. PASP 115 (809), pp. 763–795. External Links: Document, astro-ph/0304382 Cited by: §III.2, §III.4.
- The MOSDEF Survey: Environmental Dependence of the Gas-phase Metallicity of Galaxies at 1.4 z 2.6*. The Astrophysical Journal 908 (2), pp. 120. External Links: ISSN 0004-637X, Document Cited by: §I, §I, §IV.2, §IV.2, §IV.2.
- Galaxy Protoclusters as Drivers of Cosmic Star Formation History in the First 2 Gyr. ApJ 844 (2), pp. L23. External Links: Document, 1705.01634 Cited by: §I.
- Ancient Light from Young Cosmic Cities: Physical and Observational Signatures of Galaxy Proto-clusters. ApJ 779 (2), pp. 127. External Links: Document, 1310.2938 Cited by: §I.
- The Impact of Outflows Driven by Active Galactic Nuclei on Metals in and around Galaxies. ApJ 904 (1), pp. 8. External Links: Document, 2009.10184 Cited by: §I.
- Disentangling Morphology, Star Formation, Stellar Mass, and Environment in Galaxy Evolution. ApJ 621 (1), pp. 201–214. External Links: Document, astro-ph/0411359 Cited by: §I.
- The MOSDEF Survey: Optical Active Galactic Nucleus Diagnostics at z ~2.3. ApJ 801 (1), pp. 35. External Links: Document, 1409.6522 Cited by: Figure 3, §III.5.
- The Evolution of Galaxy Structure Over Cosmic Time. ARA&A 52, pp. 291–337. External Links: Document, 1403.2783 Cited by: §I.
- The Mass-Metallicity and the Fundamental Metallicity Relation revisited on a fully Te-based abundance scale for galaxies. MNRAS 491 (1), pp. 944–964. External Links: 1910.00597, ISSN 0035-8711, 1365-2966, Document Cited by: §IV.2.
- Association of cold gas, massive galaxies, and AGNs in a filamentary protocluster traced by triple narrow-band imaging. arXiv e-prints, pp. arXiv:2510.12393. External Links: 2510.12393 Cited by: §I.
- Star-formation activity of low-mass galaxies at the peak epoch of galaxy formation probed by deep narrow-band imaging. MNRAS 531 (2), pp. 2335–2355. External Links: Document, 2405.20663 Cited by: §I.
- The implications of the surprising existence of a large, massive CO disk in a distant protocluster. A&A 608, pp. A48. External Links: Document, 1701.05250 Cited by: §I.
- Galaxy bimodality due to cold flows and shock heating. MNRAS 368 (1), pp. 2–20. External Links: ISSN 0035-8711, Document Cited by: item 1.
- The stellar mass function of quiescent galaxies in 2 < z < 2.5 protoclusters. MNRAS 527 (3), pp. 8598–8617. External Links: Document, 2312.12380 Cited by: §I.
- Active galactic nuclei feedback, quiescence and circumgalactic medium metal enrichment in early-type galaxies. MNRAS 468 (1), pp. 751–768. External Links: Document, 1702.06965 Cited by: §I.
- Gas kinematics, morphology and angular momentum in the FIRE simulations. MNRAS 473 (2), pp. 1930–1955. External Links: ISSN 0035-8711, Document Cited by: item 2.
- The Mass-Metallicity Relation at z>~2. ApJ 644 (2), pp. 813–828. External Links: Document, astro-ph/0602473 Cited by: §I, §IV.2.
- emcee: The MCMC Hammer Note: Astrophysics Source Code Library, record ascl:1303.002 Cited by: §III.3, MAMMOTH-Grism: Revisiting the Mass-Metallicity Relation in Protocluster Environments at Cosmic Noon.
- Flows around galaxies: I. The dependence of galaxy connectivity on cosmic environments and effects on the star formation rate. A&A 671, pp. A160. External Links: ISSN 0004-6361, 1432-0746, Document Cited by: item 1.
- Star formation efficiency across large-scale galactic environments. MNRAS 528 (3), pp. 4393–4408. External Links: Document, 2309.01277 Cited by: §I.
- Astropy: Community Python library for astronomy Note: Astrophysics Source Code Library, record ascl:1304.002 Cited by: MAMMOTH-Grism: Revisiting the Mass-Metallicity Relation in Protocluster Environments at Cosmic Noon.
- Physical properties of simulated galaxy populations at z = 2 - I. Effect of metal-line cooling and feedback from star formation and AGN. MNRAS 435 (4), pp. 2931–2954. External Links: Document, 1211.1021 Cited by: §I.
- The impact of protocluster environments at z = 1.6. MNRAS 464 (1), pp. 876–884. External Links: Document, 1609.08629 Cited by: §I.
- H emitters in z 2 protoclusters: evidence for faster evolution in dense environments. MNRAS 415 (4), pp. 2993–3005. External Links: Document, 1103.4364 Cited by: §I.
- The JWST Advanced Deep Extragalactic Survey: Discovery of an Extreme Galaxy Overdensity at z = 5.4 with JWST/NIRCam in GOODS-S. ApJ 962 (2), pp. 124. External Links: Document, 2302.10217 Cited by: §I.
- The Mass-Metallicity Relation at z 1-2 and Its Dependence on the Star Formation Rate. ApJ 919 (2), pp. 143. External Links: Document, 2107.00672 Cited by: §I, §III.6.
- Active Galactic Nuclei Emission Line Diagnostics and the Mass-Metallicity Relation up to Redshift z ~2: The Impact of Selection Effects and Evolution. ApJ 788 (1), pp. 88. External Links: Document, 1403.6832 Cited by: §III.5.
- A New Diagnostic of Active Galactic Nuclei: Revealing Highly Absorbed Systems at Redshift >0.3. ApJ 736 (2), pp. 104. External Links: Document, 1105.3194 Cited by: §III.5.
- The Absence of an Environmental Dependence in the Mass-Metallicity Relation at z = 2. ApJ 802 (2), pp. L26. External Links: Document, 1503.05559 Cited by: §I, §IV.2, §IV.2, §IV.2.
- Effect of Local Environment and Stellar Mass on Galaxy Quenching and Morphology at 0.5 < z < 2.0. ApJ 847 (2), pp. 134. External Links: Document, 1706.03780 Cited by: §I.
- Satellite Quenching and Galactic Conformity at 0.3 < z < 2.5. ApJ 817 (1), pp. 9. External Links: Document, 1511.02862 Cited by: §I.
- Star Formation in Galaxies Along the Hubble Sequence. ARA&A 36, pp. 189–232. External Links: Document, astro-ph/9807187 Cited by: §III.4.
- Hot outflows in galaxy clusters. MNRAS 452 (4), pp. 4361–4376. External Links: Document, 1507.05973 Cited by: §I.
- THE MASS–METALLICITY RELATION OF A z 2 PROTOCLUSTER WITH MOSFIRE. The Astrophysical Journal 774 (2), pp. 130. External Links: ISSN 0004-637X, Document Cited by: §I, §I, §IV.2, §IV.2, §IV.2.
- Chemical evolution of the galactic disk with radial gas flows.. ApJ 290, pp. 154–170. External Links: Document Cited by: §I.
- TFIT: A Photometry Package Using Prior Information for Mixed-Resolution Data Sets. PASP 119 (861), pp. 1325–1344. External Links: Document Cited by: §III.2.
- A 13-Billion-Year View of Galaxy Growth: Metallicity Gradient Evolution from the Local Universe to with JWST and Archival Surveys. arXiv e-prints, pp. arXiv:2506.12129. External Links: Document, 2506.12129 Cited by: §I.
- Insights on Metal Enrichment and Environmental Effect at with JWST ASPIRE/EIGER and Chemical Evolution Model. arXiv e-prints, pp. arXiv:2504.18616. External Links: Document, 2504.18616 Cited by: §I.
- First Census of Gas-phase Metallicity Gradients of Star-forming Galaxies in Overdense Environments at Cosmic Noon. ApJ 929 (1), pp. L8. External Links: Document, 2204.03008 Cited by: §I.
- The mass-metallicity relations for gas and stars in star-forming galaxies: strong outflow versus variable IMF. MNRAS 474 (1), pp. 1143–1164. External Links: Document, 1710.11135 Cited by: §I.
- Statistical Correlation between the Distribution of Ly Emitters and Intergalactic Medium H I at z 2.2 Mapped by the Subaru/Hyper Suprime-Cam. ApJ 907 (1), pp. 3. External Links: Document, 2008.01733 Cited by: §I.
- What boost galaxy mergers in two massive galaxy protoclusters at z = 2.24?. MNRAS 523 (2), pp. 2422–2439. External Links: Document, 2305.10932 Cited by: §I.
- The origin and evolution of the galaxy mass-metallicity relation. MNRAS 456 (2), pp. 2140–2156. External Links: Document, 1504.02097 Cited by: item 2.
- De re metallica: the cosmic chemical evolution of galaxies. A&A Rev. 27 (1), pp. 3. External Links: Document, 1811.09642 Cited by: §I.
- A fundamental relation between mass, star formation rate and metallicity in local and high-redshift galaxies. MNRAS 408 (4), pp. 2115–2127. External Links: Document, 1005.0006 Cited by: §IV.2.
- T-PHOT version 2.0: Improved algorithms for background subtraction, local convolution, kernel registration, and new options. A&A 595, pp. A97. External Links: Document, 1609.00146 Cited by: §III.2, MAMMOTH-Grism: Revisiting the Mass-Metallicity Relation in Protocluster Environments at Cosmic Noon.
- The 3D-HST Survey: Hubble Space Telescope WFC3/G141 Grism Spectra, Redshifts, and Emission Line Measurements for ~100,000 Galaxies. ApJS 225 (2), pp. 27. External Links: Document, 1510.02106 Cited by: §III.2.
- Accelerated Emergence of Evolved Galaxies in Early Overdensities at z 5.7. ApJ 982 (2), pp. 153. External Links: Document, 2408.10980 Cited by: §I.
- CONSTRAINTS ON THE RELATIONSHIP BETWEEN StelLAR MASS AND HALO MASS AT LOW AND HIGH REDSHIFT. ApJ 710 (2), pp. 903. External Links: ISSN 0004-637X, Document Cited by: item 1.
- What are protoclusters? - Defining high-redshift galaxy clusters and protoclusters. MNRAS 452 (3), pp. 2528–2539. External Links: Document, 1506.08835 Cited by: §I.
- JWST Census for the Mass-Metallicity Star Formation Relations at z = 4-10 with Self-consistent Flux Calibration and Proper Metallicity Calibrators. ApJS 269 (2), pp. 33. External Links: Document, 2301.12825 Cited by: §IV.2.
- LMFIT: Non-Linear Least-Square Minimization and Curve-Fitting for Python External Links: Document, Link Cited by: Figure 4, §III.6, MAMMOTH-Grism: Revisiting the Mass-Metallicity Relation in Protocluster Environments at Cosmic Noon.
- Mass, metal, and energy feedback in cosmological simulations. MNRAS 387 (2), pp. 577–600. External Links: ISSN 0035-8711, 1365-2966, Document Cited by: item 2.
- The realm of the galaxy protoclusters. A review. A&A Rev. 24 (1), pp. 14. External Links: Document, 1610.05201 Cited by: §I.
- UNCOVER/MegaScience: No Evidence of Environmental Quenching in a z 2.6 Protocluster. ApJ 990 (1), pp. L24. External Links: Document, 2504.06334 Cited by: §I.
- Gas-phase Metallicity of Local Active Galactic Nuclei in the GASP and MaNGA Surveys: The Role of Ram Pressure Stripping. ApJ 958 (2), pp. 147. External Links: Document, 2309.05332 Cited by: §I.
- Enhanced star formation and metallicity deficit in the USS 1558-003 forming protocluster at z = 2.53. MNRAS 527 (4), pp. 10221–10238. External Links: ISSN 0035-8711, Document Cited by: §I, §I, §IV.2, §IV.2, §IV.2.
- COALAS: III. The ATCA CO(1–0) look at the growth and death of H emitters in the Spiderweb protocluster at z = 2.16. A&A 696, pp. A236. External Links: Document, 2411.12138 Cited by: §I.
- Signs of environmental effects on star-forming galaxies in the Spiderweb protocluster at z = 2.16. MNRAS 518 (2), pp. 1707–1734. External Links: Document, 2209.13069 Cited by: §I, §IV.1, §IV.2, §IV.2, §IV.2, §IV.2.
- Environmental dependence of AGN activity and star formation in galaxy clusters from Magneticum simulations. A&A 683, pp. A57. External Links: Document, 2307.06374 Cited by: §I.
- The MOSDEF Survey: The Evolution of the Mass-Metallicity Relation from z = 0 to z 3.3. ApJ 914 (1), pp. 19. External Links: Document, 2009.07292 Cited by: §I, Figure 2, Figure 5, §IV.1, §IV.2, §IV.2.
- The MOSDEF Survey: A Stellar Mass-SFR-Metallicity Relation Exists at z 2.3. ApJ 858 (2), pp. 99. External Links: Document, 1711.00224 Cited by: §IV.2.
- Unveiling the Cosmic Chemistry: Revisiting the Mass–Metallicity Relation with JWST/NIRSpec at 4 < z < 10. ApJ 978 (2), pp. 136. External Links: Document, 2408.07974 Cited by: §IV.2.
- Evidence for Gas-phase Metal Deficiency in Massive Protocluster Galaxies at z 2.2. ApJ 910 (1), pp. 57. External Links: Document, 2102.05637 Cited by: §I, §I, §IV.2, §IV.2, §IV.2.
- Spectroscopic Confirmation of Two Extremely Massive Protoclusters, BOSS1244 and BOSS1542, at z = 2.24. ApJ 915 (1), pp. 32. External Links: Document, 2105.02248 Cited by: §I, Figure 1, §IV.2, §IV.2.
- An early phase of environmental effects on galaxy properties unveiled by near-infrared spectroscopy of protocluster galaxies at z > 2. MNRAS 448 (1), pp. 666–680. External Links: Document, 1406.5219 Cited by: §I, §I, §IV.2, §IV.2.
- MAHALO Deep Cluster Survey II. Characterizing massive forming galaxies in the Spiderweb protocluster at z = 2.2. MNRAS 481 (4), pp. 5630–5650. External Links: Document, 1809.08755 Cited by: §I.
- A Highly Consistent Framework for the Evolution of the Star-Forming “Main Sequence” from z ~0-6. ApJS 214 (2), pp. 15. External Links: Document, 1405.2041 Cited by: Figure 2, §IV.1.
- Theoretical values for the [OIII] 5007/4959 line-intensity ratio and homologous cases. MNRAS 312 (4), pp. 813–816. External Links: Document Cited by: §III.6.
- Glimpsing the imprint of local environment on the galaxy stellar mass function. MNRAS 472 (3), pp. 3512–3531. External Links: Document, 1709.00011 Cited by: §I.
- Effect of the local and large-scale environment on the star formation histories of galaxies. A&A 691, pp. A341. External Links: Document, 2410.00959 Cited by: §I.
- X-ray view of a massive node of the Cosmic Web at z 3: I. An exceptional overdensity of rapidly accreting supermassive black holes. A&A 694, pp. A165. External Links: Document, 2410.03933 Cited by: §I, §IV.1.
- The Origin of the Mass-Metallicity Relation: Insights from 53,000 Star-forming Galaxies in the Sloan Digital Sky Survey. ApJ 613 (2), pp. 898–913. External Links: Document, astro-ph/0405537 Cited by: §I.
- Metal Deficiency in Cluster Star-Forming Galaxies At Z = 2. ApJ 801 (2), pp. 132. External Links: Document, 1410.1437 Cited by: §I, §I, §IV.2, §IV.2.
- Fast supermassive black hole growth in the SPT2349–56 protocluster at z = 4.3. A&A 689, pp. A130. External Links: Document, 2406.13005 Cited by: §I.
- Gas-phase Metallicity as a Diagnostic of the Drivers of Star Formation on Different Spatial Scales. ApJ 910 (2), pp. 137. External Links: Document, 2009.01935 Cited by: §I.
- Environmental Dependence of the Mass-Metallicity Relation in Cosmological Hydrodynamical Simulations. ApJ 951 (1), pp. 66. External Links: Document, 2305.08161 Cited by: item 1.
- A Census of Sub-kiloparsec Resolution Metallicity Gradients in Star-forming Galaxies at Cosmic Noon from HST Slitless Spectroscopy. ApJ 900 (2), pp. 183. External Links: Document, 1911.09841 Cited by: §III.3.
- Discovery of Strongly Inverted Metallicity Gradients in Dwarf Galaxies at z 2. ApJ 882 (2), pp. 94. External Links: Document, 1808.08800 Cited by: §III.3.
- The Grism Lens-amplified Survey from Space (GLASS). X. Sub-kiloparsec Resolution Gas-phase Metallicity Maps at Cosmic Noon behind the Hubble Frontier Fields Cluster MACS1149.6+2223. ApJ 837 (1), pp. 89. External Links: Document, 1610.07558 Cited by: §III.3.
- The Mass-Metallicity Relation at Cosmic Noon in Overdense Environments: First Results from the MAMMOTH-Grism HST Slitless Spectroscopic Survey. ApJ 926 (1), pp. 70. External Links: Document, 2108.06373 Cited by: §I, §I, §I, Figure 1, Figure 1, §III.2, §III.3, §IV.2, §IV.2.
- Hot Atmospheres, Cold Gas, AGN Feedback and the Evolution of Early Type Galaxies: A Topical Perspective. Space Sci. Rev. 215 (1), pp. 5. External Links: Document, 1811.05004 Cited by: §I.
- The impact of gas accretion and AGN feedback on the scatter of the mass-metallicity relation. MNRAS 527 (4), pp. 11043–11052. External Links: Document, 2212.10657 Cited by: §I.
- Inspiraling streams of enriched gas observed around a massive galaxy 11 billion years ago. Science 380 (6644), pp. 494–498. External Links: Document, 2305.02344 Cited by: item 2.
- MAMMOTH: confirmation of two massive galaxy overdensities at z = 2.24 with H emitters. MNRAS 500 (4), pp. 4354–4364. External Links: Document, 2009.08068 Cited by: §I.
- MAMMOTH-MOSFIRE: Environmental Effects on Galaxy Interstellar Medium at . arXiv e-prints, pp. arXiv:2505.04212. External Links: Document, 2505.04212 Cited by: §I.
- Noema formIng Cluster survEy (NICE): A census of star formation and cold gas properties in massive protoclusters at 1.5 < z < 4. A&A 701, pp. A234. External Links: Document, 2507.09971 Cited by: §I.