Historic microlensing events in the Euclid Galactic Bulge Survey
Abstract
Context. Microlensing campaigns have a long history of observations covering the Galactic bulge, where thousands of detections have been obtained, including many exoplanetary systems. The Euclid Galactic Bulge Survey represents a unique opportunity to revisit a large number of past events and attempt the lens-source resolution of known events falling in the covered area.
Aims. As the analysis of individual events requires non-negligible efforts, it is important to establish priorities among all possible targets, identifying those candidates with the higher chance for a successful resolution of the lens from the source and with the highest scientific interest.
Methods. Drawing from the databases of the three main microlensing surveys (OGLE, MOA and KMTNet), we compile the complete catalog of past microlensing events in the Euclid survey footprint up to year 2023, containing 7801 entries. By re-modeling all events and cross-checking with Galactic models, we estimate the relative lens-source proper motions for all events.
Results. Taking into account all uncertainties, for each microlensing event we are able to estimate the probability that the lens is separated from the source by more than a given angular distance threshold. Hence, we rank all events by their resolution probability, providing additional useful information that will guide future analyses on the most promising candidates. A particular attention is dedicated to the 51 known planetary microlensing events.
Key Words.:
gravitational lensing: micro; Methods: data analysis; planetary systems1 Introduction
Gravitational microlensing refers to the temporary increase in the flux of a background source due to the deflection of its light by the gravitational field of an object passing across the line of sight (Paczynski 1986). Following Paczynski’s intuition and description of the basic characteristics of the microlensing phenomenon, several astronomers formed collaborations supporting seasonal observational campaigns aimed at the detection of such transient phenomena (Alcock et al. 1993; Udalski et al. 1993). Crowded stellar fields such as the Galactic Bulge offer the highest chance of the alignment needed for microlensing to occur, since stars in the disk or even in the bulge itself may serve as gravitational lenses to background stars (Udalski et al. 1994b; Alcock et al. 2000b; Afonso et al. 2003; Sumi et al. 2003, 2013; Mróz et al. 2019; Nunota et al. 2025). By the photometric measurement of the flux variation throughout the microlensing event, it is generally possible to obtain information about the lens system, regardless of the light from the lens itself, which may even be completely dark. For this reason, microlensing has been first employed to test the possibility that the dark matter was made of compact objects (Alcock et al. 2000a; Tisserand et al. 2007; Wyrzykowski et al. 2011; Niikura et al. 2019; Mróz et al. 2024b, a), then to study stellar populations in the disk, in the bulge and nearby galaxies, and mostly for the detection of extrasolar planets orbiting the lens stars (Mao & Paczynski 1991; Bond et al. 2004; Gaudi 2012; Tsapras 2018; Mroz & Poleski 2023). More recently, a microlensing event has led to the discovery of the first official isolated black hole wandering across our Galaxy (Sahu et al. 2022; Lam et al. 2022).
The duration of a microlensing event is set by the so-called Einstein time (Eq. 1), which is the basic observable parameter depending on the mass, distance and relative proper motion of lens and source. Such parameter alone is insufficient to clarify the real nature of an individual lens, since e.g. we may have a fast massive lens or a slow light lens leading to the same Einstein time. Without additional information, microlensing can only be employed in statistical studies on the whole population of lenses. For example, an excess in the number of short events could be due to a population of free-floating planets (Mróz et al. 2017b; Sumi et al. 2023).
There are several ways to break this degeneracy for an individual event: the measurement of the annual parallax (Eq. 3) is possible for long enough events (Gould 1992), the finite size of the source star (Eq. 4) intervenes if the impact parameter between the lens trajectory and the line of sight is small enough (Witt & Mao 1994), observations from a satellite may fix the relative parallax between lens and source (Refsdal 1966).
In addition to these methods, we may attempt direct lens detection if we wait long enough to let the lens move away from the glare of the source (Bennett et al. 2006; Beaulieu 2018). It is clear that such detection would immediately return the relative lens-source proper motion. In addition, the lens flux can be used as an additional constraint on the lens mass and distance through the use of stellar models. This technique has been successful in a dozen cases, for which Adaptive Optics (AO) at 10 m-class telescopes has been required or observations from the Hubble Space Telescope (HST). In several cases, such observations have been able to discriminate between different alternatives and drive microlensing models toward the correct physical description of the event (Bennett et al. 2016; Vandorou et al. 2020; Bennett et al. 2024; Terry et al. 2024). In all cases, the lens detection has dramatically shrunk the error bars in the mass and distance measurements of the lens (Batista et al. 2014; Bennett et al. 2015; Bhattacharya et al. 2018; Bennett et al. 2020; Blackman et al. 2021; Bhattacharya et al. 2023; Vandorou et al. 2025a).
Indeed, the resolution of the lens from the source is a key element in the strategy devised for the future Galactic Bulge Time Domain Survey (GBTDS) to be performed by the Roman space telescope111https://roman.gsfc.nasa.gov/ starting from 2027 (Bhattacharya et al. 2019). In fact, by observing the same fields after a few years, Roman will likely detect the lenses responsible for most of the microlensing events found in the first season and vice versa. For such events, the uncertainty in the masses of the discovered exoplanets will be significantly reduced, contributing to meeting the science requirements set by the mission goals (Terry et al. 2026b).
In the middle between ground-based surveys and the space-based survey by Roman comes the ESA Euclid mission222https://www.esa.int/Science_Exploration/Space_Science/Euclid, which shares many similarities with Roman and is an ideal precursor to the NASA mission (Mellier et al. 2025). While engaged with its Wide and Deep surveys, devoted to discover the nature of Dark Energy, Euclid has taken a snapshot of the same fields that will be visited by Roman. With at least two years span between the Euclid images and the first Roman observations and a similar Point-Spread-Function (PSF) size, Euclid will further increase the chances of lens detections for future microlensing events (Bachelet et al. 2022).
However, the same idea can be implemented looking backward at past microlensing events discovered by ground-based surveys over the past 20 years. For many of the older microlensing events, enough time has passed to see the lens well-separated from the source in Euclid images. We thus have an invaluable opportunity to revisit interesting events, such as planetary or binary lenses, validate the past models and reduce the uncertainties of all mass measurements. Besides the published individual events, it is possible to undertake a much broader statistical study embracing all microlensing events for which we can detect the lens. Population studies can receive a validation by the real flux we see from the lens. Even the non-detection of the lens can be of great value, since it may be used to prove that the lens is stellar remnant (Blackman et al. 2021). For short events that may be explained by a fast star or a slow free-floating planet, the second scenario would be favored in case of non-detection.
For all these reasons, we should not miss the opportunity to use Euclid images to boost the overall microlensing collection to a higher level of astrophysical information. As a start-up of this ambitious project, we should first identify all past microlensing events falling in Euclid fields and prioritize those that look most promising for the lens detection, trying to re-organize the existing information in such a way that is readily accessible to guide the incoming investigations. This is the goal of the present work. In section 2 we will first describe the Euclid Galactic Bulge Survey, we will then introduce the sources for past microlensing events in Section 3, presenting some overall statistics on microlensing events in Euclid fields. Section 4 will describe the methods we used to assess the probability for lens-source separation for all events. Section 5 brings the focus on published planets involved in this study, for which we have more information available. Finally, we draw the conclusions in Section 6.
2 The Euclid Galactic Bulge Survey

The Euclid mission was launched on 1st July 2023 and is now orbiting in the Lagrangian point L2, while conducting a survey of the deep sky aimed at an accurate reconstruction of the history of our Universe, clarifying the nature of dark matter and dark energy and the formation of large-scale structures (Mellier et al. 2025). It is made of a Korsch 1.2m telescope with an effective field of view of 0.54 deg2 (Racca et al. 2016). In order to keep the telescope and the payload at the temperature of 126K, the telescope is shielded against sunlight and the solar aspect angle must be maintained close to 90∘. Further constraints arise to avoid stray light in the optics and affect the survey strategy of the mission. Because of these pointing restrictions, the fields in the Galactic bulge of interest for microlensing can only be viewed in two windows of about 23 days around the equinoxes.
Euclid is able to support the detection and characterization of extrasolar planets by microlensing in two ways: a coordinated time-domain survey of the Galactic Bulge simultaneous with Roman to be performed during the allowed pointing windows (Penny et al. 2013; Bachelet & Penny 2019); a single snapshot taken well before the beginning of Roman observations (Bachelet et al. 2022). A simultaneous survey would allow immediate parallax determination for most microlensing events observed by the two missions, in particular short events that are amenable candidates for free-floating planets. Such survey could be proposed for an extended Euclid mission. A one-time survey of the Galactic Bulge has been performed between 23rd and 24th March 2025 and constitutes the Euclid Galactic Bulge Survey (EGBS), which is described in great detail by Beaulieu et al. (2026) and briefly introduced here.
Euclid has two wide-field imaging instruments: VIS and NISP, operating in visual and near-infrared bands respectively. NISP was not used in the course of EGBS, so here we briefly describe VIS only. VIS is made of 36 CCDs in a 6 × 6 array. Each CCD has 4132 × 4096 pixels in four quadrants, so the VIS images comprise pixels in 144 quadrants (Cropper et al. 2016). The wavelength sensitivity of VIS is . The plate scale is which leads to moderate undersampling of the PSF, whose typical width is of the order of 0.14” in the images. Since the VIS band is relatively broad, we must also take into account the fact that the PSF is chromatic: redder sources will have a broader PSF. Careful modeling of the PSF is needed to achieve correct photometry and astrometry. For these reasons, the reference observing sequence (ROS) includes 4 consecutive exposures per-field dithered according to a characteristic S-shape pattern. Multiple dithered exposures of the same field allow for a much more accurate reconstruction of the PSF at subpixel level, paving the way to precision astrometry.
| Field | RA(∘) | Dec(∘) |
|---|---|---|
| 1 | 267.4250 | -30.0194 |
| 2 | 267.4406 | -29.2595 |
| 3 | 267.4560 | -28.4996 |
| 4 | 268.2266 | -30.1299 |
| 5 | 268.2374 | -29.3699 |
| 6 | 268.2480 | -28.61 |
| 7 | 269.0296 | -30.2366 |
| 8 | 269.0355 | -29.4766 |
| 9 | 269.0414 | -28.7166 |
The EGBS imaged a total of nine fields in Baade’s window. The coordinates of the centers of the fields are reported in Table 1. The fields were rotated by from the north. Fig. 1 shows the fields of the survey superposed on a Gaia image of the Milky Way (Gaia Collaboration et al. 2018). Note that the Galactic center lies on the right, where the extinction becomes more and more severe. We note that some small blank spaces are left between the dithers and the interchip gaps of the VIS instrument.
The exposure time of each dither was 400s. For those stars enjoying more dithers, the limiting magnitude reaches up to AB 25.
Finally, an additional field outside the bulge was pointed with the purpose of facilitating the reconstruction of the PSF at the time of the EGBS. The data have been publicly released in June 2026 (Beaulieu et al. 2026).
3 Ground microlensing surveys
Observational campaigns for the detection of microlensing events started back in 1992, with the first project, the Optical Gravitational Lens Experiment (OGLE) still ongoing (Udalski et al. 1992). After the first pioneering 10 years with only a few events detected per year, the detection of new microlensing events received a boost from automatic alert systems, which were implemented by OGLE, Microlensing Observations in Astrophysics (MOA) and later on by the Korean Microlensing Telescope Network (KMTNet). We will entirely rely on the databases from these three main surveys to compile our list of historic microlensing events.
OGLE observes from the 1.3m Warsaw telescope located in Las Campanas Observatory in Chile. It has undergone several upgrades bringing it to the current phase IV, whose details are described by Udalski et al. (2015). In our catalog we investigate all events detected by OGLE-II, OGLE-III and OGLE-IV, ranging from year 1998 to 2023. Most of these events were alerted in real time thanks to the Early Warning System (EWS) (Udalski et al. 1994a), but we also include some additional events that were recovered offline (Mróz et al. 2019; Wyrzykowski et al. 2015). For the purpose of this paper, we have agreed to use the online photometry available at OGLE online archive333https://ogle.astrouw.edu.pl/ogle4/ews/ews.html and use re-reduced photometry only in exceptional cases, as explained in Sect. 4.1. We note that OGLE photometry comes in standard calibrated Cousins I-band, which will represent our standard for our analysis.
MOA observes from the 1.8m MOA-II telescope located at the University of Canterbury’s Mount John Observatory in New Zealand (Bond et al. 2001; Sumi et al. 2003). It underwent a major upgrade in 2006, when it started high-cadence observations. We include all events from the MOA archive444https://moaprime.massey.ac.nz/moaarchive starting from year 2000. We also include some anomalous events that were found in offline searches555http://iral2.ess.sci.osaka-u.ac.jp/~moa/anomaly/bin/index.html. Similarly to OGLE, we use online photometry for MOA as well. This comes in a customized red band, encompassing standard R- and I-bands. Calibration of MOA data to standard filters requires additional steps that need to be tailored to specific events. In our analysis, therefore, we will incorporate MOA photometry only in the form of instrumental magnitudes.
KMTNet uses three identical 1.6 m telescopes at the Cerro Tololo Inter-American Observatory (CTIO) in Chile, the South African Astronomical Observatory (SAAO) in South Africa, and the Siding Spring Observatory (SSO) in Australia (Kim et al. 2016) (Kim et al. 2016). As they started observations in 2015, their baseline to EGBS is reduced compared to the other surveys, but still the number of short events found by this survey encourages the use of these data as well. Online public photometry for KMTNet has been used666https://kmtnet.kasi.re.kr/ulens/. We have used their I-band photometry which has a sufficiently good calibration for our purposes.
4 Historic microlensing events in EGBS

The EGBS frames come with WCS astrometry for a precise reconstruction of the field coordinates. This allows us to easily check the presence of each of the past microlensing events discovered from the ground in the footprint of the EGBS. In the public repository https://github.com/euclid-egbs/HistoricList we have provided a script that returns the file names and the corresponding pixel coordinates in which an event in given astronomical coordinates appears.
Using this tool, we have selected the historic events imaged by Euclid among all ground surveys, collecting 7801 independent events. They are shown in Fig. 2 along with the EGBS fields. The decrease of events on the western side due to the increase of dust extinction as we approach the Galactic center is clearly visible. Within these events, we find 51 published planetary events, highlighted in red in the figure. These obviously constitute the targets of highest interest for the exoplanet community and will receive priority for the identification of the lenses. Among the most interesting events, we may mention OGLE-2006-BLG-109, the first multiplanetary event (Gaudi et al. 2008; Bennett et al. 2010), MOA-2011-BLG-293, with a possible lens detection by Keck that may lead to a candidate planet in the habitable zone awaiting further confirmation (Batista et al. 2014), OGLE-2005-BLG-390, a system with an icy 5.5 Earth-masses planet (Beaulieu et al. 2006), the Earth-mass planet OGLE-2016-BLG-1195b (Bond et al. 2017; Shvartzvald et al. 2017; Vandorou et al. 2025b), OGLE-2017-BLG-0173, a planet in a “Hollywood” (large source size) event Hwang et al. (2018b), the multiplanetary system OGLE-2018-BLG-1011 (Han et al. 2019), OGLE-2013-BLG-0341, a planet in a binary system (Gould et al. 2014), OGLE-2015-BLG-0966, OGLE-2018-BLG-0596 and OGLE-2017-BLG-0406, also observed by Spitzer (Street et al. 2016; Jung et al. 2019; Hirao et al. 2020), OGLE-2011-BLG-0462, the first isolated black hole discovered by microlensing (Sahu et al. 2022; Lam et al. 2022), the free-floating planet candidates KMT-2019-BLG-2073 (Kim et al. 2021) and OGLE-2017-BLG-0560 (Mróz et al. 2019).
Fig. 3 contains an overview of the events in EGBS divided by surveys. Some of the events have been observed by more than one survey. In this case, all the data are included in the re-analysis of Sect. 4.1. Fig. 4 shows the distribution of events per year of discovery. We note that a first boost in the number of events came in 2011 with the onset of OGLE-IV and another boost in 2015 is due to the start of the KMTNet project. The interruption in 2020 due to the Covid pandemic is also evident.


For each of these events, the surveys provide synthetic information on their web pages. This includes coordinates, a finder chart, some parameters obtained by single-lens-single-source fitting: the baseline magnitude, the peak epoch, the Einstein time, the peak magnification or the impact parameter. Finally, some comments are sometimes posted about interesting or problematic events. For all events, online photometry is also available, which is the basis for our re-modeling.
4.1 Re-modeling of events
Our goal is to compile a ranking of all microlensing events in EGBS based on the probability that the lens can be resolved by Euclid observations. Therefore, we need a full homogeneous re-analysis of all microlensing events with the same modeling platform and with the same criteria, also including binary lens and/or binary source modeling. The main parameters we wish to extract are the Einstein time and, when measurable, the microlensing parallax, due to the orbital motion of the Earth.
The Einstein time is the ratio between the Einstein angle and the relative lens-source proper motion as seen from the Earth at the time of the microlensing event:
| (1) |
The Einstein angle fixes the lensing power of the event and is given by:
| (2) |
where is the mass of the lens, is the difference of the geometric parallaxes of lens and source, and combines the Newton constant, the speed of light and the astronomical unit.
The microlensing parallax
| (3) |
can be measured for long enough events for which the Earth orbital motion is relevant or by satellite observations.
Finally, the source physical size can affect the microlensing light curve sometimes. The parameter
| (4) |
can be useful if the angular size of the source can be estimated by stellar models.
In general, in order to fully break the degeneracy between the proper motion , the lens mass and the distances to lens and source , it is necessary to have a good measurement of and , coupled with some hypothesis on the source through stellar models. It is clear that this is not possible for the vast majority of the microlensing events under examination in this investigation because finite-size effects are very rare, the microlensing parallax is less rare but not typically measured, in particular for short time-scale events, which are the most promising to be resolved by Euclid. Finally, a color–magnitude diagram (CMD) could be used to investigate the nature of the microlensing source, so as to estimate or to infer the source distance, but not all events have available color information in the target field.
Therefore, we will just compile our ranking based on the simplest information we can extract from our models: and when possible, the baseline magnitude and the peak epoch . The use of would require a CMD investigation for each event, which is clearly out of reach. The situation is different for published planetary events, for which the full investigation is already publicly available. We will dedicate a separate section (Section 5) to these events.
Having re-framed the scope of our re-modeling to , and , it is clear that the online photometry is generally sufficiently good to achieve such limited goal. In fact, the purpose of re-reduction by sophisticated pipelines is to improve the accuracy so as to reveal subtle features or anomalies in the light curve. While such work is of primary importance to detect and characterize planets correctly, it has very little impact on global parameters such as the time-scale of the event, which sets the Einstein time. The microlensing parallax may be affected by long-term systematics that could be present in online photometry, but given the lower priority of long time-scale events in our list, we accept the possibility that our estimate of parallax may be altered by systematics in some of these events. There is certainly no sufficient motivation to enterprise a titanic work of re-reduction of 7801 events only to adjust a few probabilities that remain very low anyway.
The modeling platform chosen for the re-analysis of all microlensing events in EGBS is RTModel777https://github.com/valboz/RTModel (Bozza 2024), which provides models in the single-lens-single-source, binary-source and binary-lens categories and proposes an assessment based on a comparison of the achieved by each model category. The initial conditions for fitting are taken from a grid search for single-lens models and from a template library for binary-lens models. The fitting algorithm is a Levenberg-Marquardt with a bumping mechanism preventing duplicates and enlarging the exploration of the parameter space. The code employed for the computation of microlensing magnification is VBMicrolensing (Bozza et al. 2025).
To speed-up the analysis for each event, we only include the data collected in the year of the peak, the year before and the year after, re-binned down to a maximum of 4000 data points. Such re-binning, as performed by RTModel preserves light curve variations and only acts on constant sections of the light curve (typically along the baseline), so it has virtually no impact on the inferred . Points deviating more than 10 from the extrapolation from neighbor points are also removed as outliers. For fitting we have imposed a semi–gaussian prior disfavoring negative blending on OGLE and KMTNet allowing for arbitrary positive blending and a gaussian prior on parallax components with . We have also restricted the search to , coherently with the clipping of our data on 3 years. Finally, since binary sources tend to interpret remaining outliers as a secondary source with extremely small source size, we have also imposed in the search for binary source models.
We are aware that there is a fraction of events alerted as microlensing and included in our sample that could actually be generated by other non-microlensing phenomena, such as eruptive or cataclismic variables, flares, background Supernovae, and so on. Most of these transients can be distinguished by a classical asymmetry test, since they have a much steeper rise and a slower descent. Therefore, we label as suspected non-microlensing phenomena all those events for which all photometric datasets agree that the time span from the baseline to the peak in the rising part is less than half the time span between the peak and the baseline in the descent. We do not exclude these events from the analysis and still report all the results as for genuine microlensing events, but they are clearly marked in the final catalog as possible contaminants.
For each event, we record the following information, useful for the estimate of the lens-source proper motion and the resolution probability:
-
•
best model category in the letter coding used by RTModel with an additional * for suspected contaminants;
-
•
-
•
Einstein time ;
-
•
baseline magnitude ;
-
•
microlensing parallax ;

The can be considered as an assessment of the quality of the input online photometry and consequently the reliability of the model. A high value can be determined by the presence of intrinsic scatter in the data, outliers, by an inaccurate model or by the presence of a non-microlensing signal (periodic or eruptive variables). Fig. 5 shows the distribution of this indicator on the modeled events. We notice that all OGLE events are modeled with a , indicating that our modeling is very efficient and robust on cleaner datasets. Online MOA photometry contains more outliers and is more noisy, but still all events are modeled with . For KMTNet photometry, we find a long tail extending up to 30, due to an overall lower quality. Without a preliminary deep cleaning of these datasets, we cannot expect better values of the , but still these data are precious because they contribute a substantial fraction of the total microlensing events and fill the gaps between other surveys.

It is interesting to see how much the original Einstein times reported by the surveys in their online analysis changes after our re-modeling. Fig. 6 shows a comparison between the Einstein time found by RTModel versus the Einstein time as found in the online analysis for each of the three surveys. For all three collaborations, we find a good agreement for most of the events, but there is a non-negligible fraction of events for which the Einstein times are very different. Looking closely at some of these, we find several different cases:
-
•
Partially covered events (only the rise or only the descent) for which a good estimate of the Einstein time is impossible.
-
•
Poorly sampled events, which are the majority. For these events the Einstein time is strongly degenerate with the blending and the impact parameter. The reported error bars are huge and actually make the old and new estimates compatible. In the OGLE plot, we may notice a tendency for RTModel to report a longer Einstein time compared to OGLE because OGLE gives priority to the results obtained with zero blending in such cases.
-
•
Very noisy events, which have a naturally large uncertainty in the Einstein time.
-
•
Problematic or non-microlensing events as tagged by our filter.
-
•
Binary-lens or binary-source events or even single-lens-single-source with a significant parallax signal, for which the original estimates of obtained by the Paczynski light curve may be fairly distant from the true value after careful re-modeling.
-
•
Events for which the use of multiple surveys change the estimate of the Einstein time.
We note that the main purpose of our re-modeling is to address the last two classes of events, while the other classes will naturally come with large error bars tracking the impossibility to derive significant information on based on the historic data alone.


The numbers of events falling in the three main categories (single-lens-single-source, binary-source, binary-lens) are reported in Fig. 7 together with the events marked as non-microlensing. As expected, the majority of events is made by single-lens-single-source, with a classified as binary-lens or binary-source. Non-microlensing events amount to as found by our filter. Besides genuine binaries, it is certainly possible that scatter in the baseline can sometimes mimic an anomaly that is reported as a signature of a binary-lens or a binary-source. This is a consequence of the adoption of online photometry, which is naturally plagued by outliers or noise that would be removed by targeted photometry. RTModel obviously finds a decrease in by adding lenses and sources on problematic points of these light curves. By excluding too small sources, we have dramatically reduced the impact of such spurious peaks obtaining a more robust classification. The residual presence of some misclassified events does not spoil the measurement of the Einstein time, which is fixed by the longer-scale genuine microlensing signal.
We were not able to extract and for all microlensing events. As already anticipated, for MOA-only events we are unable to have a good enough calibration to estimate . The microlensing parallax is measurable only for a minority of events. Fig. 8 quantifies the numbers of events based on the measured parameters. About 76% of events are assessed based on the measured and baseline magnitude . Parallax is measured in 16% of events.


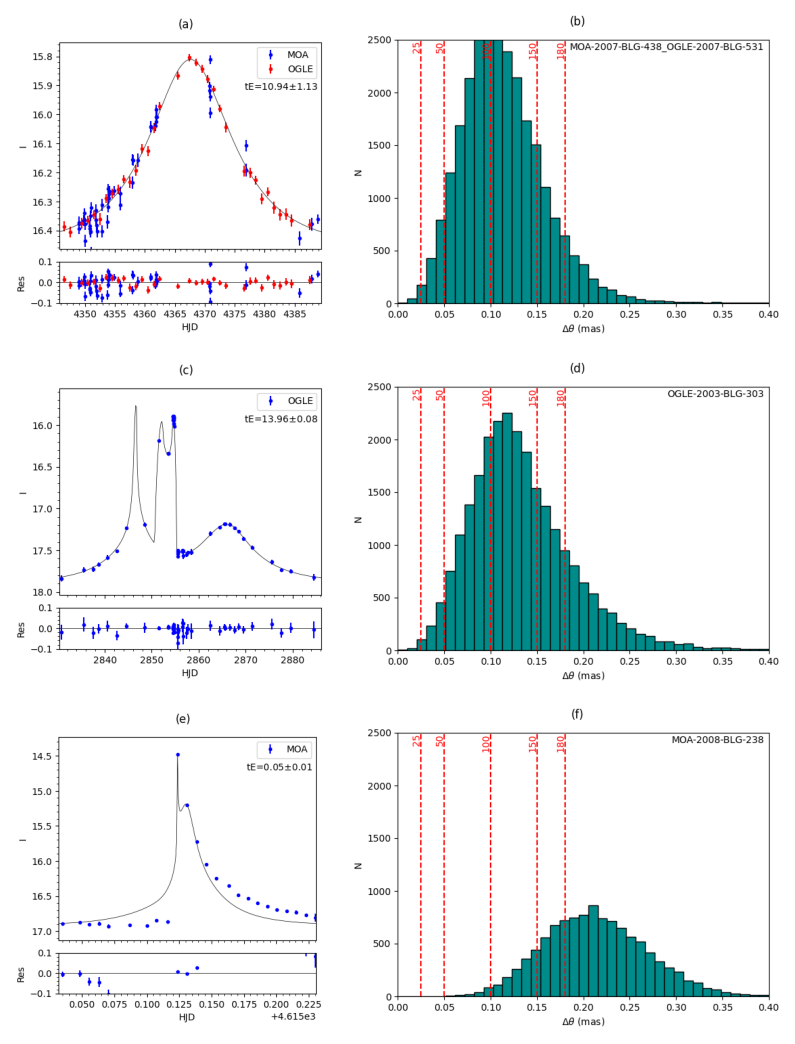
Fig. 9 shows the distribution of events in terms of the baseline magnitude . This reflects the luminosity function in the bulge, with a decline for following the difficulty of performing accurate photometry from the ground for such faint sources.
Fig. 10 contains the distribution of the events in the Einstein time , whose Gaussian shape peaking at 20 days closely resembles similar distributions obtained by the surveys (Sumi et al. 2023; Mróz et al. 2017b). Only the events with an uncertainty on lower than itself are displayed, thus excluding 448 events. We also remind that we limited our search to Einstein times shorter than one year, so 394 longer events have been dropped from this histogram. On the other side, we note that there are some very short events, which are associated with faster lens-source relative proper motion leading to higher chances for the resolution in Euclid. These events may be also due to free-floating planets and thus deserve to be treated with the highest care.
4.2 Galactic model and estimated proper motion
After the re-modeling described in the previous sub-section, for each microlensing event in EGBS we now have robust estimates of the basic parameters, such as Einstein time, baseline magnitude and microlensing parallax. As said before, this is not sufficient to fully break the degeneracy between mass, distance and proper motion. In order to make a prediction on the probability of separating the lens from the source, we must rely on prior expectations from our knowledge of the Galactic stellar populations. Their space distribution and their kinematics provide guidance on the most likely ranges for the proper motion of each microlensing event. Crossing this prior expectation with the constraints coming from our measured parameters, we can derive posterior probability distributions for the proper motion that can be used to infer the expected lens-source separation for each microlensing event.
There are several Galactic models designed for such a Bayesian approach in microlensing analysis (see e.g. Robin et al. (2003); Han & Gould (2003); Dominik (2006); Yang et al. (2021)). A massive data analysis like the one we have to do for 7801 microlensing events requires a fast, easy and reliable code that can be easily scripted. We have adopted the software genulens888https://github.com/nkoshimoto/genulens (Koshimoto & Ranc 2022), based on the model by Koshimoto et al. (2021), which incorporates stellar density and kinematic information from Gaia (Gaia Collaboration et al. 2018), OGLE (Nataf et al. 2013; Mróz et al. 2019) and radial velocity surveys (Clarke et al. 2019; Kunder et al. 2012) for a better characterization of the bulge.
For each microlensing event, we provide genulens with all available information that affects the proper motion distribution. Firstly, the Galactic coordinates determine the line of sight and the stellar populations potentially contributing as sources or lenses. The Einstein time and the microlensing parallax , when available provide basic constraints on the velocities, mass and distance of the lens through Eqs. (1-3). The baseline magnitude places an upper limit to the mass for both the source and the lens (if it is a star). In order to exploit this information, we must also estimate the extinction in the I-band. Since we cannot construct a CMD for all microlensing events, we rely on existing extinction maps. In particular, we have chosen the OGLE extinction map archive999https://ogle.astrouw.edu.pl/cgi-ogle/getext.py (Nataf et al. 2013), which represents a standard for bulge observations.
4.3 Lens detection probabilities in historic events
In the end, for each microlensing event, we get the distribution of the heliocentric proper motions compatible with the characteristics of our event. The posterior distribution for the heliocentric proper motion can be immediately translated to a distribution in the expected lens-source separation after multiplying the proper motion by the time baseline between the microlensing peak epoch and the EGBS time . At this point, we are in the position to estimate the probability that the lens-source separation exceeds our desired threshold. A few representative examples are shown in Fig. 11. We note that the distributions in the predicted separation are relatively broad in all cases. This reflects the shape of the distribution in which always remains with a width . Without a measurement of the Einstein angle , the constraints from and (when available) are useful to set the order of magnitude of , but are unable to fix its value with a precision better than . The width of the distribution is then determined by the Galactic model, which contains the information about the physical ranges for lens and source velocities and distributions in mass and distance.
| Event | P(¿180) | P(¿140) | P(¿100) | P(¿50) | P(¿25) | Model | |||||
|---|---|---|---|---|---|---|---|---|---|---|---|
| MB-08-238 | 74.3 | 92.88 | 99.31 | 99.99 | 100.0 | PS* | NA | 4615.131 | 2.272 | 5.6 | |
| MB-00-003 | 69.83 | 87.71 | 97.14 | 99.91 | 100.0 | PS | NA | 1692.29 | 1.878 | 1.35 | |
| OB-99-20 | 68.0 | 86.39 | 96.64 | 99.88 | 100.0 | PS | 15.2 | 1317.073 | 1.904 | 8.52 | |
| MB-00-007 | 67.98 | 86.96 | 96.88 | 99.92 | 100.0 | PS | NA | 1725.759 | 1.46 | 1.72 | |
| MB-01-054 | 67.6 | 86.65 | 96.74 | 99.96 | 100.0 | BS | NA | 2219.537 | 1.295 | 4.88 | |
| OB-99-34 | 62.02 | 82.96 | 95.52 | 99.84 | 100.0 | PS | 16.4 | 1369.641 | 2.274 | 3.45 | |
| OB-05-100 | 61.59 | 83.5 | 96.1 | 99.91 | 100.0 | PS | 17.4 | 3453.15 | 2.536 | 2.35 | |
| OB-00-52 | 61.59 | 82.91 | 95.55 | 99.83 | 100.0 | PS | 17.7 | 1752.971 | 1.521 | 2.16 | |
| OB-99-41 | 59.53 | 81.09 | 95.14 | 99.83 | 100.0 | PS | 15.6 | 1397.784 | 1.424 | 2.92 | |
| OB-98-17 | 56.15 | 78.58 | 93.6 | 99.77 | 99.99 | BS | 16.3 | 949.6464 | 1.681 | 2.33 | |
| OB-98-35 | 55.63 | 78.28 | 93.69 | 99.73 | 99.99 | PS | 18.5 | 1059.537 | 2.385 | 2.21 | |
| MB-09-450 | 53.69 | 82.88 | 97.27 | 99.99 | 100.0 | PS | NA | 5064.017 | 1.458 | 2.62 | |
| MB-01-042 | 53.68 | 77.54 | 93.96 | 99.77 | 100.0 | PS | NA | 2159.675 | 1.766 | 3.53 | |
| OB-98-18 | 52.58 | 75.41 | 92.37 | 99.68 | 99.99 | PS | 15.4 | 970.7382 | 1.378 | 1.32 | |
| OB-02-070 | 52.5 | 76.71 | 93.11 | 99.72 | 99.99 | BS | 15.8 | 2387.621 | 3.318 | 2.14 | |
| OB-02-328 | 52.32 | 76.76 | 93.52 | 99.74 | 99.99 | PS | 17.2 | 2517.619 | 2.899 | 1.84 | |
| MB-02-002 | 51.38 | 76.14 | 93.19 | 99.72 | 99.99 | PS | NA | 2343.708 | 1.789 | 1.64 | |
| OB-98-20 | 51.19 | 74.0 | 90.99 | 99.47 | 99.99 | PS | 16.8 | 967.2214 | 3.039 | 1.3 | |
| OB-02-354/OB-02-361 | 50.4 | 75.92 | 93.33 | 99.76 | 99.99 | PS | 16.4 | 2544.73 | 2.331 | 6.93 | |
| OB-06-146 | 50.29 | 77.39 | 94.48 | 99.9 | 100.0 | PS | 17.3 | 3837.851 | 1.823 | 1.61 |
Table 2 contains an excerpt of 20 events from the full list of 7801 historic microlensing events available at https://github.com/euclid-egbs/HistoricList. For each event we report the modeling parameters together with the probabilities that the lens-source separation exceeds five reference thresholds: 0.18”, corresponding to the diffraction limit on the red side of the VIS band; 0.14”, corresponding to the average FWHM of the PSF for the VIS instrument; 0.10”, the pixel angular scale in VIS; 0.050”, half-pixel scale; and 0.025”, a quarter pixel scale. The real threshold for a successful detection of the lens as a separate object from the source depends on the relative flux ratio, the total flux, the color difference between source and lens, the crowding, the presence of the target on multiple dithers. For this reason, we have provided different thresholds that may apply to different cases.
Some particular attention is deserved by the flux ratio between the lens and the source. It is well known that the ability to resolve and determine the separation degrades as the flux ratio becomes very unbalanced between the two objects. A guide formula for the achievable signal-to-noise was proposed by Bennett et al. (2007) and broadly used in the community. In principle, we may use the blending factor retrieved by our models and try to implement a detection threshold based on this formula. However, the EGBS was taken in the VIS instrument in a wide band, which has no direct correspondence with the historic survey bands. In order to transform the blendings in the surveys to the VIS filter a detailed color information on the lens and the source would be needed, but this is available only very sparsely. As anticipated in Sections 3 and 4.1 we only use one band per survey. For these reasons, for each event we only provide the separation probability, which is the fundamental but not unique ingredient to achieve detection.

Some interesting overall statistics can be drawn from this table. Fig. 12 shows the number of events with separation probability higher than the value in the abscissa assuming one of the five reference threshold. All curves start from 7801, since all events have a probability higher than 0%, and terminate to zero at 100%. For example, we can see that the number of events with probability higher than 50% of having lens and source separated by more than 0.025” is 5680. In other words, we expect 73% of all microlensing events to be separated by more than 1/4 pixel. Similarly, 48% of all events have a higher than 50% probability of being separated by more than 0.050”, and still 13% of events should be separated by more than 0.10”, corresponding to one full pixel. Such values remind us that a generic historic microlensing event will still have lens and source unresolved in Euclid. This also enforces the need of identifying the most promising microlensing events which should be considered in the first place in our analysis. Table 2 is sorted by decreasing resolution probability, with the most promising candidates on top of the list. Indeed, the top lines are dominated by short events that have been observed more than 20 years ago. If these events are due to stellar lenses, they should be very likely resolved in EGBS. A non-detection of the lens in such short events would impose severe limits on the mass of a stellar candidate. For example, for MOA-2000-BLG-003, imposing , stellar lenses are limited below 0.3 and confined in the bulge. Taken individually, this is not yet a conclusive evidence that this lens is a free-floating planet or a fast dark remnant, but placed in a statistical context it would greatly contribute to support the existence of a free-floating planet population (Sumi et al. 2011; Mróz et al. 2017b; Koshimoto et al. 2023).


The prediction for the lens-source separation basically depends on the time of the peak and the Einstein time . Older and shorter events should have the largest separation. We can easily visualize this fact in Fig. 13, where the bottom-left corner enjoys the highest probabilities for separations above one Euclid pixel.
Fig. 14 shows the distribution of the events with probability higher than 50% for each reference threshold per year of detection. We see that higher thresholds are only accessible to older events, while lower thresholds still allow some more recent events to pass the selection.
Our results have some sensitivity to the specific choice of the Galactic model. We have adopted the default parametrization in genulens, which uses the form designed as for the Galactic bulge as described by Koshimoto et al. (2021). We can compare our results with other parametrizations available in this software, such as form for the bulge genulens. We find that the differences in the detection probabilities stay well below in the majority of events. Only for shorter events (), we observe a systematic increase in the detection probability with a median of with the alternative bulge form. Similarly, we have also modified the low-mass regime of the Initial Mass Function, pushing the lower cut-off down to . In this case, we only see a deviation for . For such short events, the detection probabilities decrease by . Indeed, lower mass objects justify shorter times without the need of high proper motions. So, this trend can also be expected. We conclude that systematic uncertainties due to our limited knowledge of the Galaxy are of the order of a few percents, while the sensitivity of the predictions for short events to the low-mass end of the Initial Mass Function reiterates the importance of their investigation for a deep comprehension of the population of substellar objects and the unique opportunity offered by the EGBS.
5 Known microlensing planets
| Event | (arcseconds) | Method | Reference |
|---|---|---|---|
| OB050390 | FS | Beaulieu et al. (2006) | |
| MB140547-OB141760 | HR | Rektsini et al. (2025) | |
| MB130260-OB130341_M1 | PX | Gould et al. (2014) | |
| KB160212_M2 | FS | Hwang et al. (2018a) | |
| KB160212_M3 | FS | ||
| KB160212_M4 | FS | ||
| KB160212_M1 | FS | ||
| OB151771_M3 | FS | Zhang et al. (2020) | |
| OB151771_M2 | FS | ||
| OB151771_M1 | FS | ||
| KB160372-OB161195-MB160350_M1 | HR | Vandorou et al. (2025b) | |
| KB160372-OB161195-MB160350_M2 | HR | ||
| MB12323-OB120724_M1 | FS | Hirao et al. (2016) | |
| OB060109 | FS-PX | Bennett et al. (2010) | |
| KB161820 | FS-PX | Jung et al. (2018) | |
| MB140175-OB140676 | PX | Rattenbury et al. (2017) | |
| KB162142 | FS-PX | Jung et al. (2018) | |
| MB130618-OB131721 | FS | Mróz et al. (2017a) | |
| KB170016-OB171392-OB171434-MB170425 | PX | Udalski et al. (2018) | |
| MB11293 | HR | Yee et al. (2012) | |
| KB150186-OB151670-OB151673-MB150379 | FS | Ranc et al. (2019) |
The list of historic microlensing events also contains 51 published planetary events, which surely attract the greatest attention. In fact, the perspective of resolving the lens from the source for such events allows for a much more accurate mass estimate for the planet and the properties of the planetary system, including a more detailed view on the host star.
Known planetary events have already been investigated in detail and the results are publicly available in the respective papers. In particular, accurate models have been proposed taking into account follow-up data, re-reduced photometry and information from CMDs, which allow to exploit the measure of the finite-source effect and fix the angular Einstein angle. In some cases, with a good measure of both the finite-source effect and the microlensing parallax, it has been possible to derive the relative heliocentric proper motion between lens and source. Then, it has been sufficient to multiply by the time baseline to obtain predictions for the expected separation between lens and source. These values are reported in Table 3. When one of these effects is not measured, some Bayesian analysis is eventually needed to infer the properties of the microlensing event, including the proper motion. We have consequently flagged these events in our table. When more than one model fits the data, we have reported the corresponding expectations.

As can be seen from Fig. 15, all the expected separations reported in this table are in good agreement with the predictions made by our general re-modeling of the original survey data, which makes us more confident with respect to our modeling. Consistently with our full sample of microlensing events, there are just 4 planetary events for which the lens should be separated by more than 0.1”, 18 events with a separation higher than 0.05” and 30 events with separation higher than 0.025”.
The four planetary events for which a separation higher than one pixel is predicted are OGLE-2005-BLG-390 (Beaulieu et al. 2006), MOA-2014-BLG-547/OGLE-2014-BLG-1760 (Rektsini et al. 2025), MOA-2013-BLG-260/OGLE-2013-BLG-0341 (Gould et al. 2014) and KMT-2016-BLG-0212 (Hwang et al. 2018a). The first is a twenty-year-old event, for which a high separation is quite expected. Unfortunately, the lens star should be a faint M-dwarf, while the source is a giant. A high contrast of about 10 magnitudes in this case makes the detection of the faint lens very challenging. The second event has been recently resolved by Keck adaptive optics: in this case the Euclid image may be useful to confirm the lens detection. For the third event the lens system is relatively close and a high proper motion is derived in the models. Since the source is relatively faint and the lens is made of a binary system of M-dwarfs, this event seems more promising for a successful detection. The fourth event in the list comes with four possible models in which the lens has mass between 0.36 and 0.45 and the companion could be a brown dwarf or a sub-Neptune depending on the chosen alternative. The different models predict different proper motions and different magnitudes for source and lens. Therefore, a resolution by Euclid should be able to distinguish these alternatives.
6 Conclusions
Decades of microlensing observations towards the bulge have accumulated tens of thousand microlensing events. Thanks to the Euclid Galactic Bulge Survey, we have the opportunity to resolve the lens from the source for a substantial fraction of all past microlensing events, bringing the contribution to the knowledge of the Galaxy from microlensing to a higher level.
In this investigation we have compiled the full list of historic events in the footprint of the EGBS. By re-modeling all events in a homogeneous way, we have revised the estimates for the basic microlensing parameters and we have issued predictions for the expected separation of lens and source for 7801 microlensing events. In our catalog, astronomers can find all events with their coordinates, baseline magnitude, Einstein time and parallax (if measurable), along with an assessment of the possible category (single lens, binary lens or binary source). The reported chi square in the fit is also useful to discard events based on possible problems with systematics or poor modeling. For each event, we report the probability that the lens is separated from the source by more than one pixel, half pixel, a quarter pixel, or the size of the average PSF. It is clear that the individual cases may feature peculiarities that are not represented in our table and that may pose additional difficulties, such as high contrast between lens and source, a dark lens, additional blended stars, nearby saturated stars. All these can be evaluated and understood only when the real data are examined. However, our list represents the starting point and the reference for driving all future detailed analyses of individual microlensing events toward the most promising cases.
We note there is currently an ongoing large HST survey of the Roman GBTDS fields (GO-17776; (Terry et al. 2026a)). Much like the EGBS, a primary goal of this HST precursor survey is to extend the time baseline for which Roman lenses and sources can be studied with high-resolution imaging. Joint analysis of the EGBS and HST precursor data will allow for robust multi-passband characterization of the lenses in this historical event sample.
Finally, the Roman Galactic Time Domain Survey (ROTAC 2025) will be extremely useful to prolong the follow-up of historic events and confirm the conclusions of the analyses based on EGBS alone. At the present time, therefore, we are right in the middle of the path to the construction of a broad database of lens-source pairs that can be envisaged as an alternative way to obtain a 3D tomography along our line of sight to the Galactic bulge.
Acknowledgements.
The OGLE project has received funding from the Polish National Science Centre grant OPUS-28 2024/55/B/ST9/00447 to AU. The MOA project is supported by JSPS KAKENHI Grant Number JP16H06287, JP22H00153, JP23KK0060 and JP25H00668. This research has made use of publicly available data (https://kmtnet.kasi.re.kr/ulens/) from the KMTNet system operated by the Korea Astronomy and Space Science Institute (KASI) at three host sites of CTIO in Chile, SAAO in South Africa, and SSO in Australia. Data transfer from the host site to KASI was supported by the Korea Research Environment Open NETwork (KREONET). VB acknowledges financial support from PRIN2022 CUP D53D23002590006. This work was supported by the University of Tasmania through the endowed Warren Chair in Astronomy. AAC, J-PB, and ET NR have been supported by the Australian Government through the Australian Research Council Discovery Project Grants 200101909 and 240101842. Research in France has been supported through the SPACE-MLENS ANR grant ANR-24-CE31-3263.References
- Afonso et al. (2003) Afonso, C., Albert, J. N., Alard, C., et al. 2003, A&A, 404, 145
- Alcock et al. (1993) Alcock, C., Akerlof, C. W., Allsman, R. A., et al. 1993, Nature, 365, 621
- Alcock et al. (2000a) Alcock, C., Allsman, R. A., Alves, D. R., et al. 2000a, ApJ, 542, 281
- Alcock et al. (2000b) Alcock, C., Allsman, R. A., Alves, D. R., et al. 2000b, ApJ, 541, 734
- Bachelet & Penny (2019) Bachelet, E. & Penny, M. 2019, ApJ, 880, L32
- Bachelet et al. (2022) Bachelet, E., Specht, D., Penny, M., et al. 2022, A&A, 664, A136
- Batista et al. (2014) Batista, V., Beaulieu, J. P., Gould, A., et al. 2014, ApJ, 780, 54
- Beaulieu et al. (2026) Beaulieu, J., Bachelet, E., Gilles, M., et al. 2026, in preparation
- Beaulieu (2018) Beaulieu, J.-P. 2018, Universe, 4, 61
- Beaulieu et al. (2006) Beaulieu, J. P., Bennett, D. P., Fouqué, P., et al. 2006, Nature, 439, 437
- Bennett et al. (2006) Bennett, D. P., Anderson, J., Bond, I. A., Udalski, A., & Gould, A. 2006, ApJ, 647, L171
- Bennett et al. (2007) Bennett, D. P., Anderson, J., & Gaudi, B. S. 2007, ApJ, 660, 781
- Bennett et al. (2015) Bennett, D. P., Bhattacharya, A., Anderson, J., et al. 2015, ApJ, 808, 169
- Bennett et al. (2020) Bennett, D. P., Bhattacharya, A., Beaulieu, J.-P., et al. 2020, AJ, 159, 68
- Bennett et al. (2024) Bennett, D. P., Bhattacharya, A., Beaulieu, J.-P., et al. 2024, AJ, 168, 15
- Bennett et al. (2010) Bennett, D. P., Rhie, S. H., Nikolaev, S., et al. 2010, ApJ, 713, 837
- Bennett et al. (2016) Bennett, D. P., Rhie, S. H., Udalski, A., et al. 2016, AJ, 152, 125
- Bhattacharya et al. (2019) Bhattacharya, A., Akeson, R., Anderson, J., et al. 2019, BAAS, 51, 520
- Bhattacharya et al. (2018) Bhattacharya, A., Beaulieu, J. P., Bennett, D. P., et al. 2018, AJ, 156, 289
- Bhattacharya et al. (2023) Bhattacharya, A., Bennett, D. P., Beaulieu, J. P., et al. 2023, AJ, 165, 206
- Blackman et al. (2021) Blackman, J. W., Beaulieu, J. P., Cole, A. A., et al. 2021, AJ, 161, 279
- Bond et al. (2001) Bond, I. A., Abe, F., Dodd, R. J., et al. 2001, MNRAS, 327, 868
- Bond et al. (2017) Bond, I. A., Bennett, D. P., Sumi, T., et al. 2017, MNRAS, 469, 2434
- Bond et al. (2004) Bond, I. A., Udalski, A., Jaroszyński, M., et al. 2004, ApJ, 606, L155
- Bozza (2024) Bozza, V. 2024, A&A, 688, A83
- Bozza et al. (2025) Bozza, V., Saggese, V., Covone, G., Rota, P., & Zhang, J. 2025, A&A, 694, A219
- Clarke et al. (2019) Clarke, J. P., Wegg, C., Gerhard, O., et al. 2019, MNRAS, 489, 3519
- Cropper et al. (2016) Cropper, M., Pottinger, S., Niemi, S., et al. 2016, in Society of Photo-Optical Instrumentation Engineers (SPIE) Conference Series, Vol. 9904, Space Telescopes and Instrumentation 2016: Optical, Infrared, and Millimeter Wave, ed. H. A. MacEwen, G. G. Fazio, M. Lystrup, N. Batalha, N. Siegler, & E. C. Tong, 99040Q
- Dominik (2006) Dominik, M. 2006, MNRAS, 367, 669
- Gaia Collaboration et al. (2018) Gaia Collaboration, Katz, D., Antoja, T., et al. 2018, A&A, 616, A11
- Gaudi (2012) Gaudi, B. S. 2012, ARA&A, 50, 411
- Gaudi et al. (2008) Gaudi, B. S., Bennett, D. P., Udalski, A., et al. 2008, Science, 319, 927
- Gould (1992) Gould, A. 1992, ApJ, 392, 442
- Gould et al. (2014) Gould, A., Udalski, A., Shin, I. G., et al. 2014, Science, 345, 46
- Han et al. (2019) Han, C., Bennett, D. P., Udalski, A., et al. 2019, AJ, 158, 114
- Han & Gould (2003) Han, C. & Gould, A. 2003, ApJ, 592, 172
- Hirao et al. (2020) Hirao, Y., Bennett, D. P., Ryu, Y.-H., et al. 2020, AJ, 160, 74
- Hirao et al. (2016) Hirao, Y., Udalski, A., Sumi, T., et al. 2016, ApJ, 824, 139
- Hwang et al. (2018a) Hwang, K. H., Kim, H. W., Kim, D. J., et al. 2018a, Journal of Korean Astronomical Society, 51, 197
- Hwang et al. (2018b) Hwang, K. H., Udalski, A., Shvartzvald, Y., et al. 2018b, AJ, 155, 20
- Jung et al. (2019) Jung, Y. K., Gould, A., Udalski, A., et al. 2019, AJ, 158, 28
- Jung et al. (2018) Jung, Y. K., Hwang, K.-H., Ryu, Y.-H., et al. 2018, AJ, 156, 208
- Kim et al. (2021) Kim, H.-W., Hwang, K.-H., Gould, A., et al. 2021, AJ, 162, 15
- Kim et al. (2016) Kim, S.-L., Lee, C.-U., Park, B.-G., et al. 2016, Journal of Korean Astronomical Society, 49, 37
- Koshimoto et al. (2021) Koshimoto, N., Baba, J., & Bennett, D. P. 2021, ApJ, 917, 78
- Koshimoto & Ranc (2022) Koshimoto, N. & Ranc, C. 2022, nkoshimoto/genulens: Release version 1.2
- Koshimoto et al. (2023) Koshimoto, N., Sumi, T., Bennett, D. P., et al. 2023, AJ, 166, 107
- Kunder et al. (2012) Kunder, A., Koch, A., Rich, R. M., et al. 2012, AJ, 143, 57
- Lam et al. (2022) Lam, C. Y., Lu, J. R., Udalski, A., et al. 2022, ApJ, 933, L23
- Mao & Paczynski (1991) Mao, S. & Paczynski, B. 1991, ApJ, 374, L37
- Mellier et al. (2025) Mellier, Y., Abdurro’uf, Acevedo Barroso, J. A., et al. 2025, A&A, 697, A1
- Mroz & Poleski (2023) Mroz, P. & Poleski, R. 2023, arXiv e-prints, arXiv:2310.07502
- Mróz et al. (2017a) Mróz, P., Udalski, A., Bond, I. A., et al. 2017a, AJ, 154, 205
- Mróz et al. (2017b) Mróz, P., Udalski, A., Skowron, J., et al. 2017b, Nature, 548, 183
- Mróz et al. (2019) Mróz, P., Udalski, A., Skowron, J., et al. 2019, ApJS, 244, 29
- Mróz et al. (2024a) Mróz, P., Udalski, A., Szymański, M. K., et al. 2024a, ApJ, 976, L19
- Mróz et al. (2024b) Mróz, P., Udalski, A., Szymański, M. K., et al. 2024b, Nature, 632, 749
- Nataf et al. (2013) Nataf, D. M., Gould, A., Fouqué, P., et al. 2013, ApJ, 769, 88
- Niikura et al. (2019) Niikura, H., Takada, M., Yasuda, N., et al. 2019, Nature Astronomy, 3, 524
- Nunota et al. (2025) Nunota, K., Sumi, T., Koshimoto, N., et al. 2025, ApJ, 979, 123
- Paczynski (1986) Paczynski, B. 1986, ApJ, 304, 1
- Penny et al. (2013) Penny, M. T., Kerins, E., Rattenbury, N., et al. 2013, MNRAS, 434, 2
- Racca et al. (2016) Racca, G. D., Laureijs, R., Stagnaro, L., et al. 2016, in Society of Photo-Optical Instrumentation Engineers (SPIE) Conference Series, Vol. 9904, Space Telescopes and Instrumentation 2016: Optical, Infrared, and Millimeter Wave, ed. H. A. MacEwen, G. G. Fazio, M. Lystrup, N. Batalha, N. Siegler, & E. C. Tong, 99040O
- Ranc et al. (2019) Ranc, C., Bennett, D. P., Hirao, Y., et al. 2019, AJ, 157, 232
- Rattenbury et al. (2017) Rattenbury, N. J., Bennett, D. P., Sumi, T., et al. 2017, MNRAS, 466, 2710
- Refsdal (1966) Refsdal, S. 1966, MNRAS, 134, 315
- Rektsini et al. (2025) Rektsini, N. E., Ranc, C., Koshimoto, N., et al. 2025, AJ, 170, 190
- Robin et al. (2003) Robin, A. C., Reylé, C., Derrière, S., & Picaud, S. 2003, A&A, 409, 523
- ROTAC (2025) ROTAC. 2025, arXiv e-prints, arXiv:2505.10574
- Sahu et al. (2022) Sahu, K. C., Anderson, J., Casertano, S., et al. 2022, ApJ, 933, 83
- Shvartzvald et al. (2017) Shvartzvald, Y., Yee, J. C., Calchi Novati, S., et al. 2017, ApJ, 840, L3
- Street et al. (2016) Street, R. A., Udalski, A., Calchi Novati, S., et al. 2016, ApJ, 819, 93
- Sumi et al. (2003) Sumi, T., Abe, F., Bond, I. A., et al. 2003, ApJ, 591, 204
- Sumi et al. (2013) Sumi, T., Bennett, D. P., Bond, I. A., et al. 2013, ApJ, 778, 150
- Sumi et al. (2011) Sumi, T., Kamiya, K., Bennett, D. P., et al. 2011, Nature, 473, 349
- Sumi et al. (2023) Sumi, T., Koshimoto, N., Bennett, D. P., et al. 2023, AJ, 166, 108
- Terry et al. (2026a) Terry, S. K., Anderson, J., Beichman, C. A., et al. 2026a, ApJ, 1003, L1
- Terry et al. (2026b) Terry, S. K., Bachelet, E., Zohrabi, F., et al. 2026b, AJ, 171, 212
- Terry et al. (2024) Terry, S. K., Beaulieu, J.-P., Bennett, D. P., et al. 2024, AJ, 168, 72
- Tisserand et al. (2007) Tisserand, P., Le Guillou, L., Afonso, C., et al. 2007, A&A, 469, 387
- Tsapras (2018) Tsapras, Y. 2018, Geosciences, 8, 365
- Udalski et al. (2018) Udalski, A., Ryu, Y. H., Sajadian, S., et al. 2018, Acta Astron., 68, 1
- Udalski et al. (1993) Udalski, A., Szymanski, M., Kaluzny, J., et al. 1993, Acta Astron., 43, 289
- Udalski et al. (1992) Udalski, A., Szymanski, M., Kaluzny, J., Kubiak, M., & Mateo, M. 1992, Acta Astron., 42, 253
- Udalski et al. (1994a) Udalski, A., Szymanski, M., Kaluzny, J., et al. 1994a, Acta Astron., 44, 227
- Udalski et al. (1994b) Udalski, A., Szymanski, M., Stanek, K. Z., et al. 1994b, Acta Astron., 44, 165
- Udalski et al. (2015) Udalski, A., Szymański, M. K., & Szymański, G. 2015, Acta Astron., 65, 1
- Vandorou et al. (2020) Vandorou, A., Bennett, D. P., Beaulieu, J.-P., et al. 2020, AJ, 160, 121
- Vandorou et al. (2025a) Vandorou, A., Bennett, D. P., Beaulieu, J.-P., et al. 2025a, arXiv e-prints, arXiv:2504.06347
- Vandorou et al. (2025b) Vandorou, A., Dang, L., Bennett, D. P., et al. 2025b, AJ, 169, 319
- Witt & Mao (1994) Witt, H. J. & Mao, S. 1994, ApJ, 430, 505
- Wyrzykowski et al. (2015) Wyrzykowski, Ł., Rynkiewicz, A. E., Skowron, J., et al. 2015, ApJS, 216, 12
- Wyrzykowski et al. (2011) Wyrzykowski, L., Skowron, J., Kozłowski, S., et al. 2011, MNRAS, 416, 2949
- Yang et al. (2021) Yang, H., Mao, S., Zang, W., & Zhang, X. 2021, MNRAS, 502, 5631
- Yee et al. (2012) Yee, J. C., Shvartzvald, Y., Gal-Yam, A., et al. 2012, ApJ, 755, 102
- Zhang et al. (2020) Zhang, X., Zang, W., Udalski, A., et al. 2020, AJ, 159, 116