FullFront: Benchmarking MLLMs Across the Full Front-End Engineering Workflow
Abstract
Front-end engineering involves a complex workflow where engineers conceptualize designs, translate them into code, and iteratively refine the implementation. While recent benchmarks focus on converting visual designs to code, we present FullFront, a benchmark to evaluate Multimodal Large Language Models across the full front-end development pipeline. FullFront assesses three fundamental tasks that map directly to the front-end engineering pipeline: Webpage Design (conceptualization), Webpage Perception QA (comprehension of visual organization and elements), and Webpage Code Generation (implementation). Unlike existing benchmarks relying on scraped websites with bloated code or oversimplified LLM-generated HTML, FullFront employs a novel, two-stage process to transform real-world webpages into clean, standardized HTML while maintaining diverse visual designs and avoiding copyright issues. Extensive testing of state-of-the-art MLLMs reveals significant limitations in page perception, code generation (particularly for image handling and layout), and interaction implementation. Our results quantify performance disparities across models and tasks, highlighting a substantial gap between current MLLM capabilities and human expert performance in front-end engineering.

1 Introduction
Front-end engineering, a cornerstone of the modern digital experience, is an intricate process, as depicted in Figure 1. It transforms abstract concepts into initial designs (conceptualization), involves detailed visual comprehension (perception), and culminates in functional, interactive code (implementation) for web applications. This field is poised for significant transformation with the advent of Multimodal Large Language Models (MLLMs), whose capabilities in processing visual information and generating code offer compelling potential to streamline and even automate the front-end development, aligning with the aspirational goal of an “idea-to-design-to-code” paradigm.
Despite this burgeoning potential, a benchmark assessing MLLMs across the full front-end engineering workflow is conspicuously absent. Instead, current evaluations separately address crucial yet distinct capabilities: vision perception and code generation. For instance, benchmarks like IW-Bench (Guo et al., 2025) and WebCode2M (Gui et al., 2025) scrutinize MLLMs’ code generation from visual inputs but often have narrow task scopes, overlooking vital aspects such as implementing interactive features or refining existing codebases. Conversely, while WebQuest (Wang et al., 2024) and Webqa (Chang et al., 2022) investigate MLLMs’ visual understanding of webpages, the focus remains on content-level reasoning, neglecting fine-grained perceptual acuity concerning element size, positioning, and layout, which is indispensable for accurate front-end implementation. Most critically, these fragmented approaches generally omit the initial conceptual “design” phase, and therefore fall short of gauging MLLM proficiency in end-to-end front-end engineering.
In this work, we introduce FullFront, a benchmark meticulously designed to evaluate MLLMs across the full front-end engineering workflow. As depicted in Figure 2, FullFront distinctively offers a holistic assessment through three core tasks: (1) Webpage Design (200 problems), which assesses the model’s ability to structure and organize visual elements to present some given content; (2) Webpage Perception QA (three subtasks and 1,800 multiple-choice questions), which evaluates the perception of visual organization, element characteristics, and spatial relationships within a webpage; and (3) Webpage Code Generation (four subtasks and 700 code generation problems), which focuses on the accurate translation of visual designs into functional code, including interaction implementation and code refinement. We collect real-world webpages and develop an MLLM-driven pipeline to reconstruct them into clean, standardized, and copyright-free HTML, ensuring high controllability while preserving original visual diversity for robust benchmark data. This comprehensive task structure and our evaluation framework, incorporating fine-grained visual similarity scores and detailed code-level metrics (including structural and content-based comparisons), provide a multifaceted and robust assessment of model capabilities across the full front-end engineering workflow.
Benchmarking state-of-the-art open-source and proprietary MLLMs with FullFront reveals significant challenges across the board. In the Webpage Design task, current text-to-image MLLMs demonstrate an ability to produce general layout concepts but lack the precision for high-fidelity webpage designs that accurately reflect detailed textual descriptions. In Webpage Perception QA, even leading models struggle to achieve human-comparable accuracy; for instance, the best-performing model, GPT-5, averages below 60% across the three full-set QA tasks. On the separate FullFront-mini subset, human experts achieve 97%, 96%, and 94% accuracy on Real-world, Synthetic, and Multi-window QA, respectively. Our analysis reveals that MLLMs face considerable difficulties in accurately perceiving element alignment, size, and positioning within webpages. For Webpage Code Generation, while proprietary models like Claude 3.7 Sonnet and GPT-4.1 generally outperform open-source alternatives, they still encounter difficulties, particularly in accurately handling complex front-end details such as image manipulation, layout fidelity, and interaction implementation. These findings underscore the critical need to enhance current MLLM capabilities within the front-end development workflow to bridge the substantial gap between their current performance and the requirements for expert-level engineering. In summary, our main contributions are as follows:
- •
Comprehensive Full Front-End Workflow Benchmark: We propose FullFront, a benchmark that unifies Webpage Design (conceptualization), Perception QA (comprehension), and Code Generation (implementation) into a cohesive pipeline. This framework simulates the engineering lifecycle to evaluate current MLLMs and future Generalist Front-End Agents.
- •
Robust and Bias-Resilient Evaluation: We introduce fine-grained visual- and code-level metrics rigorously validated against human judgment. Extensive ablation studies confirm our framework’s robustness against data-pipeline artifacts and model-as-judge biases, establishing a standard for cross-model comparison.
- •
In-depth Analysis of Perception-Generation Decoupling: Beyond performance rankings, our evaluation uncovers a critical “Perception-Implementation Gap.” We reveal that top-tier MLLMs often exhibit “Grounding Failures”—relying on strong internal priors to generate correct code despite flawed perception. This insight challenges the assumption that code generation implies visual understanding, a nuance missed by isolated benchmarks.

2 Related Work
Applications of MLLMs in Web
MLLMs have recently attracted growing attention in web applications (Zhao et al., 2025; Wu et al., 2024; Wang et al., 2025). Recent studies enable MLLMs to navigate and manipulate websites according to user instructions (Zheng et al., 2024; Cheng et al., 2024). For example, Mind2Web (Deng et al., 2023) trains generalist web agents on diverse web tasks, demonstrating their ability to follow complex natural language commands across websites. WinClick (Hui et al., 2025) further studies GUI grounding, enabling more precise interaction with web elements by modeling their visual and textual properties. These efforts reflect a broader trend toward autonomous web interaction agents.
Webpage Benchmarks and Datasets
Several benchmarks evaluate MLLMs on webpage-related tasks. A large body of work (Wang et al., 2024; Chang et al., 2022; Wu et al., 2025) uses real-world webpages to assess element grounding and content reasoning through QA. ScreenWords (Wang et al., 2021) studies screen summarization, while VisualWebBench (Liu et al., 2024) provides seven QA tasks for broader webpage understanding. Another line of work evaluates front-end code generation from screenshots. Design2Code (Si et al., 2024), WebCode2M (Gui et al., 2025), and IW-Bench (Guo et al., 2025) construct datasets by scraping and simplifying existing code, whereas Web2Code (Yun et al., 2024), WebSight (Laurençon et al., 2024), and Pix2Code (Beltramelli, 2018) rely on generated code or synthetic UIs. Other studies extend this direction with external-resource lists (Wan et al., 2024), dynamic webpage generation (Xiao et al., 2024), and multi-framework iterative editing and repair (Xiao et al., 2025).

3 Benchmark
3.1 Data Curation
Webpage Design
The Webpage Design task aims to evaluate text-to-image generation MLLMs as webpage designers. We provide 200 textual descriptions of synthetic webpages sampled from the Text to Code task dataset (see below). MLLMs are required to generate webpage design images based on these descriptions. This process tests how effectively models can transform textual requirements into visual designs, including their understanding of webpage layouts and element relationships. Since textual descriptions naturally cannot capture all visual design nuances, this task also assesses models’ ability to make reasonable design decisions where specifications are incomplete.
Webpage Perception QA
This task assesses MLLMs’ perception of webpage elements, including their position, style, spatial relationships, and overall page layout, through three subtasks. The Real-world QA subtask evaluates perceptual abilities using 625 real webpage screenshots (270 manually collected, 355 from Uground (Gou et al., 2024) and IW-Bench (Guo et al., 2025)), resulting in 1,250 question-answer pairs. Complementing this, Synthetic QA assesses model performance on 400 Q/A pairs derived from 200 synthesized webpage screenshots generated via the specific methodology (detailed in the next Webpage Code Generation). Finally, Multi-window QA elevates task complexity by presenting 75 samples, each combining 2-4 screenshots from the Real-world QA set (totaling 150 Q/A pairs), challenging models to accurately identify and locate the screenshot relevant to the posed question. Questions are primarily generated by GPT-4o (OpenAI, 2024), augmented with bounding boxes and OCR data extracted by OmniParser (Lu et al., 2024). This allows GPT-4o to focus on generating challenging, high-quality multiple-choice questions based on page content and structure rather than low-level perception. All generated questions undergo rigorous manual review and modification to ensure correctness, challenge, and task validity. To mitigate ethical risks such as privacy leakage, all webpage screenshots are manually inspected and annotated to remove personal data and harmful content.
Webpage Code Generation
The Webpage Code Generation task evaluates the ability to translate visual page designs into executable HTML. Existing benchmarks (e.g., WebCode2M (Gui et al., 2025), Design2Code (Si et al., 2024)) often simplify HTML from sources like Common Crawl (Crawl, 2025) to mitigate ethical issues, remove external dependencies and redundant elements, and standardize code for comparison. Despite these benefits, simplification is inherently time-consuming and difficult to generalize across varied real-world webpages. Meanwhile, HTML generated with LLMs from scratch (e.g., WebSight (Laurençon et al., 2024)) often lacks authentic complexity. Moreover, a key limitation of existing datasets is their handling of images, such as using generic placeholders or random images, hindering the assessment of nuanced image understanding and utilization crucial for high-fidelity webpage replication. To overcome these issues, we introduce a synthesis pipeline from real-world webpages. This two-stage process (detailed in Figure 2) starts with a real-world webpage screenshot and its OmniParser-extracted element information. GPT-4o generates an initial HTML-v1, which Claude 3.7 Sonnet then refines—adjusting styles, positions, alignments, and layouts—into a higher-quality, more complex HTML-v2. This HTML-v2 and its rendered page serve as ground truth. For image handling, we utilize a category-based strategy to preserve the visual information from real-world webpage screenshots (see Appendix E.2). As shown in Figure 3, our method generates webpages that are demonstrably superior to other benchmarks in complexity and diversity. We also demonstrate the robustness of our data construction method against pipeline-induced biases in Appendix G. Unlike traditional tasks that only involve providing a webpage screenshot for HTML code generation, we design four distinct subtasks to evaluate MLLMs’ front-end code generation capabilities under various conditions: Image to Code (200 samples) evaluates direct HTML generation from these HTML-v2 rendered screenshots; Text to Code (200 samples) assesses HTML generation based solely on manually verified textual descriptions of HTML-v2 rendered pages; Interaction Authoring (100 samples) measures the ability to implement dynamic behaviors, requiring MLLMs to reproduce a static page (from HTML-v1 as a base) and add specified interactions based on screenshots depicting the page before and after the interaction; and Code Refinement (200 samples) simulates code optimization by requiring MLLMs to refine provided HTML-v1 code to match the quality and complexity of an HTML-v2 rendered screenshot. For more detailed task descriptions, see the Appendix E.
3.2 Evaluation Metrics
To comprehensively evaluate MLLM performance, we employ visual- and code-level metrics, detailed below and applied specifically to each core task.
Visual-Level Metrics
We evaluate generative quality by comparing model outputs, including rendered HTML pages and direct design images, with ground-truth images. We use two automatic similarity metrics: CLIP Score (Radford et al., 2021) for high-level semantic consistency and DINOv2 Score (Oquab et al., 2024) for finer-grained structural and visual fidelity. In addition, Gemini Visual Score uses Gemini 2.5 Flash to rate outputs on a 0–10 scale across ten fine-grained criteria, including alignment and spacing (Appendix F.1).
Code-Level Metrics
To measure code similarity, we propose the Code Score, which compares MLLM-generated code with reference HTML. It parses both into DOM trees, extracts CSS, and aggregates structural and content-level similarities. Structural similarity is measured by the Longest Common Subsequence (LCS) ratio of DOM tag sequences. Content-level similarity is computed for text, images, and forms by matching elements and comparing their content, key styles, and critical attributes, such as image sources and form types. Each content type is adjusted by its implementation rate, reflecting the proportion of reference elements reproduced. The final Code Score combines these components with predefined weights; details are provided in Appendix F.2. Code Score is therefore a reference-relative fidelity measure rather than a standalone test of semantic correctness; render-level metrics, executable interaction checks, and human evaluation provide complementary evidence.
For Webpage Design, we use visual-level metrics to assess generated designs. For Webpage Perception QA, we report standard multiple-choice accuracy. For Webpage Code Generation, we use both visual-level metrics and Code Score. To validate our evaluation framework, we compare automatic metrics with human preferences using Spearman’s rank correlation. As shown in Appendix F.3 and Appendix H, Code Score () and Gemini Visual Score () show strong alignment with human judgments, supporting their reliability for assessing MLLM performance.
| Model | Gemini Visual Score | CLIP Score | DINOv2 Score | Human Score |
| GPT-4o | 5.0450 | 0.7445 | 0.5598 | 6.9600 |
| gemini-2.0-flash-exp- image-generation | 2.0190 | 0.6901 | 0.4798 | 6.0400 |
| Model | Real-world | Synthetic | Multi-window |
| Qwen2.5-VL-72B-Instruct | 0.4696 | 0.4950 | 0.4267 |
| InternVL2.5-78B | 0.4696 | 0.5050 | 0.4267 |
| InternVL3-78B | 0.4816 | 0.5375 | 0.4600 |
| LLaVA-Onevision-72B | 0.3296 | 0.3275 | 0.2733 |
| Claude 3.7 Sonnet | 0.5464 | 0.5325 | 0.4533 |
| Gemini 2.5 Flash | 0.4800 | 0.4250 | 0.3867 |
| GPT-4o | 0.4448 | 0.4675 | 0.3733 |
| o4-mini | 0.4976 | 0.5300 | 0.4400 |
| GPT-4.1 | 0.4672 | 0.4650 | 0.3733 |
| GPT-5 | 0.5816 | 0.5775 | 0.5467 |
| o1∗ | 0.4350 | 0.4600 | 0.4200 |
| Gemini 2.5 Pro∗ | 0.5200 | 0.5800 | 0.4800 |
| Human Expert∗ | 0.9700 | 0.9600 | 0.9400 |
4 Experiments
4.1 Evaluation Settings
FullFront-mini Dataset To facilitate rapid iterative evaluation of MLLMs, we constructed a FullFront-mini dataset. For specifics on the FullFront-mini setup, see Appendix B.
Models We evaluate twelve state-of-the-art MLLMs across the Webpage Perception QA and Code Generation tasks, covering both open-source and proprietary models. For the Webpage Design task, which targets image-generation MLLMs, we additionally evaluate two representative image-generation models. Detailed model sources and configurations are provided in Appendix F.4.
4.2 Main Results
| Model | Code Score | Gemini Visual Score | CLIP Score | DINOv2 Score | ||||||||||||
| Ref | Img | Inter | Text | Ref | Img | Inter | Text | Ref | Img | Inter | Text | Ref | Img | Inter | Text | |
| Qwen2.5-VL-72B-Instruct | 0.53 | 0.40 | 0.40 | 0.49 | 6.21 | 4.48 | 6.22 | 5.18 | 0.79 | 0.72 | 0.76 | 0.73 | 0.63 | 0.49 | 0.67 | 0.47 |
| InternVL2.5-78B | 0.36 | 0.33 | 0.30 | 0.50 | 5.03 | 4.01 | 3.51 | 5.44 | 0.74 | 0.74 | 0.69 | 0.74 | 0.67 | 0.57 | 0.58 | 0.48 |
| InternVL3-78B | 0.49 | 0.42 | 0.38 | 0.50 | 5.87 | 4.47 | 4.48 | 4.91 | 0.77 | 0.73 | 0.73 | 0.72 | 0.61 | 0.53 | 0.60 | 0.44 |
| LLaVA-Onevision-72B | 0.33 | 0.14 | 0.06 | 0.41 | 4.90 | 1.89 | 0.45 | 5.13 | 0.73 | 0.65 | 0.58 | 0.74 | 0.66 | 0.42 | 0.17 | 0.50 |
| Claude 3.7 Sonnet | 0.63 | 0.64 | 0.55 | 0.64 | 8.36 | 8.93 | 9.18 | 8.14 | 0.88 | 0.89 | 0.86 | 0.87 | 0.80 | 0.81 | 0.82 | 0.78 |
| Gemini 2.5 Flash | 0.70 | 0.63 | 0.52 | 0.59 | 8.65 | 8.64 | 8.07 | 8.01 | 0.89 | 0.88 | 0.81 | 0.87 | 0.83 | 0.80 | 0.79 | 0.79 |
| GPT-4o | 0.43 | 0.34 | 0.36 | 0.49 | 6.53 | 5.91 | 5.81 | 6.14 | 0.82 | 0.81 | 0.76 | 0.74 | 0.73 | 0.69 | 0.69 | 0.52 |
| o4-mini | 0.62 | 0.57 | 0.55 | 0.51 | 8.16 | 8.47 | 8.84 | 6.87 | 0.86 | 0.87 | 0.84 | 0.82 | 0.75 | 0.76 | 0.77 | 0.68 |
| GPT-4.1 | 0.67 | 0.61 | 0.55 | 0.55 | 9.03 | 8.89 | 9.13 | 8.36 | 0.89 | 0.88 | 0.84 | 0.87 | 0.80 | 0.80 | 0.84 | 0.80 |
| GPT-5 | 0.58 | 0.56 | 0.53 | 0.59 | 8.84 | 8.58 | 9.00 | 8.48 | 0.88 | 0.88 | 0.85 | 0.88 | 0.81 | 0.81 | 0.83 | 0.79 |
Webpage Design
On the Webpage Design task, current text-to-image MLLMs exhibit a foundational capability in generating general layout concepts but encounter difficulties in producing high-fidelity designs that accurately reflect detailed textual descriptions. As shown in Table 1, GPT-4o outperforms gemini-2.0-flash-exp-image-generation across all metrics. Furthermore, qualitative examples in Appendix C illustrate that GPT-4o demonstrates superior performance in rendering overall page structure, typography, and element implementation fidelity.
Webpage Perception QA
As demonstrated in Table 2, MLLMs generally exhibit weak perceptual capabilities on the Webpage Perception QA task. On the FullFront-mini subset, even the top-performing model, Gemini 2.5 Pro, achieves an average accuracy barely exceeding 50% across the three subtasks. Furthermore, LLaVA-OneVision-72B’s accuracy remains below 35% on all QA subtasks. Human experts achieve 97%, 96%, and 94% on the three FullFront-mini QA subtasks. Because the full-set model rows and mini-set human row use different evaluation subsets, we do not interpret their point-estimate differences as paired accuracy gaps. Notably, this task reveals no substantial performance disparity between closed-source and open-source models; for instance, on the full FullFront benchmark, the open-source InternVL3-78B is competitive with proprietary models, surpassing Claude 3.7 Sonnet with accuracies of 53.75% on Synthetic QA and 46.00% on Multi-window QA. Further analysis indicates nearly identical model performance on single-page Real-world and Synthetic QA, while performance degrades considerably on the more complex Multi-window QA.
| Model | Ref | Image | Inter | Text |
| Qwen2.5-VL-72B-Instruct | 6.18 | 5.72 | 7.02 | 4.90 |
| InternVL2.5-78B | 5.36 | 4.78 | 5.04 | 4.24 |
| InternVL3-78B | 6.32 | 5.56 | 5.44 | 4.62 |
| LLaVA-Onevision-72B | 5.64 | 2.96 | 0.58 | 4.42 |
| Claude 3.7 Sonnet | 8.00 | 8.48 | 8.80 | 8.10 |
| Gemini 2.5 Flash | 8.44 | 8.40 | 7.86 | 8.24 |
| GPT-4o | 6.96 | 6.74 | 6.76 | 6.24 |
| o4-mini | 8.32 | 7.88 | 7.86 | 6.84 |
| GPT-4.1 | 8.50 | 8.88 | 8.46 | 8.42 |
| GPT-5 | 8.38 | 8.52 | 8.76 | 8.34 |
Webpage Code Generation
Closed-Source Model Dominance. In the Webpage Code Generation task, closed-source models significantly outperform their open-source counterparts across all subtasks and metrics, with no open-source model securing a top-two position in any category. As detailed in Table 3, Claude 3.7 Sonnet leads in most tasks, closely followed by other proprietary models like GPT-5, Gemini 2.5 Flash, and GPT-4.1, all demonstrating impressive, top-tier results. For instance, in the Code Refinement task, GPT-4.1 achieves a Gemini Visual Score of 9.03, indicating near-perfect visual reproduction in most cases, whereas the best-performing open-source model, Qwen2.5-VL-72B-Instruct, scores only 6.21 under the same settings. This performance gap is more pronounced in complex scenarios; in the Interaction Authoring task, proprietary models like o4-mini maintain high Code Scores of 0.55, while open-source models struggle significantly, with LLaVA-Onevision-72B dropping to a negligible 0.06. While Qwen2.5-VL-72B-Instruct and InternVL3-78B show relatively strong performance among open-source options, their scores are generally comparable only to GPT-4o rather than the leading closed-source models. A consistent trend across models is the alignment of performance across different metrics; models excelling in one visual or code-based score typically perform similarly well in others.
Insights on Input Modality and Task Difficulty. Subtask analysis reveals distinct patterns regarding input efficacy. While providing partial HTML (Code Refinement) naturally yields the highest performance, a comparative analysis of input modalities offers a surprising insight: Text to Code performance rivals Image to Code for top-tier models. For instance, Claude 3.7 Sonnet achieves a Code Score of 0.64 on Text to Code, matching its Image to Code performance, a balanced capability also clearly evidenced by GPT-5. Furthermore, as detailed in Appendix E.8, even text-only LLMs achieve highly competitive results when provided with detailed descriptions. This indicates that precise textual specifications can effectively substitute for visual inputs—a critical insight for designing efficient, low-latency front-end agents where visual processing overhead might be prohibitive. Conversely, Interaction Authoring remains the most challenging task, yielding lower scores despite simpler HTML-v1 targets, a difficulty underscored by interaction implementation rates (Table 9) where closed-source models exceed 70% success, far surpassing open-source models like LLaVA-Onevision-72B (16%).
Human Evaluation and Reliability. Blind human evaluation on the FullFront-mini dataset, using Gemini Visual Score criteria (Table 4), further confirms that closed-source models like Claude 3.7 Sonnet and GPT-4.1 are perceived as more accurate, frequently scoring above 8/10 for reproduction quality. While these models achieve high overall fidelity, examples in Appendix E reveal that even top performers exhibit minor imperfections in fine-grained details.

5 Discussion
5.1 Where Do MLLMs Struggle Most in Perception?
By analyzing the error types of 200 questions that all MLLMs (except o1 and Gemini 2.5 Pro) fail to answer correctly, we gain insight into the primary difficulties current MLLMs face in page perception. As shown in Figure 4 (a), MLLMs exhibit a particular difficulty in accurately understanding the alignment (21.5%), size (19.5%), spacing (15.5%), and precise positioning (18.5%) of page elements. These factors constitute the core reasons behind perception failures. For example, Figure 4 (b) shows an instance where MLLMs fail to correctly identify the position of the tag labeled “Human Rights Advocates” relative to the main title and subtitle, while Figure 4 (c) demonstrates an incorrect comparison of the sizes of two buttons (More examples and analysis can be found in Appendix D).
| Model | ||||
| Qwen2.5-VL-72B-Instruct | 22 | 28 | 10 | 40 |
| InternVL3-78B | 25 | 23 | 8 | 44 |
| GPT-4o | 32 | 13 | 21 | 34 |
| Claude 3.7 Sonnet | 44 | 3 | 36 | 17 |
| Gemini 2.5 Flash | 39 | 5 | 25 | 31 |
| GPT-5 | 48 | 6 | 31 | 15 |
5.2 Decoupling Analysis: The Relationship Between Visual Perception and Code Generation
A counter-intuitive finding from our results (Table 2 and Table 3) is that models excelling in perceptual QA tasks do not consistently outperform in code generation. For instance, InternVL3-78B demonstrates superior perceptual QA performance compared to Gemini 2.5 Flash, yet lags significantly in code generation capabilities. To investigate this causal link, we manually verified 100 samples from the Synthetic QA against their corresponding Image to Code outputs. We classified model behaviors into four quadrants based on two binary criteria: Perception Accuracy (), determined by whether the model correctly answered the QA question; and Code Implementation (), determined by whether the specific visual component mentioned in the QA was correctly implemented.
Divergent Failure Modes
Table 5 presents the confusion matrix. The distribution reveals distinct failure modes across model categories. Open-source models (e.g., Qwen2.5-VL-72B-Instruct, InternVL3-78B) exhibit a high frequency of cases, indicating that even when visual perception is accurate, coding capability remains the primary bottleneck. Conversely, advanced proprietary models like Claude 3.7 Sonnet and GPT-5 show a significant number of instances. We use “Grounding Failure” as a behavioral label for this quadrant: the model answers the fine-grained QA incorrectly while implementing the queried relation correctly on the original page. This behavior is consistent with reliance on canonical layout priors, but the observational result alone does not uniquely distinguish such priors from memorization or distribution matching. Appendix J provides controlled crop and local-edit interventions that probe these explanations directly.
Performance Decoupling
To further probe this decoupling effect, we analyzed the macroscopic generation scores grouped by the model’s perception accuracy on the corresponding pages. As detailed in Table 6, the generation performance metrics remain remarkably consistent regardless of whether the model correctly answered the perception questions. This statistical invariance implies that fine-grained perceptual errors do not significantly degrade the overall visual quality of the generated page. Note that Qwen2.5-VL-72B-Instruct’s lower score in the “Correct” group is attributed to a disproportionate occurrence of fatal generation errors (e.g., “Abnormal Image Size”) in that specific subset, reflecting generation instability rather than a negative causal link. More detailed observational examples can be found in E.9 and E.10; the intervention results are reported in Appendix J.
| Model | Perc. | Code Score | G-Vis Score | CLIP Score | DINO Score |
| Qwen2.5-VL -72B-Instruct | Cor. (46) | 0.386 | 4.430 | 0.705 | 0.409 |
| Wrg. (48) | 0.405 | 5.117 | 0.753 | 0.529 | |
| InternVL3-78B | Cor. (59) | 0.418 | 4.444 | 0.736 | 0.554 |
| Wrg. (42) | 0.409 | 4.422 | 0.715 | 0.486 | |
| GPT-4o | Cor. (43) | 0.336 | 6.007 | 0.799 | 0.672 |
| Wrg. (56) | 0.342 | 5.896 | 0.809 | 0.697 | |
| Claude 3.7 Sonnet | Cor. (57) | 0.646 | 8.826 | 0.887 | 0.805 |
| Wrg. (44) | 0.649 | 8.957 | 0.892 | 0.790 | |
| Gemini 2.5 Flash | Cor. (42) | 0.634 | 8.790 | 0.890 | 0.838 |
| Wrg. (72) | 0.628 | 8.596 | 0.877 | 0.796 | |
| GPT-5 | Cor. (75) | 0.568 | 8.436 | 0.882 | 0.808 |
| Wrg. (44) | 0.535 | 8.548 | 0.878 | 0.832 |
| Model | Size | Blank | Isolation | ||||||
| Ref | Img | Inter | Text | Ref | Img | Inter | Text | Inter | |
| Qwen2.5-VL-72B-Instruct | 38 | 62 | 11 | 84 | 8 | 4 | 2 | 3 | 2 |
| InternVL2.5-78B | 5 | 20 | 2 | 76 | 2 | 14 | 12 | 4 | 11 |
| InternVL3-78B | 6 | 20 | 5 | 95 | 5 | 14 | 10 | 1 | 1 |
| LLaVA-Onevision-72B | 1 | 22 | 3 | 64 | 5 | 45 | 1 | 9 | 88 |
| Claude 3.7 Sonnet | 2 | 1 | 0 | 3 | 3 | 0 | 0 | 0 | 0 |
| Gemini 2.5 Flash | 3 | 3 | 2 | 2 | 2 | 0 | 0 | 1 | 0 |
| GPT-4o | 2 | 11 | 0 | 54 | 1 | 0 | 0 | 1 | 0 |
| o4-mini | 16 | 9 | 2 | 17 | 0 | 0 | 0 | 6 | 0 |
| GPT-4.1 | 4 | 1 | 0 | 2 | 2 | 1 | 2 | 1 | 0 |
| GPT-5 | 1 | 1 | 0 | 1 | 0 | 1 | 0 | 0 | 0 |
| Model | Structure | Text | Image | Form |
| Qwen2.5-VL-72B-Instruct | 0.51 | 0.19 | 0.54 | 0.41 |
| InternVL2.5-78B | 0.43 | 0.11 | 0.52 | 0.34 |
| InternVL3-78B | 0.49 | 0.15 | 0.61 | 0.42 |
| LLaVA-Onevision-72B | 0.29 | 0.06 | 0.38 | 0.23 |
| Claude 3.7 Sonnet | 0.72 | 0.39 | 0.65 | 0.53 |
| Gemini 2.5 Flash | 0.70 | 0.40 | 0.71 | 0.51 |
| GPT-4o | 0.42 | 0.11 | 0.53 | 0.34 |
| o4-mini | 0.62 | 0.28 | 0.61 | 0.54 |
| GPT-4.1 | 0.63 | 0.27 | 0.64 | 0.64 |
| GPT-5 | 0.63 | 0.24 | 0.70 | 0.53 |
5.3 Can MLLMs Be an Excellent Front-End Engineer?
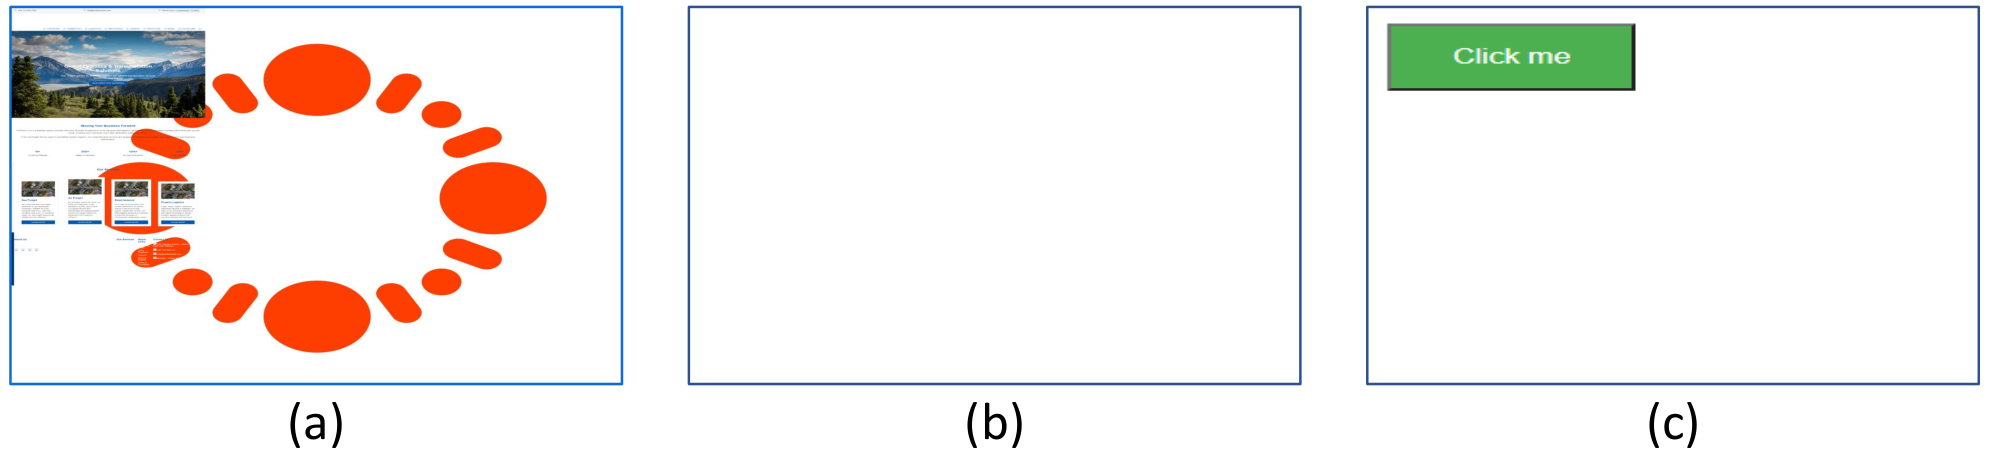
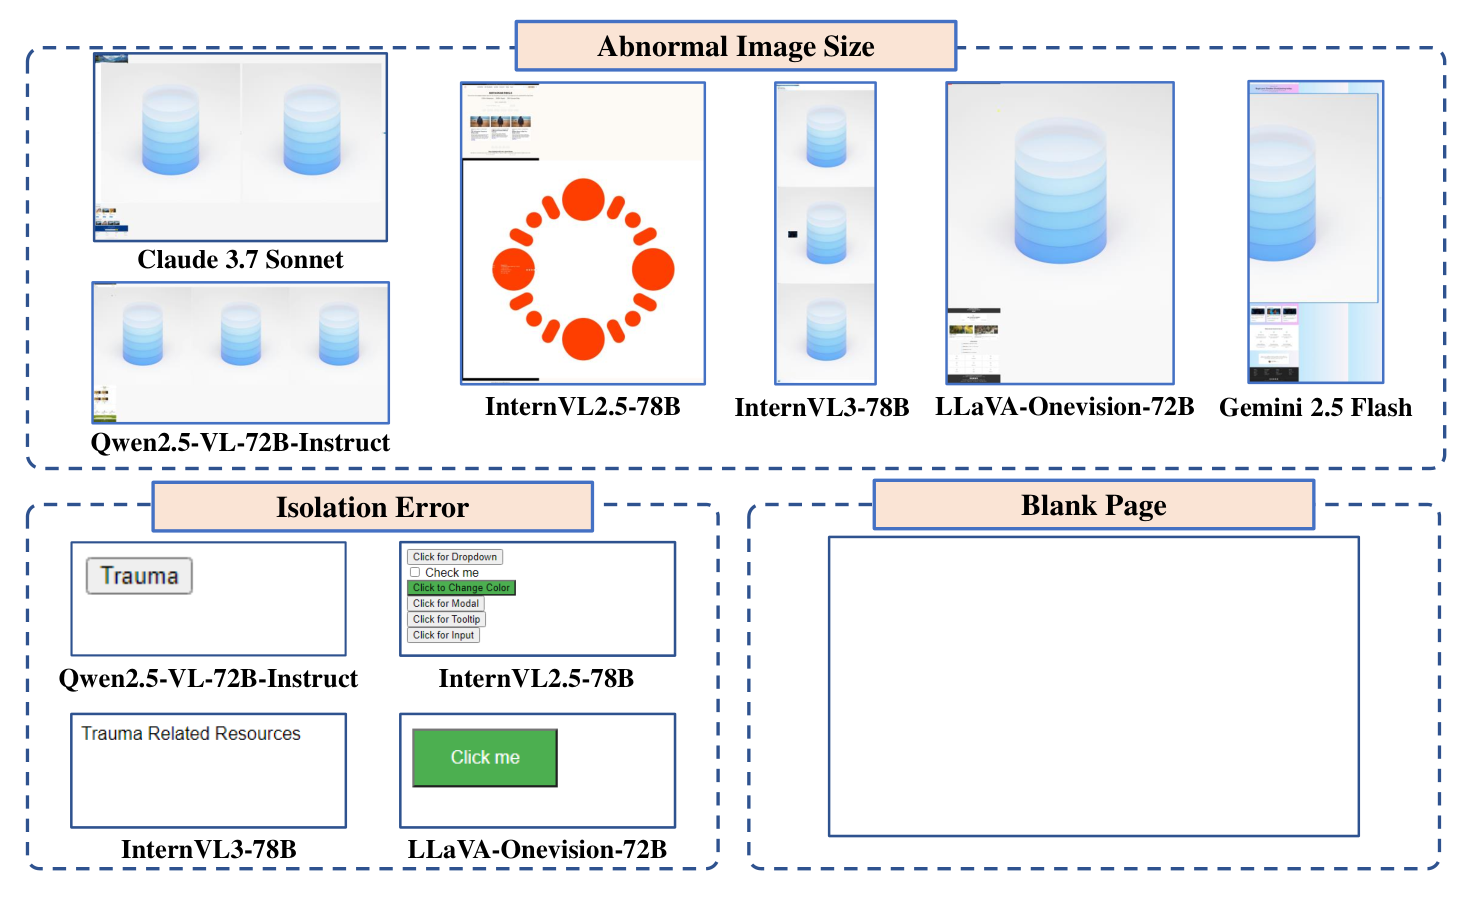
To determine if MLLM-generated pages are preferred by humans to real-world versions, five human experts conduct a blind evaluation on the same 100 source pages for each of eight MLLMs, comparing every generated page with its real-world counterpart. As detailed in Appendix F.5.2 (Figure 31), the results demonstrate that pages generated by leading models (e.g., o4-mini and Claude 3.7 Sonnet) are frequently preferred over the original real-world pages on the sampled aesthetic and information-effectiveness criteria. However, further analysis of the generated webpages reveals that MLLMs can exhibit three prevalent error categories, illustrated in Figure 5: Abnormal Image Size (abnormally large images disrupting layout integrity), Blank Page (entirely blank screenshots despite non-empty code), and Isolation Error (instances where only isolated interactive buttons are generated, neglecting page content). Each error type significantly degrades the effectiveness of the generated webpage. Table 7 shows that open-source models exhibit these errors markedly more often than closed-source counterparts; this considerably diminishes their reliability and stability. Furthermore, a detailed examination of code-level performance (Table 8) indicates that current MLLMs still have substantial room for improvement in text and form implementation, as similarity scores for these components do not exceed 0.65.
Overall, despite certain shortcomings in fine-grained details, MLLMs do demonstrate the capability to design generally coherent webpage interfaces from textual descriptions and can generate corresponding code from webpage screenshots. However, the overall deficiencies in their perceptual abilities, coupled with the potential for critical errors during code generation, render their current reliability and stability uncertain. We believe a promising future direction involves integrating MLLMs with specialized tools. This approach could compensate for their perceptual limitations and provide mechanisms to identify and rectify generation anomalies, thereby aiding MLLMs in their evolution towards becoming excellent front-end engineers.
6 Conclusion
We introduce FullFront, a pioneering and comprehensive Multimodal Front-end Benchmark. FullFront is designed to systematically evaluate the capabilities of Multimodal Large Language Models (MLLMs) across the entire front-end development pipeline, encompassing key aspects such as design, page perception, and code generation. By constructing high-quality, diverse synthetic data and designing a multi-layered evaluation system, FullFront serves as a powerful tool for in-depth analysis of the strengths and limitations of current MLLMs. While no single current model has yet mastered the entire workflow, FullFront provides the necessary infrastructure to evaluate future “Generalist Front-End Agents.” It establishes a standard for tracking the evolution of MLLMs from isolated task solvers to comprehensive engineering assistants, laying the foundation for the development of the next generation of intelligent webpage development tools.
Limitations
FullFront provides coordinated coverage of three front-end authoring stages—conceptualization, fine-grained perception, and implementation—but evaluates them separately. It does not pass artifacts from one stage to the next or measure end-to-end error propagation. The current code tasks use standalone HTML/CSS/JavaScript in a desktop, single-page browser environment. They therefore do not directly evaluate React, Vue, Tailwind, componentization, responsive/mobile design, cross-browser compatibility, multi-page navigation, deployment, maintainability, security, asynchronous APIs, authentication, persistence, or complex state management. Interaction Authoring is limited to ten controlled click/hover micro-interactions, and Perception QA measures fixed-choice visual discrimination rather than free-form grounding, debugging, or interactive webpage use.
The HTML-v2 references are standardized executable targets reconstructed by proprietary models rather than human-authored production code. The Grok-4 reconstruction study tests stability under an alternative proprietary generator but does not provide a non-model structural anchor, so reference-distribution matching cannot be fully excluded. Code Score measures reference-relative structural and content fidelity and retains a non-zero penalty for valid render-equivalent implementations. We therefore interpret it together with render-level metrics, executable checks, and human evaluation. Although real-world screenshots are manually screened for sensitive or harmful content, the benchmark may not represent all website genres, accessibility requirements, devices, or production constraints.
Ethical Considerations
We follow ACL/ARR ethics expectations and EMNLP 2026 paper-integrity guidance by reporting the data construction process, evaluation protocol, and model sources transparently. Real-world webpage screenshots are manually screened to remove private or harmful content, and the reconstruction pipeline is designed to avoid reproducing copyrighted source code. The benchmark is intended for evaluation and research; deployment of generated front-end code should still involve human review for privacy, accessibility, security, and reliability.
References
- Beltramelli (2018) Tony Beltramelli. 2018. pix2code: Generating code from a graphical user interface screenshot. In Proceedings of the ACM SIGCHI symposium on engineering interactive computing systems, pages 1–6.
- Chang et al. (2022) Yingshan Chang, Mridu Narang, Hisami Suzuki, Guihong Cao, Jianfeng Gao, and Yonatan Bisk. 2022. Webqa: Multihop and multimodal qa. In Proceedings of the IEEE/CVF conference on computer vision and pattern recognition, pages 16495–16504.
- Cheng et al. (2024) Kanzhi Cheng, Qiushi Sun, Yougang Chu, Fangzhi Xu, Yantao Li, Jianbing Zhang, and Zhiyong Wu. 2024. Seeclick: Harnessing gui grounding for advanced visual gui agents. arXiv preprint arXiv:2401.10935.
- Crawl (2025) Common Crawl. 2025. Common crawl datasets. Accessed: 2025-05-01.
- DeepSeek-AI (2025) DeepSeek-AI. 2025. Deepseek-r1: Incentivizing reasoning capability in llms via reinforcement learning. CoRR, abs/2501.12948.
- Deng et al. (2023) Xiang Deng, Yu Gu, Boyuan Zheng, Shijie Chen, Sam Stevens, Boshi Wang, Huan Sun, and Yu Su. 2023. Mind2web: Towards a generalist agent for the web. Advances in Neural Information Processing Systems, 36:28091–28114.
- Gou et al. (2024) Boyu Gou, Ruohan Wang, Boyuan Zheng, Yanan Xie, Cheng Chang, Yiheng Shu, Huan Sun, and Yu Su. 2024. Navigating the digital world as humans do: Universal visual grounding for gui agents. arXiv preprint arXiv:2410.05243.
- Gui et al. (2025) Yi Gui, Zhen Li, Yao Wan, Yemin Shi, Hongyu Zhang, Bohua Chen, Yi Su, Dongping Chen, Siyuan Wu, Xing Zhou, Wenbin Jiang, Hai Jin, and Xiangliang Zhang. 2025. Webcode2m: A real-world dataset for code generation from webpage designs. In Proceedings of the ACM on Web Conference 2025, WWW 2025, Sydney, NSW, Australia, 28 April 2025- 2 May 2025, pages 1834–1845. ACM.
- Guo et al. (2025) Hongcheng Guo, Wei Zhang, Junhao Chen, Yaonan Gu, Jian Yang, Junjia Du, Shaosheng Cao, Binyuan Hui, Tianyu Liu, Jianxin Ma, Chang Zhou, and Zhoujun Li. 2025. Iw-bench: Evaluating large multimodal models for converting image-to-web. In Findings of the Association for Computational Linguistics, ACL 2025, Vienna, Austria, July 27 - August 1, 2025, volume ACL 2025 of Findings of ACL, pages 6449–6466. Association for Computational Linguistics.
- Hui et al. (2025) Zheng Hui, Yinheng Li, Dan Zhao, Tianyi Chen, Colby R. Banbury, and Kazuhito Koishida. 2025. Winclick: GUI grounding with multimodal large language models. CoRR, abs/2503.04730.
- Laurençon et al. (2024) Hugo Laurençon, Léo Tronchon, and Victor Sanh. 2024. Unlocking the conversion of web screenshots into html code with the websight dataset. arXiv preprint arXiv:2403.09029.
- Liu et al. (2024) Junpeng Liu, Yifan Song, Bill Yuchen Lin, Wai Lam, Graham Neubig, Yuanzhi Li, and Xiang Yue. 2024. Visualwebbench: How far have multimodal llms evolved in web page understanding and grounding? arXiv preprint arXiv:2404.05955.
- Lu et al. (2024) Yadong Lu, Jianwei Yang, Yelong Shen, and Ahmed Awadallah. 2024. Omniparser for pure vision based gui agent. Preprint, arXiv:2408.00203.
- OpenAI (2024) OpenAI. 2024. Hello gpt-4o. https://openai.com/index/hello-gpt-4o/.
- Oquab et al. (2024) Maxime Oquab, Timothée Darcet, Théo Moutakanni, Huy V. Vo, Marc Szafraniec, Vasil Khalidov, Pierre Fernandez, Daniel Haziza, Francisco Massa, Alaaeldin El-Nouby, Mido Assran, Nicolas Ballas, Wojciech Galuba, Russell Howes, Po-Yao Huang, Shang-Wen Li, Ishan Misra, Michael Rabbat, Vasu Sharma, and 7 others. 2024. Dinov2: Learning robust visual features without supervision. Trans. Mach. Learn. Res., 2024.
- Radford et al. (2021) Alec Radford, Jong Wook Kim, Chris Hallacy, Aditya Ramesh, Gabriel Goh, Sandhini Agarwal, Girish Sastry, Amanda Askell, Pamela Mishkin, Jack Clark, Gretchen Krueger, and Ilya Sutskever. 2021. Learning transferable visual models from natural language supervision. In Proceedings of the 38th International Conference on Machine Learning, ICML 2021, 18-24 July 2021, Virtual Event, volume 139 of Proceedings of Machine Learning Research, pages 8748–8763. PMLR.
- Si et al. (2024) Chenglei Si, Yanzhe Zhang, Ryan Li, Zhengyuan Yang, Ruibo Liu, and Diyi Yang. 2024. Design2code: Benchmarking multimodal code generation for automated front-end engineering. arXiv preprint arXiv:2403.03163.
- Team (2025) Kimi Team. 2025. Kimi K2: open agentic intelligence. CoRR, abs/2507.20534.
- Wan et al. (2024) Yuxuan Wan, Yi Dong, Jingyu Xiao, Yintong Huo, Wenxuan Wang, and Michael R Lyu. 2024. Mrweb: An exploration of generating multi-page resource-aware web code from ui designs. arXiv preprint arXiv:2412.15310.
- Wang et al. (2021) Bryan Wang, Gang Li, Xin Zhou, Zhourong Chen, Tovi Grossman, and Yang Li. 2021. Screen2words: Automatic mobile ui summarization with multimodal learning. In The 34th Annual ACM Symposium on User Interface Software and Technology, pages 498–510.
- Wang et al. (2024) Maria Wang, Srinivas Sunkara, Gilles Baechler, Jason Lin, Yun Zhu, Fedir Zubach, Lei Shu, and Jindong Chen. 2024. Webquest: A benchmark for multimodal qa on web page sequences. arXiv preprint arXiv:2409.13711.
- Wang et al. (2025) Zhenhailong Wang, Haiyang Xu, Junyang Wang, Xi Zhang, Ming Yan, Ji Zhang, Fei Huang, and Heng Ji. 2025. Mobile-agent-e: Self-evolving mobile assistant for complex tasks. arXiv preprint arXiv:2501.11733.
- Wu et al. (2025) Jialong Wu, Wenbiao Yin, Yong Jiang, Zhenglin Wang, Zekun Xi, Runnan Fang, Linhai Zhang, Yulan He, Deyu Zhou, Pengjun Xie, and Fei Huang. 2025. Webwalker: Benchmarking llms in web traversal. In Proceedings of the 63rd Annual Meeting of the Association for Computational Linguistics (Volume 1: Long Papers), ACL 2025, Vienna, Austria, July 27 - August 1, 2025, pages 10290–10305. Association for Computational Linguistics.
- Wu et al. (2024) Zhiyong Wu, Chengcheng Han, Zichen Ding, Zhenmin Weng, Zhoumianze Liu, Shunyu Yao, Tao Yu, and Lingpeng Kong. 2024. Os-copilot: Towards generalist computer agents with self-improvement. arXiv preprint arXiv:2402.07456.
- Xiao et al. (2024) Jingyu Xiao, Yuxuan Wan, Yintong Huo, Zhiyao Xu, and Michael R Lyu. 2024. Interaction2code: How far are we from automatic interactive webpage generation? arXiv preprint arXiv:2411.03292.
- Xiao et al. (2025) Jingyu Xiao, Ming Wang, Man Ho Lam, Yuxuan Wan, Junliang Liu, Yintong Huo, and Michael R Lyu. 2025. Designbench: A comprehensive benchmark for mllm-based front-end code generation. arXiv preprint arXiv:2506.06251.
- Yun et al. (2024) Sukmin Yun, Haokun Lin, Rusiru Thushara, Mohammad Qazim Bhat, Yongxin Wang, Zutao Jiang, Mingkai Deng, Jinhong Wang, Tianhua Tao, Junbo Li, Haonan Li, Preslav Nakov, Timothy Baldwin, Zhengzhong Liu, Eric P. Xing, Xiaodan Liang, and Zhiqiang Shen. 2024. Web2code: A large-scale webpage-to-code dataset and evaluation framework for multimodal llms. In Advances in Neural Information Processing Systems 37: Annual Conference on Neural Information Processing Systems 2024, NeurIPS 2024, Vancouver, BC, Canada, December 10 - 15, 2024.
- Zhao et al. (2025) Henry Hengyuan Zhao, Difei Gao, and Mike Zheng Shou. 2025. Worldgui: Dynamic testing for comprehensive desktop gui automation. arXiv preprint arXiv:2502.08047.
- Zheng et al. (2024) Boyuan Zheng, Boyu Gou, Jihyung Kil, Huan Sun, and Yu Su. 2024. Gpt-4v (ision) is a generalist web agent, if grounded. arXiv preprint arXiv:2401.01614.
Appendix A Appendix Overview
This Appendix is organized as follows:
- •
Section B provides a detailed description of the FullFront-mini dataset, a condensed subset of the main benchmark designed for rapid evaluation.
- •
Section C offers additional qualitative examples for the Webpage Design task, providing a clearer view of the capabilities and limitations of current text-to-image models.
- •
Section D presents illustrative case studies for each subtask within the Webpage Perception QA task, highlighting common model failures and their underlying cause
- •
Section E elaborates on the four Webpage Code Generation subtasks, detailing the data curation process and presenting qualitative results that compare model outputs against ground-truth designs.
- •
Section F outlines our comprehensive evaluation framework, including the formulation and validation of the Gemini Visual Score and Code Score, MLLM experimental settings, and the human evaluation protocol.
- •
Section G validates the robustness of our benchmark against data-pipeline artifacts by introducing an independent dataset constructed via Grok-4, confirming that model rankings and metric reliability remain consistent across different data sources.
- •
Section H examines the impartiality of the Gemini 2.5 Flash evaluator, presenting a cross-judge validation that rules out “same-family bias” and demonstrates high alignment with human expert rankings.
- •
Section I analyzes the sensitivity of the Code Score metric, verifying its ability to tolerate valid syntactic variations (e.g., alternative layout techniques) while effectively penalizing semantic errors.
- •
Section J reports crop-assisted and counterfactual local-edit interventions for the Perception–Implementation Gap, separating the observed behavior from its possible mechanisms.
- •
Section K evaluates four newer frontier models on all Perception QA, Image-to-Code, and Text-to-Code items and quantifies the remaining benchmark headroom.
- •
Section K.3 documents the planned release contents, licenses, resource locations, and task-coverage accounting.
- •
Section L contains the complete, verbatim prompts used for both data curation and model evaluation across all tasks in the FullFront benchmark.
Appendix B FullFront-mini
FullFront-mini Dataset To facilitate rapid iterative evaluation of MLLMs and initial exploration of the benchmark by researchers, we constructed a FullFront-mini dataset. This subset is a condensed version of the full FullFront dataset, with the following specific composition. Webpage Perception QA: Includes 200 Real-world QA, 100 Synthetic QA, and 50 Multi-window QA data samples. Webpage Code Generation: Comprises 50 Image to Code, 50 Text to Code, 50 Interaction Authoring, and 50 Code Refinement data samples. Webpage Design: Consists of 50 Webpage Design task data samples.
Appendix C Webpage Design
The Webpage Design task evaluates an MLLM’s ability to generate a visual webpage design based on a textual description, assessing its capacity for conceptualization within the front-end workflow. Figure 6 illustrates the outputs from two evaluated text-to-image MLLMs, GPT-4o and gemini-2.0-flash-exp-image-generation, alongside the target “Label Image” (ground truth) for a representative example.

As observed in Figure 6, the design generated by GPT-4o (right) demonstrates a notably closer resemblance to the “Label Image” (left) compared to the output from gemini-2.0-flash-exp-image-generation (middle). Specifically:
- •
Layout and Structure: GPT-4o more successfully replicates the overall page structure, including the header, hero section, “Popular Categories” grid, and footer arrangement. The placement and relative sizing of these major components are more aligned with the ground truth. In contrast, the gemini-2.0-flash-exp-image-generation produces a layout that, while containing some similar thematic elements (like a search bar and category-like items), deviates more significantly in its structural organization and visual hierarchy.
- •
Element Completeness and Typography: GPT-4o tends to generate a design with a higher degree of element completeness. For example, the navigation links in the header, the search bar within the hero section, and the individual category cards appear more fully formed and are stylistically closer to the target. The typography choices in GPT-4o’s output also generally exhibit greater fidelity.
- •
Detail Discrepancies: Despite its superior overall performance, the GPT-4o design still exhibits discrepancies in fine-grained details. For instance, the footer section in the GPT-4o output uses a light background, contrasting with the dark background of the “Label Image” footer.

Additional qualitative results are provided in Figure 7. To summarize, the qualitative examples indicate that while text-to-image MLLMs such as GPT-4o are capable of producing webpage designs that align with the primary layout and components of a textual prompt, they still lack the fine-grained control necessary to precisely render all visual attributes. Details like exact color codes, specific text, and subtle styling elements present a significant opportunity for future research. The models excel at converting abstract concepts into concrete webpage structures, but their capacity to follow detailed, nuanced instructions needs to be enhanced.
Appendix D Webpage Perception QA
In this section, we provide a detailed breakdown of the three subtasks that constitute the Webpage Perception QA benchmark: Real-world QA, Synthetic QA, and Multi-window QA. For each subtask, we present an illustrative case study that highlights common model failures. Through an analysis of these specific examples, we aim to shed light on the root causes of these errors and pinpoint the underlying perceptual limitations of current MLLMs.
D.1 Real-world QA
The Real-world QA subtask is designed to rigorously evaluate an MLLM’s ability to comprehend visual information from authentic webpage screenshots. This subtask consists of 1,250 question-answer pairs derived from 625 real-world webpages. These screenshots are sourced from a combination of manual collection and established academic benchmarks, including Uground (Gou et al., 2024) and IW-Bench (Guo et al., 2025). The primary challenge of this subtask lies in the complexity and subtlety of the questions, which demand a high degree of perceptual acuity to correctly identify fine-grained details regarding element positioning, styling, and spatial relationships.
Figure 8 presents a representative example, where MLLMs are tasked with assessing the positional and stylistic relationship between the “Enroll for free” and “View details” buttons. In this instance, all evaluated MLLMs converged on an incorrect answer (A). Their choice indicates that they successfully perceived coarse-grained information: that the “Enroll for free” button is located to the left of “View details” and features a solid blue background. However, their analysis is flawed, as they incorrectly inferred that it was positioned vertically higher than the other button.
Crucially, the models failed to identify the subtle but correct detail required for answer C: that both buttons share an identical font weight. This case study starkly highlights a critical limitation in current MLLMs. While they can often process general layout and prominent visual cues, they struggle with the precise perception of element alignment and nuanced typographic styles, which are fundamental for high-fidelity front-end development.

D.2 Synthetic QA
To complement the Real-world QA, the Synthetic QA subtask assesses model performance in a more controlled setting. This subtask consists of 400 question-answer pairs generated from 200 unique webpage screenshots. These screenshots are not sourced from the wild; instead, they are products of the synthesis pipeline detailed in the main paper. This methodology allows for the creation of webpages that, while visually diverse and realistic, can feature subtle and deliberate variations from standard design conventions. The key challenge, therefore, is to test whether MLLMs are truly perceiving the provided visual evidence or are relying on strong priors about common webpage layouts.
The example in Figure 9 effectively demonstrates this challenge, requiring models to compare the relative spacing and alignment of four social media icons. The analysis reveals two distinct modes of failure among the models:
- •
InternVL2.5-78B and InternVL3-78B incorrectly concluded that the icons are evenly spaced (Option A). This error likely stems from a powerful prior, as equidistant spacing is a highly common design pattern. The models appear to have defaulted to this assumption—a form of model hallucination—instead of precisely analyzing the visual data.
- •
In contrast, Claude 3.7 Sonnet and Gemini 2.5 Flash exhibited a more nuanced partial understanding, correctly identifying the varied spacing among the first three icons. However, they also failed by incorrectly perceiving a vertical misalignment of the LinkedIn icon (Option B), leading them away from the correct answer, D.

This case study illustrates a critical pattern: even when MLLMs can successfully localize the specific region relevant to a question, their ability to perform a meticulous analysis of fine-grained spatial details within that region remains unreliable.
D.3 Multi-window QA
The Multi-window QA subtask significantly elevates the complexity to better simulate real-world scenarios where relevant information must be found across different contexts. This subtask is composed of 150 question-answer pairs distributed across 75 samples, where each sample presents a model with 2 to 4 distinct screenshots drawn from our Real-world QA set. The difficulty is twofold and distinguishes it from the previous subtasks: a model must first correctly localize the specific webpage screenshot relevant to the question, and only then perform the fine-grained perceptual analysis required to answer it. This tests both search and comprehension capabilities.
The case presented in Figure 10 highlights the compounded difficulty of this task. To answer a question about the layout of “Personal Productivity” course cards, the MLLMs must first identify the correct screenshot among the options. The results show a uniform failure, with all models incorrectly selecting option B. This choice reveals a significant perceptual error: the models incorrectly concluded that the “Bestseller” tag is positioned above the title lines, when in fact, the tag is located at the very bottom of the course card.
Simultaneously, this fixation on a misunderstood element caused them to overlook the correct statement in option A, which accurately describes that all price tags are equally aligned horizontally. This dual failure is revealing. It indicates that MLLMs not only face challenges in disambiguating and focusing on the correct visual context but also remain highly susceptible to misinterpreting spatial relationships even after localizing the right section. Their inability to perform systematic, holistic visual checks leads to errors in judgment.

Appendix E Webpage Code Generation
E.1 OmniParser
OmniParser, a screen parsing tool developed by Microsoft, is engineered to deconstruct User Interface (UI) screenshots into structured and readily comprehensible elemental data. This capability significantly enhances the proficiency of visual models, such as GPT-4o, in generating accurate operational instructions within a given interface. As illustrated in Figure 11, OmniParser adeptly detects a wide array of fine-grained UI elements from screenshots, including diminutive icons, buttons, and text boxes.
The output from OmniParser typically includes the bounding box coordinates and the recognized textual content for each detected element on the original webpage. An example of such extracted information is provided below:
Within the FullFront benchmark’s data curation pipeline, OmniParser serves as an auxiliary tool to facilitate the generation of high-quality training and evaluation instances. Specifically, it extracts elemental information (bounding boxes and content) from webpage screenshots. This extracted data is then leveraged by GPT-4o, which is involved in the dataset creation process, for data generation.

More precisely, for the Webpage Perception QA Task Data Generation, GPT-4o is provided with the original webpage screenshot, the same screenshot overlaid with OmniParser’s detected bounding boxes, and the structured data from OmniParser (which includes the coordinates of these boxes and their corresponding textual content). This comprehensive input is designed to alleviate the perceptual load on GPT-4o, allowing it to concentrate on formulating challenging Question-Answer (QA) pairs.
Similarly, for the Webpage Code Generation Task Data Generation, this same set of information (original screenshot, screenshot with bounding boxes, and OmniParser’s structured box/text data) is supplied to GPT-4o. This assists GPT-4o in generating an initial HTML representation (HTML-v1) as a foundational step in reconstructing the webpage.
E.2 Category-based Utilization Strategy for Images
Regarding images, instead of using simple placeholders, we employ a category-based utilization strategy. We classify common real-world image content into 15 predefined categories: People, Animal, Food, Plant, Landscape, Icon, Logo, Architecture, Technology, Transportation, Map, Texture, Art, Movie, and Other (visualized in Figure 12). Each category is linked to a fixed, non-copyrighted image URL following a standardized format, such as “https://fixed_part/{Category}.jpg”.

During the ground truth generation for code tasks, GPT-4o and Claude 3.7 Sonnet are instructed to select an appropriate category for any required image and use its corresponding URL. For evaluation, when an MLLM is tasked with generating webpage code, it must understand the image content from the provided screenshot, classify it into one of these 15 categories, and then generate HTML using the correct category-specific URL. Furthermore, because the intrinsic dimensions of these repository images are unknown, the MLLM is explicitly required to manually set the image sizes (width and height) and position within the HTML code to ensure the rendered output matches the layout depicted in the screenshot. This approach assesses MLLMs’ capabilities in image perception, categorization, and appropriate styling. It also ensures visual consistency for subsequent evaluation steps. Crucially, by deriving visual designs from real-world screenshots, our method generates webpages with greater diversity compared to “from scratch” techniques. This strategy ingeniously bypasses the laborious simplification of real-world code while still achieving simplification’s primary goals—such as removing sensitive information and external dependencies—and preserving as much original visual information as possible through categorized representation. The use of category-specific image URLs also facilitates straightforward dataset expansion with new image types in the future.
E.3 Image to Code
The Image to Code subtask serves as the foundational evaluation for webpage implementation. It is designed to assess an MLLM’s core ability to translate a static visual design into functional HTML code. The subtask comprises 200 distinct samples. During the evaluation, each MLLM is provided with a single webpage screenshot, which has been rendered from the high-fidelity HTML-v2 ground truth. The objective is to generate code that accurately replicates the visual appearance of the given image. This is the most direct and fundamental screenshot-to-code challenge within our benchmark, establishing a baseline for model performance.
Figure 13 and Figure 14 provide qualitative examples of various MLLM outputs on this task. The “Label Image” in each figure is the ground-truth screenshot provided as input to the models. A visual inspection reveals a clear performance gap between proprietary and open-source models.
Leading models like Claude 3.7 Sonnet, Gemini 2.5 Flash, and GPT-5 demonstrate a strong capability to grasp and reproduce the overall page layout, color schemes, and general style. However, they are not without flaws and often fail on fine-grained details. For example, as shown in Figure14, Claude 3.7 Sonnet incorrectly identifies the image category, while Gemini 2.5 Flash fails to apply the correct background color to the page.
In contrast, the performance of the open-source models is generally less consistent. As illustrated across both figures by models like LLaVA-Onevision-72B and InternVL3-78B, there is substantial room for improvement in fundamental areas such as overall layout integrity, the correct implementation of headers and footers, and the accurate rendering of text and image elements.


E.4 Code Refinement
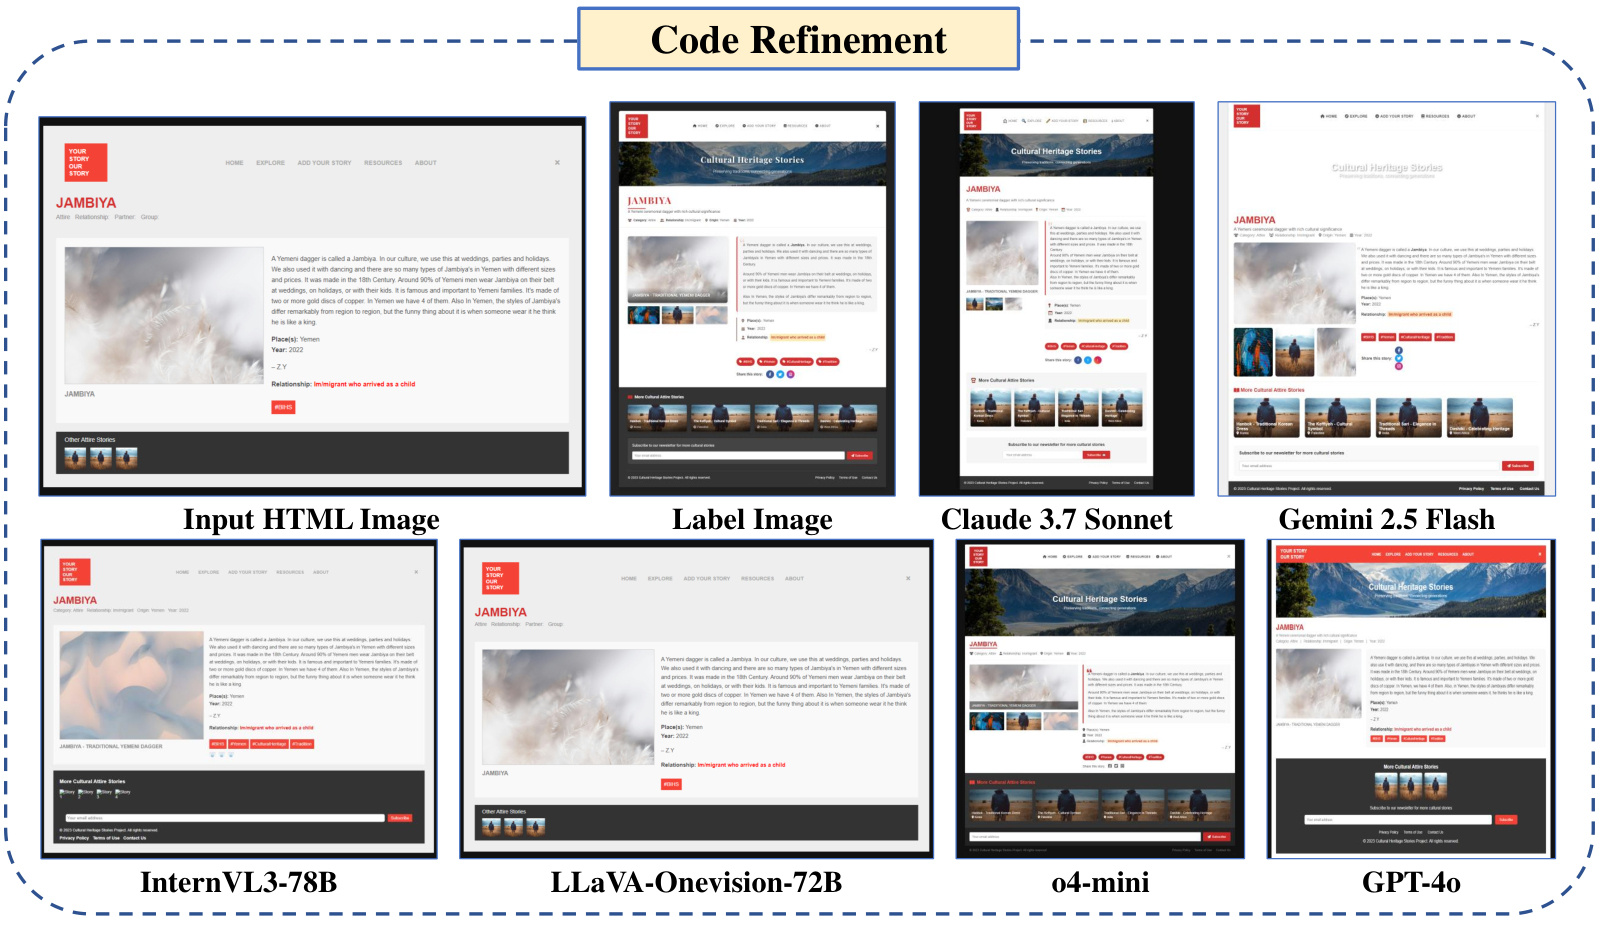
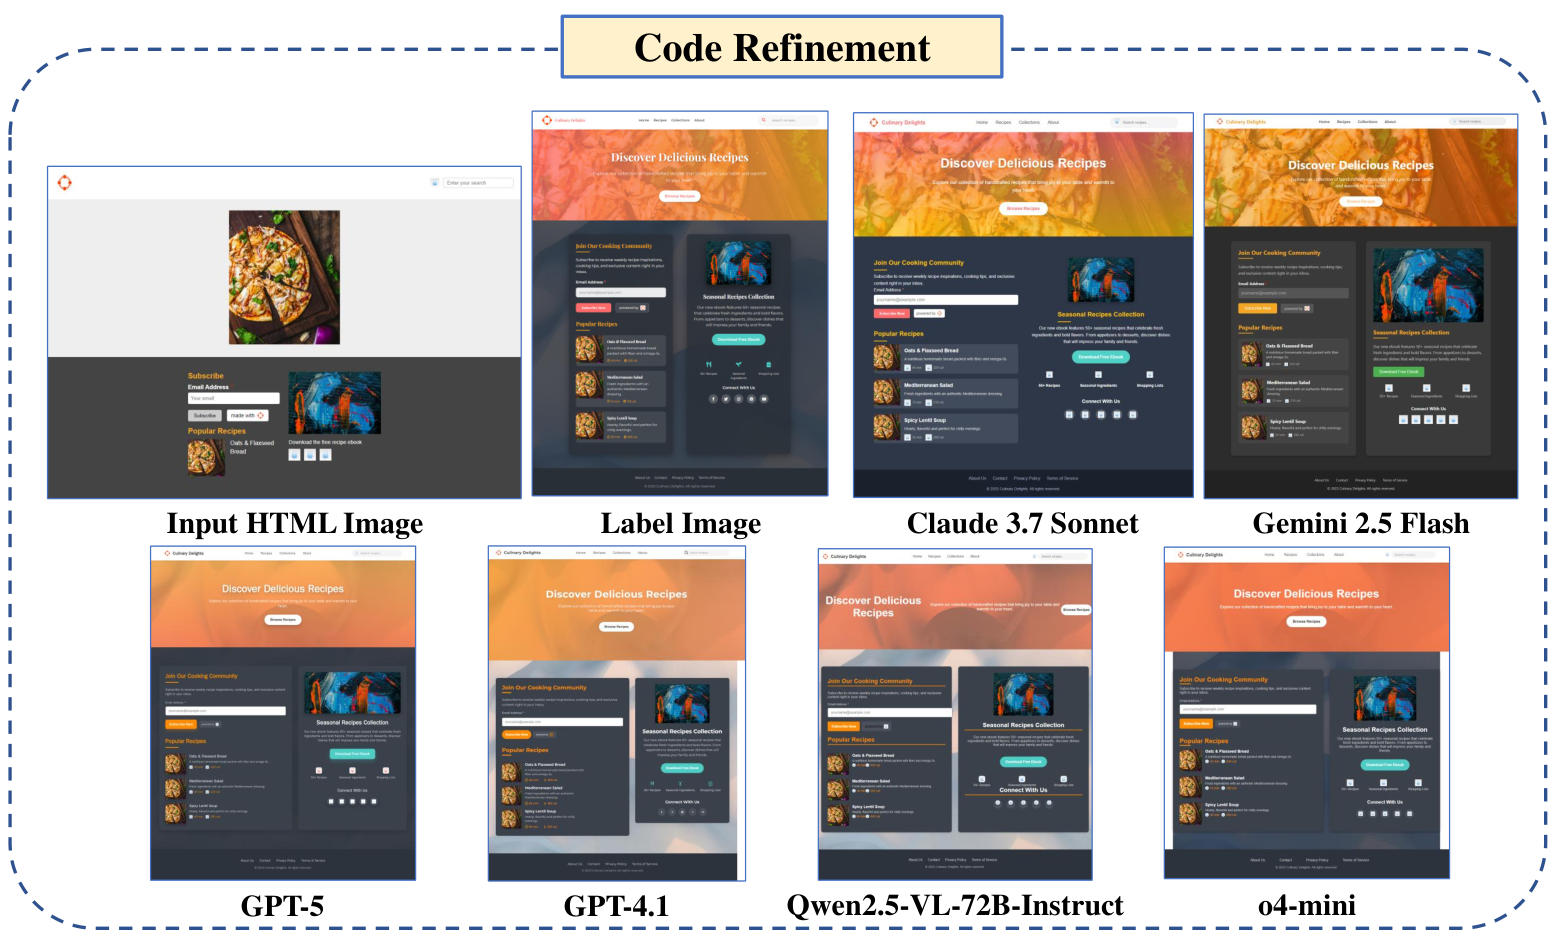
The Code Refinement subtask is designed to simulate a realistic and critical developer workflow: enhancing and optimizing existing code. Comprising 200 samples, this task evaluates an MLLM’s ability to modify and augment existing webpage code in order to achieve a target visual design. In this scenario, the model is provided with the HTML-v1 along with the Label Image rendered from the corresponding HTML-v2. The model’s objective is to modify and augment the provided HTML-v1 code to match the superior visual quality and complexity of the Label Image.
As illustrated in the examples in Figure 15 and Figure 16, the results highlight a significant performance disparity. Advanced closed-source models, notably Claude 3.7 Sonnet, o4-mini, and GPT-5, demonstrate a strong capability to perform this complex task. They successfully identify the discrepancies between the input and target visuals and apply appropriate changes to the base code to closely reproduce the Label Image. While their outputs are highly accurate, there remains some room for improvement in perfecting fine-grained details related to headers, footers, text content, and element proportions.
In stark contrast, many open-source models exhibit a more fundamental difficulty with the task’s core instruction. Rather than refining the provided HTML-v1, models such as InternVL3-78B and LLaVA-Onevision-72B often disregard the modification requirement entirely. Their outputs tend to be a near-verbatim copy of the initial code provided, showing minimal or no changes based on the target Label Image. This indicates a significant challenge not only in their code generation abilities but also in their capacity to comprehend and execute complex instructions that involve editing, rather than simply generating, code.
E.5 Text to Code
The Text to Code subtask evaluates an MLLM’s ability to function as both a designer and a developer by generating a complete webpage based solely on a natural language description. This subtask includes 200 samples. For each, a detailed textual description was generated by Claude 3.7 Sonnet based on a high-fidelity HTML-v2 rendered page, followed by a rigorous manual review to ensure accuracy and quality. During evaluation, models are provided only with this text, making this a “blind” generation task where no visual reference is available. The goal is to translate the abstract requirements into a concrete and visually accurate webpage.
The qualitative results are presented in Figure 17 and Figure 18. It is important to note that the “Label Image” is shown here only for reference; it represents the original webpage that was described but was not provided to the models during the test.
The examples reveal two key findings. First, when faced with a more unique design, such as the one in Figure 17, the models successfully capture the main theme—a page with a large, food-themed background. However, they share a common, subtle error: rendering the header with a solid white background instead of the correct transparent one. This suggests that while high-level concepts are well-understood, models may default to common design patterns for details not explicitly or strongly specified. Second, for webpages with more conventional, standardized layouts, as seen in Figure 18, the models perform remarkably well. Most are able to accurately reproduce the page’s structure, layout, and style from the text alone. This demonstrates their significant potential in the front-end development workflow, particularly for users without professional design or coding expertise. The ability to generate high-quality prototypes directly from a textual brief can dramatically lower the barrier to web creation and accelerate the initial stages of development.


E.6 Interaction Authoring
Moving beyond static page generation, this task evaluates MLLMs’ ability to implement dynamic, interactive webpages. Inspired by Interaction2Code (Xiao et al., 2024), we define ten common interaction types, categorized under click and hover events. For data construction, 100 samples derived from the static HTML-v1 (allowing models to focus primarily on interaction logic) are augmented with interaction code by Claude 3.7 Sonnet, followed by manual verification.
During testing, MLLMs receive “before” and “after” interaction screenshots and must reproduce the static page while implementing the depicted interactive behavior. To facilitate automated interaction detection, MLLMs are instructed to assign the ID “#InteractionPart” to the primary HTML element involved. The ten defined interaction types, with specific implementation requirements for each, are:
- 1.
Click to Display Dropdown (Interaction_click_1): An element, when clicked, reveals a dropdown menu whose content, position, and style are contextually adapted. Requires aria-expanded attribute toggling and specific dropdown selectors.
- 2.
Click to Toggle Checkbox (Interaction_click_2): A clickable checkbox that toggles its checked/unchecked state. Must use an <input type="checkbox"> or an element with role=’checkbox’, displaying a checked state after interaction.
- 3.
Click to Change Background Color (Interaction_click_3): An element significantly changes its background color upon being clicked, with the new color being distinct and detectable.
- 4.
Click to Display Modal/Dialog (Interaction_click_4): Clicking an element triggers a modal window or dialog box with contextually generated content and styling. The modal must match specific selectors like .modal or [aria-modal=’true’].
- 5.
Click to Display Tooltip (Interaction_click_5): An element, when clicked, displays a tooltip providing additional information. The tooltip must adhere to specified class names or attributes (e.g., .tooltip, [role=’tooltip’]).
- 6.
Click to Display Text Input (Interaction_click_6): Clicking an element reveals a text box or input area for user entry, appropriately sized and positioned.
- 7.
Hover to Display Dropdown (Interaction_hover_1): A dropdown menu appears when the mouse hovers over an element, with adaptive content and styling.
- 8.
Hover to Bold Text (Interaction_hover_2): Text within an element becomes bold (fontWeight 600 or ‘bold‘/‘bolder‘) upon mouse hover.
- 9.
Hover to Underline Text (Interaction_hover_3): Text within an element gains an underline when hovered over, with the computed textDecoration including “underline”.
- 10.
Hover to Display Tooltip (Interaction_hover_4): A tooltip with additional information appears when the mouse hovers over an element, conforming to specific class or attribute requirements.
The models must determine the correct interaction type from the visual cues and implement it according to these detailed specifications, providing the complete HTML, CSS, and JavaScript in a single file.
Model Performance Analysis. As shown in Table 9, there is a significant performance gap between closed-source and open-source models in interaction implementation. Top-tier models like o4-mini and GPT-5 achieve over 90% success rates, demonstrating robust capabilities in dynamic front-end logic. In contrast, open-source models struggle with this task, with success rates generally falling below 60%.
| Model | Interaction Success Rate | Interaction Success Rate (mini) |
| Qwen2.5-VL-72B-Instruct | 57.00 | 64.00 |
| InternVL2.5-78B | 47.00 | 54.00 |
| InternVL3-78B | 48.00 | 56.00 |
| LLaVA-Onevision-72B | 16.00 | 24.00 |
| Claude 3.7 Sonnet | 78.00 | 86.00 |
| Gemini 2.5 Flash | 70.00 | 72.00 |
| GPT-4o | 80.00 | 74.00 |
| o4-mini | 93.00 | 94.00 |
| GPT-4.1 | 78.00 | 80.00 |
| GPT-5 | 92.00 | 92.00 |
| Model | C1 | C2 | C3 | C4 | C5 | C6 | H1 | H2 | H3 | H4 |
| Qwen2.5-VL-72B-Instruct | 9 | 7 | 6 | 7 | 5 | 8 | 3 | 2 | 2 | 8 |
| InternVL2.5-78B | 7 | 6 | 6 | 8 | 4 | 6 | 0 | 2 | 4 | 4 |
| InternVL3-78B | 7 | 3 | 5 | 7 | 6 | 4 | 1 | 7 | 1 | 7 |
| LLaVA-Onevision-72B | 8 | 0 | 7 | 0 | 0 | 0 | 0 | 0 | 0 | 1 |
| Claude 3.7 Sonnet | 9 | 8 | 5 | 10 | 9 | 9 | 6 | 3 | 9 | 10 |
| Gemini 2.5 Flash | 7 | 9 | 6 | 9 | 8 | 9 | 6 | 1 | 8 | 7 |
| GPT-4o | 10 | 8 | 8 | 10 | 8 | 7 | 9 | 6 | 5 | 9 |
| o4-mini | 9 | 10 | 10 | 10 | 8 | 10 | 9 | 8 | 10 | 9 |
| GPT-4.1 | 10 | 5 | 8 | 10 | 8 | 9 | 7 | 8 | 3 | 10 |
| GPT-5 | 8 | 9 | 8 | 10 | 10 | 10 | 8 | 9 | 10 | 10 |
| Average | 8.4 | 6.5 | 6.9 | 8.1 | 6.6 | 7.2 | 4.9 | 4.6 | 5.2 | 7.5 |
Interaction Type Analysis. Beyond overall model performance, our analysis of success rates across different interaction types (Table 10) revealed varying capabilities among the tested models. The MLLMs demonstrated the highest proficiency in implementing Interaction_click_1 (Click to Display Dropdown), where, on average, models successfully realized this functionality in 8.4 out of the 10 test instances. Conversely, the most challenging categories proved to be Interaction_hover_2 (Hover to Bold Text) and Interaction_hover_1 (Hover to Display Dropdown). Notably, for these two hover-activated interaction types, no single model managed to successfully implement all 10 test cases.


The difficulty of this subtask is underscored by the qualitative results shown in Figure 19 and Figure 20. A critical observation is that the added complexity of implementing interaction often degrades the model’s performance in rendering the static base page. Even though the static portion is based on the simpler HTML-v1, the visual fidelity of the replication is frequently lower than in static-only tasks. This suggests the cognitive load of generating interaction logic detracts from the model’s ability to achieve precise visual accuracy. Furthermore, even when models successfully implement the correct interactive behavior (e.g., displaying a modal on click or a tooltip on hover), the final visual appearance of the “after interaction” state often shows significant discrepancies when compared to the ground-truth screenshot. These combined failures—in both static replication and dynamic fidelity—demonstrate a key deficiency in current MLLMs when it comes to creating robust, interactive web experiences.
E.7 Three Common errors
Across the Webpage Code Generation subtasks, we identified three recurring and critical failure modes that affect both open- and closed-source models: Abnormal Image Size, Blank Page, and Isolation Error. These errors are illustrated in Figure 21.
- •
Abnormal Image Size: This error occurs when rendered images, often several at once, are displayed at disproportionately large sizes, severely compromising the webpage’s layout and aesthetics. Our analysis reveals this issue is most prevalent with images categorized as “Icon” and “Logo”. We hypothesize this is because these image types are numerous, typically small, and can be easily overlooked by the model when applying explicit size constraints, unlike more prominent content images. Interestingly, models would sometimes correctly size several icons on a page but fail on a single one, indicating a lack of consistent style application.
- •
Isolation Error: This failure mode is unique to the Interaction Authoring subtask. It manifests as an output where the model generates only the code for the requested interactive element, completely omitting the surrounding static content of the webpage. This error points to a model’s limited ability to handle complex, multi-layered instructions; it appears to fixate on the primary directive (implement the interaction) while ignoring the implicit but essential requirement to reproduce the entire page.
- •
Blank Page: This error results in a completely empty page upon rendering, even when the generated code is not empty. The root cause typically traces back to a common failure mode in Large Language Models: repetitive generation. The model enters a loop, outputting the same content or code block repeatedly, which produces malformed HTML that a web browser cannot successfully parse and render.
In summary, the consistent occurrence of these three error types demonstrates that current MLLMs, regardless of their origin, have yet to achieve the stability and reliability required of a professional front-end engineer. Overcoming these fundamental failure modes is a critical step toward their practical application in autonomous web development.
E.8 Text-Only LLM Results on Text to Code
To explore the potential of powerful text-only LLMs in front-end development, we conducted a supplementary experiment on our Text to Code subtask, benchmarking models like the DeepSeek series (DeepSeek-AI, 2025) and Kimi K2 (Team, 2025) against the MLLMs from the main evaluation.
| Model | Gemini Visual Score | Clip Score | Code Score | DINOv2 Score |
| Qwen2.5-VL-72B-Instruct | 5.1750 | 0.7313 | 0.4854 | 0.4665 |
| InternVL2.5-78B | 5.4444 | 0.7366 | 0.4989 | 0.4824 |
| InternVL3-78B | 4.9144 | 0.7204 | 0.4969 | 0.4405 |
| LLaVA-Onevision-72B | 5.1273 | 0.7365 | 0.4129 | 0.5006 |
| Claude 3.7 Sonnet | 8.1358 | 0.8655 | 0.6436 | 0.7790 |
| Gemini 2.5 Flash | 8.0111 | 0.8660 | 0.5927 | 0.7929 |
| GPT-4o | 6.1351 | 0.7364 | 0.4857 | 0.5176 |
| o4-mini | 6.8728 | 0.8197 | 0.5052 | 0.6807 |
| GPT-4.1 | 8.3555 | 0.8685 | 0.5509 | 0.7960 |
| GPT-5 | 8.4780 | 0.8759 | 0.5886 | 0.7928 |
| R1-Distill-Llama-8B | 2.9540 | 0.6991 | 0.4189 | 0.4014 |
| DeepSeek-V3 | 7.9985 | 0.8617 | 0.5885 | 0.7828 |
| DeepSeek-R1 | 7.9381 | 0.8607 | 0.6090 | 0.7487 |
| Kimi K2 | 7.7675 | 0.8431 | 0.5422 | 0.7323 |
| DeepSeek-V3.1 | 7.8775 | 0.8719 | 0.6050 | 0.7980 |


The results in Table 11 are compelling. Despite lacking visual input, leading text-only models like DeepSeek-R1 and DeepSeek-V3.1 demonstrate highly competitive performance, achieving Code Scores (0.6090 and 0.6050 respectively) that not only surpass all open-source MLLMs but also rival top-tier closed-source MLLMs such as ‘Claude 3.7 Sonnet‘ (0.6436). Their strong performance is consistent across other visual and code-based metrics. This finding strongly suggests that with sufficiently detailed textual specifications, the advanced comprehension and coding abilities of text-only models can effectively compensate for the absence of a visual modality. As illustrated in Figure 22 and Figure 23, this highlights their significant potential in text-driven front-end development workflows, where they can successfully reproduce a webpage’s layout, element positioning, and overall style.
E.9 Correct Code Implementation Despite Perceptual Errors
This part provides a visual illustration supporting the discussion in Section 5.2, which highlights an intriguing discrepancy between MLLM performance on perceptual QA tasks and their ability to generate visually accurate code. Specifically, as detailed in Figure 4 (b) of the main paper, all evaluated MLLMs incorrectly identify the positioning of the “Human Rights Advocate” tag relative to the main title (“NAVI PILLAY”) and subtitle in the Webpage Perception QA task. However, when these same MLLMs are tasked with generating the webpage code, they often demonstrate correct implementation of this very element’s placement. Figure 24 presents the rendered outputs for the “NAVI PILLAY” webpage section from several MLLMs benchmarked in FullFront. These outputs are derived from the code generation tasks where models are asked to reproduce the webpage.
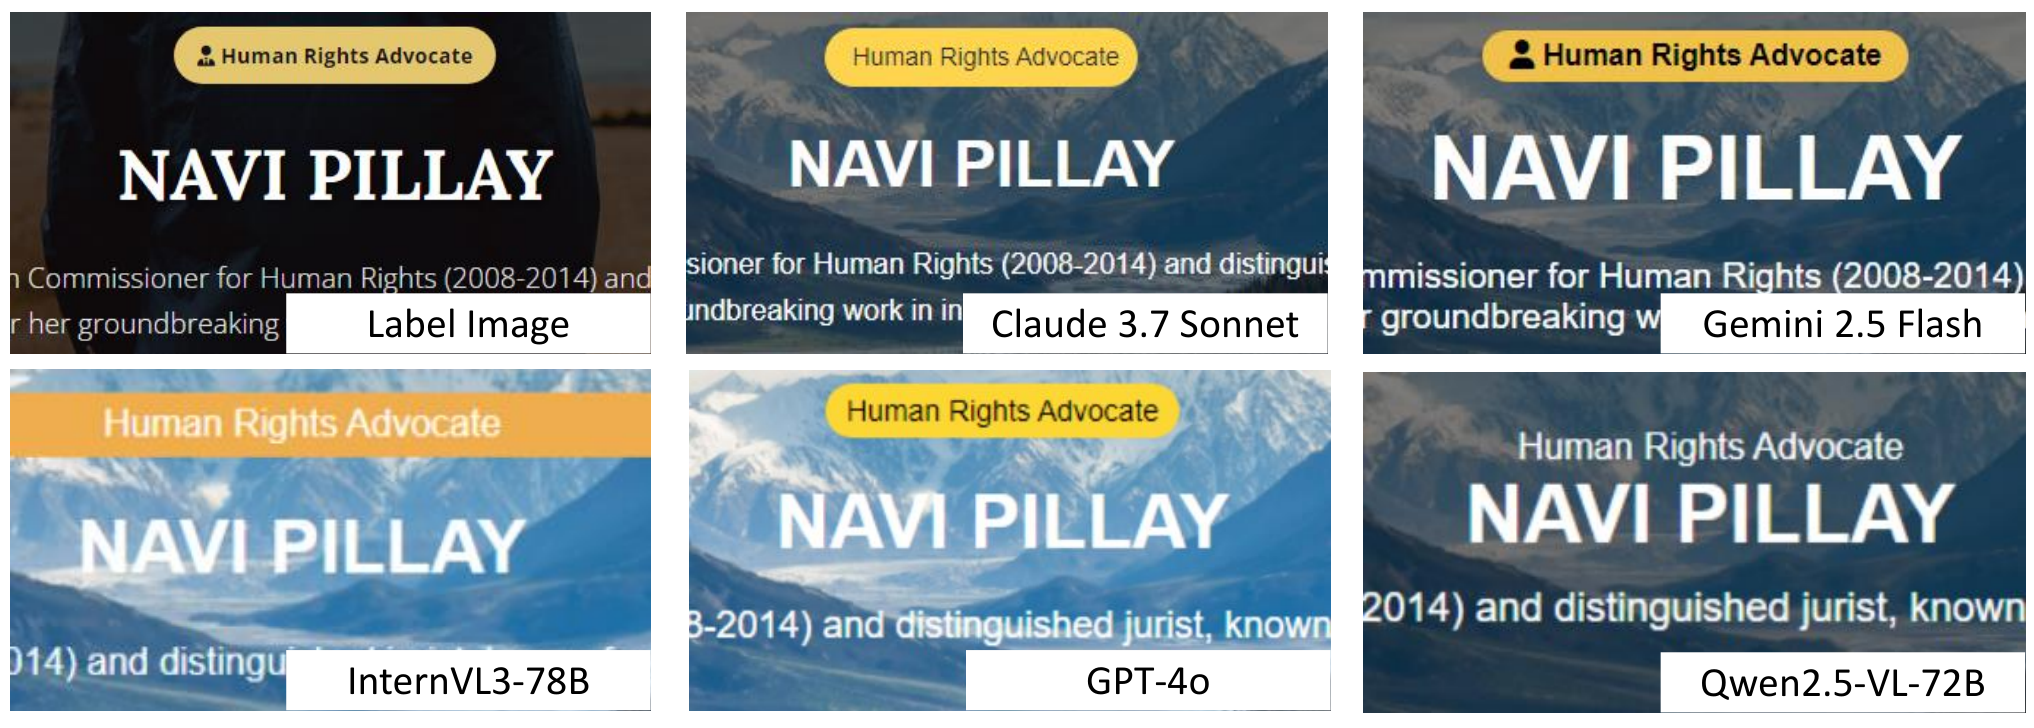
As can be observed in Figure 24, despite their prior failure in the specific perceptual QA question regarding the tag’s position, all depicted MLLM outputs correctly place the “Human Rights Advocate” tag directly above the main “NAVI PILLAY” title. This placement is consistent with the ground-truth webpage.
E.10 Detailed Visual Analysis of Perception-Code Quadrants
To provide concrete evidence for the decoupling phenomenon discussed in Section 5.2, we present representative case studies for each of the four behavior quadrants. These examples illustrate how models succeed or fail in bridging the gap between visual perception (QA accuracy) and implementation (code generation). For clarity, we display cropped sections of the full webpages relevant to the specific QA pairs.
Quadrant 1: Correct Perception, Correct Implementation (). Figure 25 demonstrates the ideal scenario where models successfully ground their visual understanding into code. In the first example, GPT-5 accurately perceives the vertical alignment between the search input box and the “About The Author” section, and faithfully reproduces this layout. Similarly, in the second example, GPT-5 correctly identifies and implements the left-alignment of the “Got a question?” headline relative to the search bar.
Quadrant 2: Correct Perception, Incorrect Implementation (). Figure 26 highlights the “Coding Bottleneck” typical of open-source models. In the top example, Qwen2.5-VL-72B-Instruct correctly answers that “Arrangement Dimensions” is positioned to the left of “Care Instructions” on the same row. However, its generated code fails to achieve this layout, stacking the elements vertically instead. In the bottom example, InternVL3-78B correctly perceives the baseline alignment and height match of the search elements but erroneously inserts a checkbox between the input field and the button during implementation, breaking the intended visual structure.
Quadrant 3: Incorrect Perception, Correct Implementation (). Figure 27 illustrates the “Grounding Failure” phenomenon prevalent in advanced proprietary models. In the first case, GPT-5 hallucinates a vertical spacing discrepancy in the navigation menu that does not exist (claiming “PORTFOLIO” to “BIOGRAPHY” is larger), yet its generated code produces perfectly even spacing. In the second case, GPT-5 incorrectly claims the category titles are indented to the right of the images. The ground truth (and the correct design principle) is center alignment, which the model successfully implements in its code despite the perceptual error. This strongly suggests reliance on internal design priors over direct visual grounding.
Quadrant 4: Incorrect Perception, Incorrect Implementation (). Figure 28 shows cases of complete failure. In the top example, GPT-4o misidentifies the styling of the “CUSTOM SAMPLE” button (claiming it has a border only), and proceeds to generate code where all buttons have filled backgrounds, contradicting the visual design. In the bottom example, GPT-4o not only fails to perceive the correct horizontal alignment of the search box relative to the author section but also fails to generate the search box entirely in the code, leading to a significant visual omission.


Appendix F Evaluation
F.1 Gemini Visual Score: Criteria and Rubric
To facilitate a fine-grained and human-aligned visual assessment of MLLM-generated webpages, we employ the Gemini 2.5 Flash model as a sophisticated visual evaluator. This model is tasked with comparing a rendered webpage image (generated by an MLLM) against its corresponding ground-truth image. To operationalize this evaluation, we designed a comprehensive rubric consisting of ten distinct visual dimensions. For each pair of images, the model provides a quantitative score on a scale of 0 to 10 for each dimension, where a score of 10 signifies perfect identity and a score of 0 indicates no discernible similarity.
The ten evaluation criteria are defined as follows:
- 1. Element Reproduction:
-
Assesses whether all key visual elements (e.g., text, images, buttons, icons) are fully present and styled identically to the original.
- 2. Proportion and Size Consistency:
-
Evaluates if the relative and absolute sizes of all elements match the original design, maintaining the intended visual harmony.
- 3. Layout and Typography Fidelity:
-
Examines the faithful replication of the overall page structure (e.g., headers, footers, content grids) and the consistent application of typography (font families, weights).
- 4. Alignment and Spacing Accuracy:
-
Measures the precision of element alignment (e.g., left, center, relative to other elements) and the consistency of spacing (margins, padding) compared to the ground-truth design.
- 5. Visual Hierarchy Clarity:
-
Assesses if the generated webpage successfully maintains the same visual hierarchy as the original, guiding the user’s attention to key information and calls to action similarly.
- 6. Color Consistency:
-
Evaluates the match of the overall color scheme, including primary, secondary, and accent colors, as well as specific hues and saturation levels.
- 7. Style Consistency:
-
Judges whether the overall aesthetic style of the generated webpage (e.g., modern, minimalistic, brutalist) aligns with the intended “look and feel” of the original design.
- 8. Text Style Consistency:
-
Focuses specifically on typographic attributes such as font family, size, weight, color, line height, and text alignment.
- 9. Text Content Accuracy:
-
Evaluates if the primary textual content (headings, body text, labels) accurately reproduces the text from the original design without omissions or significant alterations.
- 10. Overall Content Representation:
-
A holistic measure of whether the generated page effectively conveys the same core information, message, and user intent as the original.
To apply these criteria and collect the scores, the prompt shown in Figure 29 was provided to the Gemini 2.5 Flash model.
F.2 Code Score: Formulation and Components
Our Code Score evaluates the similarity between an MLLM-generated HTML document () and a reference HTML document (). The process involves parsing both documents into Document Object Model (DOM) trees, extracting associated CSS, and then performing a weighted aggregation of several similarity aspects.
1. Structural Similarity
Both and are first parsed into DOM trees. We then extract sequences of HTML tags, and respectively, representing the structural hierarchy of the documents. The structural similarity () is quantified by the ratio of the length of the Longest Common Subsequence (LCS) of these tag sequences to the length of the reference sequence, . A threshold ( in our implementation) is used within the LCS calculation to determine if two tags are considered similar enough to be part of a common subsequence.
| (1) |
If Length() is zero, is defined as 1.0.
2. Content-Type Similarity
This assesses similarity for three key content types: text, images, and forms. For each type, corresponding elements are identified and compared.
Element Matching
For each content type , we extract all elements of that type from (denoted ) and (denoted ). A matching algorithm identifies optimal corresponding pairs between and based on type-specific similarity measures (detailed below) and a matching threshold (). This process yields a set of matched pairs .
Implementation Rate
For each content type , an implementation rate () is calculated. This reflects the proportion of reference elements found and successfully matched in the generated HTML:
| (2) |
If is zero, is 1.0.
Similarity Scores for Matched Elements
For each matched pair :
- •
Text Elements (): Similarity is assessed based on:
- 1.
Content Similarity (): Calculated using Python’s SequenceMatcher on the textual content extracted.
- 2.
Style Similarity (): Computed by comparing key CSS properties (e.g., color, font-size, font-weight, background-color, etc.). Each property has a weight . The style similarity is a weighted average of individual property similarities. Numerical properties (e.g., sizes) are compared using a ratio, while string properties use SequenceMatcher.
The average and are calculated over all matched text elements.
- 1.
- •
Image Elements (): Similarity () is a weighted combination of:
- 1.
URL Similarity (0.6 weight): Based on comparing extracted category information from the image ‘src‘ attribute (e.g., “Animal” from “…/Animal.jpg”) or filenames if the category pattern doesn’t match.
- 2.
Style Similarity (0.3 weight): Calculated similarly to text styles, using image-specific CSS properties (e.g., width, height, border-radius, as per self.style_weights[’image’]).
- 3.
Alt Text Similarity (0.1 weight): Comparing the ‘alt‘ attributes using SequenceMatcher.
The average is calculated over all matched image elements.
- 1.
- •
Form Elements (): Similarity () depends on the specific form element type (e.g., ‘input‘, ‘button‘). It’s generally a weighted combination of:
- 1.
Attribute Similarity: Compares critical HTML attributes specific to the form element type (e.g., ‘type‘, ‘name‘, ‘value‘, ‘placeholder‘ for ‘input‘ elements) using SequenceMatcher.
- 2.
Style Similarity: Calculated using form-specific CSS properties (e.g., width, height, background-color).
- 3.
Text Content Similarity (only for elements like ‘button‘, ‘label‘, ‘option‘): Compares textual content using SequenceMatcher.
The average is calculated over all matched form elements.
- 1.
Adjusted Similarity Scores
The average similarity scores for each content aspect are then adjusted by their respective implementation rates to penalize incompleteness:
| (3) | ||||
| (4) | ||||
| (5) | ||||
| (6) |
where denotes the average similarity for matched elements of that type.
3. Final Code Score Aggregation
The final Code Score () is a weighted sum of the structural similarity and the adjusted content-type similarities. To ensure rigorous reproducibility, we explicitly specify the weight values used in our benchmark:
- •
Structure:
- •
Text: ,
- •
Visual Elements: ,
These weights are substituted into the aggregation formula as follows:
| (7) |
This multi-faceted Code Score provides a nuanced evaluation of the generated HTML, considering its structural integrity, content accuracy, stylistic fidelity, and overall completeness across different element types. These parameters are also strictly defined in our open-sourced evaluation scripts.
| Metric | Ref | Img | Inter | Text | Average |
| Gemini Visual Score | 0.9394 | 0.9273 | 0.9394 | 0.9394 | 0.9364 |
| Code Score | 0.8909 | 0.9152 | 0.9515 | 0.9030 | 0.9152 |
| Clip Score | 0.9394 | 0.9152 | 0.9879 | 0.7333 | 0.8939 |
| DINOv2 Score | 0.9030 | 0.9030 | 0.9394 | 0.8061 | 0.8879 |
F.3 Metric Validity
To rigorously assess the reliability of our proposed automatic evaluation metrics, we conducted a comprehensive validation against human judgments using Spearman’s rank correlation analysis. This non-parametric statistical method is ideal for our purpose as it measures the strength and direction of the monotonic relationship between two sets of ranked data, without assuming a linear relationship between them. A high positive correlation coefficient () would signify that a given automatic metric ranks the performance of different Multimodal Large Language Models (MLLMs) in a manner highly consistent with human evaluators’ preferences.
The validation process was executed as follows:
- 1.
Data Ranking: For each of the four subtasks within the Webpage Code Generation benchmark (Code Refinement, Image to Code, Interaction Authoring, and Text to Code), we established two sets of rankings for all evaluated MLLMs. The first set was derived from the human evaluation scores presented in Table 4. The second set was generated by ordering the models based on their performance under each automatic metric (Code Score, Gemini Visual Score, Clip Score, and DINOv2 Score), as detailed in Table 3.
- 2.
Correlation Calculation: We then computed the Spearman’s rank correlation coefficient () between the human preference ranking and each automatic metric’s ranking. This calculation was performed independently for each of the four subtasks to analyze the metrics’ performance in different contexts.
- 3.
Average Correlation: Finally, to determine the overall reliability of each metric across the entire benchmark, we calculated the average correlation coefficient across all four subtasks.
The results of this analysis are summarized in Table 12. The findings unequivocally demonstrate that our proposed metrics serve as excellent proxies for human assessment.
As presented in Table 12, our proposed Gemini Visual Score achieves the highest average correlation with human preferences across all tasks, with an impressive . This indicates an exceptionally strong monotonic relationship, confirming that the Gemini Visual Score is a highly robust and reliable indicator of generation quality as perceived by humans. It performs particularly well on the Ref, Img, and Text subtasks, achieving the best or tied-best correlation scores of , , and , respectively. These results demonstrate its strong capability to capture nuanced visual and semantic attributes that are critical to human evaluators.
Similarly, our custom-designed Code Score also demonstrates outstanding reliability, achieving the second-highest average correlation of . It performs particularly well on the Interaction Authoring subtask, where it achieves a strong correlation of , and also maintains consistently high correlations on the Img and Text subtasks, with and , respectively. This highlights its effectiveness in evaluating both structural fidelity and functional implementation. Concurrently, the established Clip Score and DINOv2 Score also prove their merit as valuable supplementary evaluation tools, achieving strong average correlations of and , respectively. These strong positive correlations indicate that they can provide complementary perspectives to our primary scores. Overall, this robust statistical validation underscores the credibility and effectiveness of the FullFront benchmark’s evaluation framework.
| Model | Parameter Setting | Source | URL | ||||
| Qwen2.5-VL-72B-Instruct | temperature = 0.0 | local checkpoint | https://huggingface.co/Qwen/Qwen2.5-VL-72B-Instruct | ||||
| InternVL2.5-78B | temperature = 0.0 | local checkpoint | https://huggingface.co/OpenGVLab/InternVL2_5-78B | ||||
| InternVL3-78B | temperature = 0.0 | local checkpoint | https://huggingface.co/OpenGVLab/InternVL3-78B | ||||
| LLaVA-Onevision-72B | temperature = 0.0 | local checkpoint | https://huggingface.co/llava-hf/llava-onevision-qwen2-72b-ov-hf | ||||
| R1-Distill-Llama-8b | temperature = 0.0 | local checkpoint | https://huggingface.co/deepseek-ai/DeepSeek-R1-Distill-Llama-8B | ||||
| Claude 3.7 Sonnet | temperature = 0.0 | claude-3-7-sonnet-20250219 | https://www.anthropic.com/ | ||||
| Gemini 2.5 Flash |
|
gemini-2.5-flash-preview-04-17 | https://ai.google.dev/ | ||||
| GPT-4o | temperature = 0.0 | gpt-4o-2024-11-20 | https://platform.openai.com | ||||
| o4-mini | reasoning_effort=medium (default) | o4-mini-2025-04-16 | https://platform.openai.com | ||||
| GPT-4.1 | temperature = 0.0 | gpt-4.1-2025-04-14 | https://platform.openai.com | ||||
| GPT-5 | default | gpt-5-2025-08-07 | https://platform.openai.com | ||||
| Gemini 2.5 Pro |
|
gemini-2.5-pro-preview-05-06 | https://ai.google.dev/ | ||||
| o1 | reasoning_effort=medium (default) | o1 | https://platform.openai.com | ||||
|
- |
|
https://ai.google.dev/ | ||||
| DeepSeek-V3 | temperature=0.0 | deepseek-v3-250324 | https://www.deepseek.com | ||||
| DeepSeek-R1 | temperature=0.0 | deepseek-r1-250528 | https://www.deepseek.com | ||||
| DeepSeek-V3.1 | temperature=0.0 | deepseek-v3-1-250821 | https://www.deepseek.com | ||||
| Kimi-K2 | temperature=0.0 | kimi-k2-0711-preview | https://api.moonshot.cn/v1 |
F.4 MLLM Evaluation Settings
The experimental evaluation of the four open-source Multimodal Large Language Models (MLLMs) featured in this study—specifically, Qwen2.5-VL-72B-Instruct, InternVL2.5-78B, InternVL3-78B, and LLaVA-Onevision-72B—is conducted on a high-performance computing infrastructure. For the inference phase, these models are benchmarked utilizing a configuration of 48 CPU cores and 4 NVIDIA A100-SXM4-80GB GPUs. Our development and evaluation environment is built upon PyTorch version 2.6.0+cu118, leveraging CUDA version 11.8 for GPU acceleration. In line with our commitment to transparency and to facilitate further research within the community, all code developed for the FullFront benchmark, including model evaluation pipelines and custom metric implementations, has been made publicly available. The official sources for all evaluated models are comprehensively listed in Table 13. In adherence to best practices for reproducible research, hyperparameters were typically maintained at their default settings during model evaluation. Detailed hyperparameter configurations for each model can be found in Table 13.
F.5 Human Evaluation
This section details the methodologies for the human evaluations referenced in the main paper. We first outline the standardized rating interface and protocol used for scoring the visual fidelity of generated webpages against their ground-truth counterparts. Following this, we describe a supplementary comparative study designed to provide a more nuanced assessment by pitting MLLM-generated webpages against their original, real-world versions across multiple qualitative dimensions.
F.5.1 Evaluation Methodology and Rating Interface
To ensure a consistent and reproducible scoring process, human evaluators were provided with a standardized rating environment.
The rating tool is a self-contained application developed in Python, with a graphical user interface (GUI) built using Tkinter. Upon launch, the interface presents two images side-by-side, as illustrated in Figure 30. The left image displays the MLLM-generated output, while the right image serves as the ground-truth reference.

Key features of the rating process:
- 1.
Blind Evaluation: Crucially, evaluators are not informed of the specific model that generated the output they are assessing at any given time, thereby ensuring a blind evaluation process to mitigate potential biases.
- 2.
Scoring Scale: A numerical rating scale from 0 to 10 (inclusive) is used, where 0 indicates complete inconsistency with the ground truth or specified criteria, and 10 signifies perfect adherence. Decimal scores are permitted to allow for finer-grained assessments.
- 3.
Workflow: Evaluators submit scores via the “Enter” key or a “Submit” button. Progress is saved automatically, allowing evaluators to pause and resume their work seamlessly. All ratings are stored in a JSON file for subsequent analysis.
The evaluators’ assessments are guided by the same detailed rubric used for the Gemini Visual Score (as outlined in Appendix F.1). The final 0-10 score for each generated image is a holistic rating based on ten criteria grouped into three categories: Visual Structure, Color and Aesthetics, and Textual Content.
F.5.2 Comparative Evaluation Against Real-World Webpages
Figure 31 illustrates a direct comparison of human preference between MLLM-generated webpages and their real-world counterparts. However, a simple assertion of “superiority” over real-world examples can be imprecise and subject to bias; for instance, evaluators might prefer the clean, generic templates produced by MLLMs over cluttered, complex source websites. To investigate this with greater nuance, we conducted a supplementary human evaluation designed to separate preference across multiple dimensions.
We randomly sampled 100 of the 200 Image-to-Code source pages and used this same page set for all eight models in Table 14. We recruited five evaluators from diverse professional backgrounds. For every model, each evaluator blindly compared all 100 generated pages with their corresponding original real-world pages, yielding 500 judgments per model per criterion and 4,000 judgments per criterion across the eight models. The study therefore evaluates rendered-page quality on the Image-to-Code subset; it does not pool the other Code Generation subtasks into its denominator. Each pair received a “win–tie–loss” judgment along two distinct axes:
- 1.
Aesthetic Appeal: Which page is more visually attractive and demonstrates a higher quality of design?
- 2.
Information Effectiveness: Which page conveys its core message more clearly and efficiently guides the user toward potential tasks?
| Model | Aes(w) | Aes(t) | Aes(l) | Inf(w) | Inf(t) | Inf(l) |
| Qwen2.5-VL-72B-Instruct | 15.2 | 34.4 | 50.4 | 13.8 | 38.4 | 47.8 |
| InternVL2.5-78B | 18.6 | 28.8 | 52.6 | 29.8 | 38.2 | 32.0 |
| InternVL3-78B | 23.6 | 33.4 | 43.0 | 34.6 | 34.0 | 31.4 |
| LLaVA-Onevision-72B | 6.0 | 10.8 | 83.2 | 7.6 | 25.0 | 67.4 |
| Claude 3.7 Sonnet | 80.0 | 15.6 | 4.4 | 62.8 | 29.0 | 8.2 |
| Gemini 2.5 Flash | 75.4 | 16.6 | 8.0 | 63.2 | 27.8 | 9.0 |
| GPT-4o | 38.6 | 43.6 | 17.8 | 29.0 | 54.6 | 16.4 |
| o4-mini | 69.0 | 21.6 | 9.4 | 77.6 | 14.0 | 8.4 |
The aggregated results, presented in Table 14, offer a more granular perspective. On this sampled set, leading MLLMs like Claude 3.7 Sonnet (80.0% win rate) are strongly preferred for Aesthetic Appeal. This is consistent with evaluators favoring the clean, modern, and often minimalistic designs generated by these models.
However, the advantage is less pronounced in Information Effectiveness. While top models still outperform, the gap narrows considerably. This suggests that while MLLM-generated designs are visually pleasing, they may not always match the purpose-driven, information-rich layouts of real-world websites, which have often been iteratively optimized for user experience. This multi-dimensional analysis reframes the discussion from simple “superiority” to a more nuanced understanding of the specific strengths (aesthetics) and potential trade-offs (information architecture) of current MLLM-based front-end generation.
Appendix G Investigation of Data-Pipeline Bias
A valid concern in evaluating Multimodal Large Language Models (MLLMs) is the potential for data-pipeline bias. Since our primary benchmark dataset utilizes GPT-4o for initial generation and Claude 3.7 Sonnet for refinement, there is a risk that the evaluation might implicitly favor these models due to stylistic overfitting or shared latent patterns in the data distribution.
G.1 Experimental Setup
To scrutinize this potential bias and verify that FullFront evaluates fundamental front-end engineering capabilities rather than pipeline-specific artifacts, we conducted a controlled experiment using an independent data generation engine. We employed Grok-4, a model entirely distinct from those used in our main pipeline, to construct a new evaluation dataset. This “Grok-4 Set” comprises 300 samples, evenly distributed across three core subtasks: Code Refinement (Ref), Image to Code (Img), and Text to Code (Text). We then evaluated six representative models on this unseen dataset.
G.2 Results and Analysis
The detailed evaluation results are presented in Table 15. Our analysis focuses on two key dimensions: the consistency of model performance hierarchies and the validity of our automated metrics on this new data distribution.
Consistency of Model Rankings: Despite the shift in the data generation source to Grok-4, the performance hierarchy of the evaluated models remains consistent with our main benchmark results. As shown in the “Human Score” columns, GPT-5 and Claude 3.7 Sonnet occupy the top two positions across the three tested subtasks (e.g., GPT-5 achieves a Human Score of 8.52 on Ref and 6.78 on Text). Gemini 2.5 Flash follows, while the evaluated open-source models score lower, particularly on the visual-fidelity tasks (Ref and Img). This result shows ranking stability under one alternative proprietary reconstruction pipeline. Because Grok-4 is also a proprietary model and the study omits Interaction Authoring, it mitigates but does not eliminate concerns about model-generated reference distributions or establish equivalence to human-authored production code.
Metric Validity and Alignment with Human Judgment: To verify the reliability of our automated metrics on this independent dataset, we calculated the Spearman rank correlation coefficient () between the model rankings produced by each automated metric and those produced by human experts for each subtask (labeled as IRR in Table 15). The results demonstrate that our proposed metrics maintain high robustness:
- •
Gemini Visual Score: Exhibits the strongest alignment with human judgment, achieving Spearman correlations of 0.89, 0.94, and 0.83 across the Code Refinement, Image to Code, and Text to Code tasks, respectively. This confirms its utility as a reliable proxy for human visual assessment even on unseen data distributions.
- •
Code Score: Also shows strong correlation, particularly in the Refinement () and Image to Code () tasks, validating its effectiveness in measuring structural and content fidelity.
- •
Limitations of Pure Visual Embeddings: Interestingly, while CLIP and DINOv2 scores correlate well in image-based tasks, their correlation drops significantly in the Text to Code task ( and ). This further highlights the necessity of our specialized Code and Gemini scores for a comprehensive evaluation of front-end generation.
The replicated ranking pattern and metric correlations on the Grok-4 set provide evidence that the main results are not unique to the original GPT-4o–Claude 3.7 Sonnet construction pipeline. We interpret this as a partial robustness check under an alternative proprietary generator, not as a non-model reference anchor or proof that all pipeline-specific bias has been removed.
| Model | Code Score | Gemini Visual Score | CLIP Score | DINOv2 Score | Human Score | ||||||||||
| Ref | Img | Text | Ref | Img | Text | Ref | Img | Text | Ref | Img | Text | Ref | Img | Text | |
| Qwen2.5-VL-72B-Instruct | 0.27 | 0.35 | 0.34 | 4.05 | 4.85 | 5.83 | 0.69 | 0.69 | 0.76 | 0.48 | 0.47 | 0.57 | 6.16 | 4.16 | 5.62 |
| InternVL3-78B | 0.27 | 0.34 | 0.26 | 5.93 | 5.96 | 5.08 | 0.72 | 0.72 | 0.73 | 0.45 | 0.51 | 0.54 | 5.97 | 5.03 | 5.75 |
| Claude 3.7 Sonnet | 0.54 | 0.51 | 0.41 | 8.79 | 8.60 | 6.24 | 0.80 | 0.79 | 0.74 | 0.68 | 0.67 | 0.54 | 8.30 | 8.52 | 6.46 |
| Gemini 2.5 Flash | 0.48 | 0.48 | 0.38 | 8.07 | 8.27 | 6.20 | 0.80 | 0.79 | 0.78 | 0.69 | 0.67 | 0.62 | 7.87 | 7.62 | 6.15 |
| GPT-4o | 0.53 | 0.47 | 0.33 | 7.17 | 6.78 | 6.19 | 0.76 | 0.74 | 0.75 | 0.53 | 0.52 | 0.59 | 6.38 | 5.76 | 5.69 |
| GPT-5 | 0.63 | 0.60 | 0.41 | 8.45 | 8.73 | 6.51 | 0.83 | 0.86 | 0.79 | 0.70 | 0.74 | 0.64 | 8.52 | 8.47 | 6.78 |
| Spearman (IRR) | 0.89 | 0.89 | 0.77 | 0.89 | 0.94 | 0.83 | 0.89 | 0.83 | 0.31 | 0.94 | 0.94 | 0.37 | 1.00 | 1.00 | 1.00 |
Appendix H Analysis of Model-as-Judge Bias
The deployment of Multimodal Large Language Models (MLLMs) as evaluators introduces the specific challenge of “same-family bias,” wherein a judge may disproportionately favor models from the same developer. To preemptively quantify and rule out such artifacts within our framework, we conducted a cross-judge validation experiment to verify the robustness and impartiality of our chosen evaluator, Gemini 2.5 Flash.
H.1 Experimental Setup
We curated a stratified subset of 200 samples from the FullFront benchmark, selecting 50 samples from each of the four Code Generation subtasks to ensure diverse coverage. We compared the scoring behaviors of Human Experts against four automated judges: our primary judge Gemini 2.5 Flash, two other proprietary models (Claude 3.7 Sonnet, Grok 4), and a state-of-the-art open-source model, Qwen3-VL-235B-A22B-Instruct.
We assessed the judges based on two primary dimensions:
- •
Inter-rater Reliability (IRR): We employed Spearman’s rank correlation coefficient () and Intraclass Correlation Coefficient (ICC) to measure sample-level agreement with human scores. Additionally, we calculated the average score deviation (Bias) to identify systematic scaling differences.
- •
Ranking Consistency: We used Kendall’s to evaluate the alignment of the aggregated model leaderboards produced by each judge against the human-derived leaderboard.
- •
Stability: We performed three independent inference runs (with temperature=0 where applicable) to measure test-retest reliability via standard deviation () and inter-run correlation.
H.2 Results and Analysis
Absence of Self-Preference Bias. The results presented in Table 16 provide compelling evidence against self-preference bias in the Gemini 2.5 Flash judge. First, the model demonstrates strict objectivity by ranking itself consistently below GPT-5 and Claude 3.7 Sonnet, achieving a perfect alignment with human ranking (Kendall’s ). Second, while Gemini 2.5 Flash tends to assign higher absolute scores than human evaluators, this inflation is systematic rather than selective. As detailed in Table 16, the bias toward its own outputs () is effectively identical to the bias exhibited toward its primary competitors, GPT-5 () and Claude 3.7 ().
Crucially, this pattern of uniform deviation is corroborated by other automated judges, confirming that such offsets reflect a judge’s inherent strictness rather than preferential treatment. For instance, the Claude 3.7 Sonnet judge exhibits a uniform strictness, systematically subtracting approximately points across the top three models (GPT-5: , Claude: , Gemini: ). Conversely, the Qwen3-VL judge displays a lenient baseline similar to Gemini’s, adding approximately points uniformly (GPT-5: , Claude: , Gemini: ). The consistency of these relative gaps across diverse judges confirms that Gemini’s scoring reflects a stable, objective standard—merely shifted by a constant calibration factor—rather than an algorithmic attempt to artificially boost its relative standing.
Robustness of the Scoring Rubric. It is notable that all four automated judges achieved a perfect ranking alignment with human experts (Kendall’s ). This unanimity suggests that our fine-grained scoring rubric (detailed in Appendix G.1) successfully guides diverse models to replicate human evaluation logic, reducing the dependence on model-specific priors and ensuring that the evaluation criteria are model-agnostic.
Viability of Open-Source Judges. Our experiment identifies Qwen3-VL-235B-A22B-Instruct as a highly capable open-source alternative for automated evaluation. It demonstrates reliability metrics (ICC=0.851, Spearman =0.764) that are comparable to, and in some cases competitive with, proprietary models. This finding offers a reproducible and accessible evaluation pathway for the research community.
Judge Stability. Table 17 summarizes the test-retest reliability. Gemini 2.5 Flash exhibits exceptional stability with a negligible standard deviation () and a high inter-run correlation (). Similarly, Qwen3-VL-235B-A22B-Instruct demonstrates remarkable consistency (). In contrast, Grok 4 shows significant variance (), indicating that despite its high ranking capability, its sample-level scoring is less deterministic.
In conclusion, our cross-validation confirms that the use of Gemini 2.5 Flash as a judge does not introduce same-family bias regarding model rankings. Furthermore, the systematic nature of its scoring behavior, combined with high stability, validates its suitability for the FullFront benchmark.
| Evaluated Model | Human Judge | Gemini 2.5 Flash Judge | Claude 3.7 Sonnet Judge | Grok 4 Judge | Qwen3-VL Judge |
| GPT-5 | 8.50 (R1) | 8.87 (+0.37, R1) | 7.67 (-0.83, R1) | 9.02 (+0.52, R1) | 8.92 (+0.42, R1) |
| Claude 3.7 Sonnet | 8.35 (R2) | 8.73 (+0.39, R2) | 7.51 (-0.84, R2) | 8.97 (+0.63, R2) | 8.83 (+0.49, R2) |
| Gemini 2.5 Flash | 8.23 (R3) | 8.61 (+0.38, R3) | 7.38 (-0.86, R3) | 8.92 (+0.68, R3) | 8.70 (+0.46, R3) |
| GPT-4o | 6.67 (R4) | 6.72 (+0.05, R4) | 5.93 (-0.74, R4) | 8.19 (+1.52, R4) | 7.34 (+0.67, R4) |
| Qwen2.5-VL-72B | 5.96 (R5) | 5.98 (+0.02, R5) | 5.31 (-0.65, R5) | 8.13 (+2.17, R5) | 6.51 (+0.55, R5) |
| InternVL3-78B | 5.49 (R6) | 5.34 (-0.15, R6) | 4.96 (-0.53, R6) | 7.98 (+2.50, R6) | 6.13 (+0.65, R6) |
| Spearman (IRR) | 1.00 | 0.769 | 0.805 | 0.361 | 0.764 |
| ICC (Consistency) | 1.00 | 0.846 | 0.873 | 0.457 | 0.851 |
| Kendall’s (Rank) | 1.00 | 1.000 | 1.000 | 1.000 | 1.000 |
| Judge Model | Avg. Score Std Dev | Inter-Run Correlation |
| Gemini 2.5 Flash | 7.38 0.080 | 0.965 |
| Claude 3.7 Sonnet | 6.46 0.300 | 0.876 |
| Grok 4 | 8.53 1.097 | 0.410 |
| Qwen3-VL-235B-A22B-Instruct | 7.74 0.079 | 0.972 |
Appendix I Sensitivity and Robustness Analysis of the Code Score
| Experiment Condition | Gemini Visual Score | Code Score | CLIP Score | DINOv2 Score |
| (0-10 scale) | (0-1 scale) | (0-1 scale) | (0-1 scale) | |
| Baseline (Original HTML) | 10.00 | 1.00 | 1.00 | 1.00 |
| Exp 1: Valid Alternative | 9.266 | 0.952 | 0.969 | 0.942 |
| Penalty () | -0.734 | -0.048 | -0.031 | -0.058 |
| Exp 2: Broken Implementation | 6.838 | 0.727 | 0.846 | 0.760 |
| Penalty () | -3.162 | -0.273 | -0.154 | -0.240 |
| Punishment Ratio () | 4.31x | 5.73x | 5.02x | 4.17x |
A potential concern regarding the Code Score is its reliance on fixed structural and stylistic weights, which can penalize valid engineering alternatives (e.g., different CSS layout techniques that yield identical visual results). The metric’s model-ranking correlation with human judgment averages across the four subtasks (Appendix F.3), but this does not make it invariant to render-equivalent implementations. We therefore conducted a controlled sensitivity analysis to quantify its tolerance for valid variations versus its sensitivity to substantive defects.
I.1 Experimental Design
We selected a random subset of 50 samples from the ground truth dataset. For each sample, we generated two distinct variants of the code to simulate different implementation qualities:
- •
Experiment 1: Syntactic Variation (Valid Alternative). We refactored the HTML/CSS code using alternative implementation patterns—specifically, swapping layout techniques (e.g., replacing Flexbox with CSS Grid or vice versa) and adjusting nesting structures—while rigorously preserving the original visual appearance. This condition tests the metric’s ability to accept diverse but correct engineering solutions.
- •
Experiment 2: Semantic Violation (Degradation). We introduced structural and content-level errors, such as removing container elements, altering text content, or omitting essential style attributes. These changes were designed to cause significant semantic and visual degradation, representing “broken” implementations.
I.2 Results and Discriminative Power
The results of this analysis are summarized in Table 18. We define the Penalty () as the drop in score compared to the original ground truth (Score = 1.0).
As observed, the Code Score retains a mean score of 0.952 for valid syntactic variations, corresponding to a residual penalty of . In contrast, broken implementations score 0.727 on average, corresponding to a substantially larger penalty of . The valid-alternative penalty is small relative to the broken condition but is not zero and can be comparable to differences between adjacent model point estimates.
To summarize the relative separation, we calculate the Punishment Ratio (), which measures how much more severely a metric penalizes the tested broken implementations than the tested valid variations. Code Score achieves a ratio of 5.73x, compared with 5.02x for CLIP Score and 4.17x for DINOv2 Score. This sensitivity analysis supports using Code Score as a reference-relative structural/content-fidelity signal, while the residual valid-alternative penalty motivates reporting it alongside render-level, executable, and human measures rather than treating it as semantic correctness.
Appendix J Intervention Analysis of Perception–Implementation Decoupling
The observational analysis in Section 5.2 identifies two off-diagonal behaviors: models may perceive the queried relation correctly but implement it incorrectly (), or answer the perception question incorrectly while implementing the original relation correctly (). We conduct two controlled interventions to probe these behaviors without changing the generation prompt, sampling configuration, or requested full-page output.
J.1 Crop-Assisted Evidence Localization
For each selected case, we retain the original full-page screenshot and add an oracle crop containing the region relevant to the QA item. The model is still required to regenerate the entire page, and success is judged only on whether the queried local attribute—such as alignment, width, or relative position—is corrected. The crop therefore supplies localized visual evidence without removing global page context. As shown in Table 19, the queried implementation is corrected in 22 of 28 cases for Qwen2.5-VL-72B-Instruct and 18 of 23 cases for InternVL3-78B. This indicates that evidence localization can mitigate a substantial fraction of the implementation bottleneck for these models.
J.2 Counterfactual Local Edits
For each selected case, we create a counterfactual input by modifying only the queried local relation while leaving the rest of the page unchanged. The edits alter attributes such as width, position, or alignment and are newly constructed for this analysis. We then regenerate the complete page with the same prompt and generation settings. “Not following the edit” means that the target local relation is not implemented; it does not require the remainder of the generated page to be identical to the original output.
Gemini 2.5 Flash returns to the original or a more canonical relation in 18 of 25 cases, while GPT-5 does so in 21 of 31 cases (Table 19). Representative cases illustrate both outcomes. In one case, GPT-5 ignores a subtle downward displacement of a Search button and recreates the canonical aligned input–button pair. In a positive case with a more salient structural change, it correctly follows an upward displacement of the middle feature block. Together, these results show that on the original image is not sufficient evidence of fine-grained grounding. The newly edited inputs weaken an exact-instance memorization explanation, while the frequent return to canonical layouts is consistent with distribution-level layout priors; the experiment does not claim to identify a unique internal mechanism.
| Intervention | Model | Eligible Cases | Target Outcome | Rate |
| QA-relevant crop () | Qwen2.5-VL-72B-Instruct | 28 | 22 corrected | 78.6% |
| QA-relevant crop () | InternVL3-78B | 23 | 18 corrected | 78.3% |
| Counterfactual local edit () | Gemini 2.5 Flash | 25 | 18 edits ignored | 72.0% |
| Counterfactual local edit () | GPT-5 | 31 | 21 edits ignored | 67.7% |
Appendix K Evaluation of Newer Frontier Models
K.1 Setup and Coverage
To assess whether FullFront retains headroom for newer systems, we additionally evaluate GPT-5.5, Claude Opus 4.8, Qwen3.5-122B-A10B, and Qwen3.5-397B-A17B on the same full evaluation sets used by the corresponding main experiments: all 1,800 Perception QA items, 200 Image-to-Code items, and 200 Text-to-Code items. We use the same prompts, rendering environment, and metric definitions as in the original evaluation. The additional evaluation does not include Code Refinement or Interaction Authoring, so conclusions about the four newer models are limited to these five tested settings.
| Model | Perception QA Accuracy | Image-to-Code | Text-to-Code | ||||||||
| Real | Synth. | Multi. | Code | GVS | CLIP | DINOv2 | Code | GVS | CLIP | DINOv2 | |
| Qwen2.5-VL-72B-Instruct | 0.4696 | 0.4950 | 0.4267 | 0.40 | 4.48 | 0.72 | 0.49 | 0.49 | 5.18 | 0.73 | 0.47 |
| InternVL3-78B | 0.4816 | 0.5375 | 0.4600 | 0.42 | 4.47 | 0.73 | 0.53 | 0.50 | 4.91 | 0.72 | 0.44 |
| Claude 3.7 Sonnet | 0.5464 | 0.5325 | 0.4533 | 0.64 | 8.93 | 0.89 | 0.81 | 0.64 | 8.14 | 0.87 | 0.78 |
| GPT-5 | 0.5816 | 0.5775 | 0.5467 | 0.56 | 8.58 | 0.88 | 0.81 | 0.59 | 8.48 | 0.88 | 0.79 |
| Qwen3.5-122B-A10B | 0.5848 | 0.5925 | 0.5667 | 0.55 | 7.46 | 0.84 | 0.73 | 0.57 | 7.25 | 0.82 | 0.69 |
| Qwen3.5-397B-A17B | 0.6280 | 0.6425 | 0.6133 | 0.63 | 8.76 | 0.89 | 0.80 | 0.65 | 8.27 | 0.87 | 0.78 |
| Claude Opus 4.8 | 0.8424 | 0.8625 | 0.8267 | 0.86 | 9.31 | 0.93 | 0.88 | 0.82 | 9.38 | 0.92 | 0.88 |
| GPT-5.5 | 0.8680 | 0.8475 | 0.8533 | 0.83 | 9.56 | 0.95 | 0.91 | 0.76 | 9.12 | 0.92 | 0.86 |
K.2 Headroom Analysis
The newer proprietary models substantially improve on the original systems, confirming that the evaluated QA, Image-to-Code, and Text-to-Code settings are less difficult for the latest frontier generation. Nevertheless, none of the reported metrics reaches its ceiling: the best QA accuracy is 0.8680, the best Code Score is 0.86, and the best Gemini Visual Score is 9.56/10. The newer open models also improve markedly. Qwen3.5-397B-A17B reaches 0.6280/0.6425/0.6133 on Real-world/Synthetic/Multi-window QA and 0.63/0.65 Code Score on Image-to-Code/Text-to-Code, while retaining larger error margins than GPT-5.5 and Claude Opus 4.8. These results show measurable headroom on the tested settings, especially for open models, but should not be extrapolated to the two untested Code Generation subtasks.
K.3 Release Scope
The complete camera-ready release will contain the constructed benchmark data (200 Webpage Design items, 1,800 Perception QA items, and 700 Code Generation items) and retained model outputs under the CC0 1.0 Universal license. The data-construction and evaluation code will be distributed under the MIT License. The project repository is available at https://github.com/Mikivishy/FullFront, and the dataset is hosted at https://huggingface.co/datasets/Mikivis/FullFront. The release documentation will distinguish the full benchmark from FullFront-mini and record task coverage for each evaluated model.
Appendix L Prompts
In this section, we present the specific prompts used in our benchmark, covering both the data curation and evaluation phases.