When relics were made: vigorous stellar rotation and low dark matter content in the massive ultra-compact galaxy GS-9209 at z=4.66
Abstract
JWST uncovered a large number of massive quiescent galaxies (MQGs) at , which theoretical models struggle to reproduce. Explaining the number density of such objects requires extremely high conversion efficiency of baryons into stars in early dark matter halos. Using stellar kinematics, we can investigate the processes shaping the mass assembly histories of MQGs. We present high-resolution JWST/NIRSpec integral field spectroscopy of GS-9209, a massive, compact quiescent galaxy at (, pc). Full spectral fitting of the spatially resolved stellar continuum reveals a clear rotational pattern, yielding a spin parameter of . This study suggests that at least a fraction of the earliest quiescent galaxies were fast rotators and that quenching was a dynamically gentle process, preserving the stellar disc even in highly compact objects. Using Jeans anisotropic modelling and assuming a NFW profile, we measure a dark matter fraction of . Our findings use stellar kinematics to confirm the massive nature of early quiescent galaxies, previously inferred from stellar population modelling. We suggest that GS-9209 has a similar structure to low-redshift ‘relic’ galaxies. However, unlike relic galaxies which have bottom-heavy initial mass functions (IMF), the dynamically inferred stellar mass-to-light ratio of GS-9209 is consistent with a Milky-Way like IMF. The kinematical properties of GS-9209 are different from those of early-type galaxies and more similar to those of recently quenched post-starburst galaxies at .
Keywords:
galaxies: evolution – galaxies: formation – galaxies: kinematics and dynamics – galaxies: structure1 Introduction
Galaxies’ star-formation histories (SFH) and observed stellar populations are fundamental to our understanding of galaxy evolution. The star formation activity of a galaxy is closely related to its morphology (Brennan et al., 2017; Dimauro et al., 2022, as it was revealed by studies on galaxies e.g.,). A further link exists between galactic morphologies and kinematics with the classical paradigm splitting the galaxies population into rotationally supported flattened discs and dispersion-supported spheroids (Emsellem et al., 2007; Emsellem et al., 2011; van de Sande et al., 2018; Graham et al., 2018; Thob et al., 2019). Such classifications seem to be valid up to a redshift of (Brennan et al., 2017, e.g.,) but it is unclear whether they hold true for higher- galaxies (Abraham, 1999).
The question of how different types of galaxies are born, evolve, and end up being “red and dead” has been central in our quest to understand galactic evolution. Since the star-formation rate (SFR) is a key property of any galaxy, it goes without saying that quenching also has a dramatic impact on the evolution of both individual systems and the galaxy population as a whole. There is a wide variety of quenching mechanisms at play, depending on galaxy’s stellar mass, kinematics and on its environment (Man and Belli, 2018; Bluck et al., 2020; Bluck and others, 2020; Cortese et al., 2021). A few examples include: removal of cold molecular gas via outflows driven by active galactic nuclei (AGN, e.g. Fluetsch and others 2019; Veilleux and others 2020), ram pressure stripping (the main mechanism in the case of low-mass galaxies, Gunn and Gott 1972) or strangulation in the case of more massive galaxies (a complete halt of the galaxy’s pristine gas inflows, Peng and others 2015). The latter is often the result of the halo heating due to supermassive black hole (SMBH) feedback (Silk and Rees, 1998; Bower and others, 2006; Croton and others, 2006; Lagos et al., 2008; Brownson and others, 2019) but the gas might also get heated when falling into the dark matter halos’ gravitational potential (virial shock heating, White and Rees 1978; Kereš et al. 2005; Dekel and Birnboim 2006). Star formation quenching is an important process in the evolution of galaxies, having a crucial effect on their subsequent morphologies. Furthermore, there is a strong correlation between a galaxy’s average stellar population age and its morphology (Blanton and Moustakas, 2009; Somerville and Davé, 2015) or kinematics (Croom et al., 2024).
Since the launch of James Webb Space Telescope (Gardner et al., 2023; Rigby et al., 2023, JWST;) the sample of high-z massive quiescent galaxies (MQGs) has seen a dramatic increase in the number of studies on confirmed spectroscopic candidates in the redshift range (Carnall et al., 2023a; Carnall et al., 2023b; Carnall et al., 2024; Valentino et al., 2023; de Graaff et al., 2024; D’Eugenio et al., 2024; Nanayakkara et al., 2024; Pérez-González et al., 2025; Setton et al., 2024; Baker et al., 2025a) even going as early as (Weibel et al., 2025). These observations imply much higher number densities of massive quiescent galaxies compared with the predictions from numerical simulations or semi-analytic models (e.g. TNG300 - Hartley et al. 2023, Magneticum Pathfinder - Kimmig et al. 2025, FLARES - Lovell et al. 2023, SHARK v2.0 - Lagos et al. 2024, FLAMINGO - Baker et al. 2025a, L-Galaxies - Vani et al. 2025). Lagos et al. (2025) analysed six large cosmological simulations (3 semi-analytic models GAEA, GALFORM and SHARK and 3 full hydro-dynamical simulations: SIMBA, EAGLE and IllustrisTNG) and showed that these simulations predict that the number densities of MQGs (, sSFR < 0.1 ) are smaller than measured from JWST observations, the difference ranging from 1.5 to 3 dex depending on the simulation. Furthermore, it was demonstrated that the simulations are unable to reproduce the observed stellar mass functions of quiescent galaxies at , as demonstrated by Baker et al. (2025b).
Even more puzzlingly, high redshift MQGs appear to have assembled large stellar masses () during intense star formation episodes (up to or more, Forrest et al. 2020) and then quench extremely rapidly in comparison to their local counterparts (Thomas et al., 2010; McDermid et al., 2015). Many observational studies have focused on the SFHs of these galaxies, but the processes governing their mass assembly history and quenching remain covered in mystery. MQGs pose at least three major challenges for current models of galaxy formation and evolution, resulting from: 1) their unexpected high number densities at high redshift (e.g. Carnall et al. 2023b; Valentino et al. 2023; Alberts et al. 2024; Long et al. 2024; Zhang et al. 2025), 2) their high stellar mass (possibly related to the high efficiency of baryon conversion into stars in high redshift massive halos, e.g. Dekel et al. 2023) and 3) the rapid quenching mechanism. Within the standard paradigm of galaxy formation, the star formation and quenching timescales of massive quiescent galaxies imply the existence of impossibly massive halos at early times (e.g. Glazebrook et al. 2024; Turner et al. 2025; Weibel et al. 2025).
Continued star formation from the available cold gas would be more problematic, giving rise to impossibly massive galaxies, which would be inconsistent with both observations (Bower et al., 2012; Harrison et al., 2018) and with the low redshift stellar mass function extrapolation (McLeod et al., 2021). Therefore, another issue to be discussed is the fast quenching timescale of high- MQGs given the early stage of the Universe when dark matter halos are accreting gas at extremely high rates (Tacchella et al., 2018). These conditions point towards the possible responsible quenching mechanism being AGN ejective feedback (Silk and Rees, 1998; Di Matteo et al., 2005; Maiolino et al., 2012; Belli et al., 2024; Xie et al., 2024; Lim et al., 2025) as significantly more violent and more rapid than other quenching mechanisms (Tacchella et al., 2022). In fact, about 50% of MQGs at are AGN hosts (Bugiani et al., 2025; Baker et al., 2025a). Furthermore, these claims of AGN feedback being responsible for quenching high-z MQGs are backed-up by theoretical studies such as Piotrowska et al. (2022) or Lagos et al. (2025). Other theoretical works discuss possible alternative processes leading to a rapid gas consumption in MQGs, such as violent disc instabilities or feedback free star formation (Dekel et al., 2023; Vani et al., 2025).
Indeed, many previous studies on MQGs show them to have low amounts of cold gas, the fuel star formation (Belli et al., 2021; Whitaker et al., 2021; Williams et al., 2021; Woodrum et al., 2022; Scholtz et al., 2024, ; e.g.,). However, other studies confirm the presence of non-negligible cold molecular gas reservoir that MQGs are unable to use for star formation. This is seen at various redshifts: (Rowlands et al., 2015) and (Bezanson et al., 2022). The latter study reveals the extremely short cold gas depletion timescales ( Myr) of recently quenched galaxies, interpreting this result as a possible evidence of AGN feedback. These studies highlight the contrast between the population of old quiescent galaxies and the ones who stopped forming stars more recently (post-starburst galaxies, PSBs). A similar classification of high redshift MQGs has emerged from studies of their star formation histories (Park et al., 2024). In contrast to PSBs, the cold gas fractions of galaxies quenched long before the observation time ( Gyr) is more difficult to interpret. Using a sample of MQGs, Woodrum et al. (2022) find evidence for post-quenching rejuvenation effects driven by gas-rich minor mergers. However, Suess et al. (2023) found that the less massive, but more highly star-forming satellites of MQGs, although they do not necessarily bring substantial amounts of cold gas, they can contribute (via minor mergers) to up to of the central galaxies stellar mass.
In this paper, we present high-resolution NIRSpec integral-field-unit (IFU) observations of the massive quenched galaxy GS-9209 at redshift , whose SFH and various structural and morphological properties (size, central BH, AGN properties, stellar and dust SED) have been studied in depth in Carnall et al. (2023b) and Ji et al. (2024a). With the unique ability of NIRSpec/IFU to provide both complete spatial and spectral information, we focus here on the kinematical and dynamical characterisation of this MQG. This is the earliest quiescent system for which an IFU study is conducted (revealing an ordered rotational pattern in , the first moment of the line-of-sight velocity distribution). Integral-field spectroscopy is necessary because it can distinguish between the types of AGN feedback that played a major role in quenching GS-9209: ejective feedback (expelling much of the cold gas out into the CGM before it gets the chance of collapsing into stars, e.g. Hopkins et al. 2008; Feruglio et al. 2010; Maiolino et al. 2012) vs preventative feedback (which does not allow new cold gas to be accreted by the galaxy usually due to halo heating, e.g., Bower and others 2006; Brownson and others 2019). A possible kinematic parameter that can potentially give us insights about the type of AGN feedback in a galaxy’s history is , the ratio between ordered stellar rotation and random motions, within the half-light radius (). In the case of high redshift star-forming discs we have that (Förster Schreiber and Wuyts, 2020). Galaxies that show a disc-like rotational kinematic pattern in but which have, in the same time, values lower than 1 could potentially indicate a violent, ejective AGN feedback in galaxy’s history whereas are more likely to be associated with a gentle mode of AGN feedback (preventative).
This paper is structured as follows: in Section 2, we discuss the general data analysis and data reduction pipeline, outlining the pre-processing that we have done on raw data before using it in our analysis. Section 3 discusses the computational and mathematical tools that we have used to analyse the photometry data and perform Multi-Gaussian expansion (MGE) parametrisation, as well as spectrum fitting and Voronoi binning, vital in deriving the subsequent resolved kinematics maps. In Section 4, we dedicate separate subsections to various important key results that highlight different properties of GS-9209. We discuss the implications for galaxy formation and evolution models and compare our results with those from independent observations in Section 5. Our findings are summarised in Section 6, where we also give possible directions where further research might give precious insights. Throughout this paper, we adopt a flat universe cosmology with matter density parameter , Hubble Constant as in Planck Collaboration (2020). We use the AB magnitude system.
2 Data
The data we use were obtained as part of the JWST Cycle 2 Program ID 3659 (PI: Francesco D’Eugenio). This is a NIRSpec (Jakobsen et al., 2022) IFU programme (Böker et al., 2022) and the observations use the high-resolution () disperser / filter combinations G235H / F170LP and G395H / F290LP. In this work we focus on G235H / F170LP, which was integrated for 14.7 hours, using 18 dithered observations in a 9-point medium-sized cycling pattern (repeated twice). Each dither consisted of 20 groups per integration and two integrations, using the NRSIRS2 readout mode (Rauscher et al., 2017). The medium-size dither pattern gives an effective field of view (FoV) of our particular observation of spaxels with a resolution of per spaxel. The NIRSpec FoV is displayed in Fig. 1 (dotted rectangle), superimposed to a false-colour NIRCam image. At the redshift of our target, we probe a rest-frame wavelength range with the detector gap between and (rest-frame wavelengths; see Fig. 2).
2.1 Data reduction and background subtraction
We used the publicly available jwst data reduction pipeline v1.12.5, with calibration files from the context file 1193. The standard pipeline was complemented by customized methods for snowball flagging, pink-noise correction and outlier detection, as described in Perna et al. (2023).

2.1.1 Source Detection
We used the package sep11 1 Available at https://sep.readthedocs.io/en/v1.1.x/ (Source Extraction and Photometry Python library). This first normalises the original image and subtracts a crude estimate for the background (sep.Background) and then extracts the sources based on a lower detection threshold value of 3 for the signal-to-noise ratio (S/N). The output of this procedure is a binary mask that can be used across multiple wavelengths from the data-cube. We chose to make a combined mask that reunites the individual masks produced at the wavelengths corresponding to the NIRCam F200W filter (because we will do further photometric analyses in this bandpass) and to the [O iii] emission.
In our case, since we have an extended source, we use the function find_galaxy from the MgeFit package22 2 Version 6.0.4, available at https://pypi.org/project/mgefit/ (Cappellari 2002) which provides us with approximate values for the galaxy’s centre position, ellipticity and major axis. We are only interested in the major axis value because we select this as the size of the mask that we are using (). This is in agreement with the value where the light from the radial profiles of the galaxy becomes negligible.
2.1.2 Background Subtraction
For the background subtraction, we use our own robust pipeline. First, the algorithm does a slice-by-slice background subtraction (these are wavelength slices) for each spaxel, using the function Background2D from photutils33 3 We used version 2.0.1, but the most recent one is available at https://photutils.readthedocs.io/en/stable/(Bradley et al., 2024). Together with the areas of the galaxy itself (identified using the method described in Section 2.1.1), the spaxels with non-valid entries (NaN) are also masked for a given wavelength slice. We use MedianBackground from photutils as a background estimator, together with a clipper (SigmaClip from astropy; Astropy Collaboration et al. 2022) that improves the robustness of the background level calculations and reduces the possibility of contamination from bright spaxels. There are also some wavelength slices for which this background subtraction procedure fails (often because of either excessive masking or due to issues with the slice itself e.g. being within the wavelength range of the detector gap). In these cases, our pipeline handles such slices by doing an interpolation based on neighbouring “good” slices.
2.1.3 Outliers Removal
We use the outlier-detection algorithm of D’Eugenio et al. (2024), but even after this step, some low-level artefacts remain. To remove them, we first mask any invalid values, then apply a median filter to smooth the spectrum, and clip any outliers. The resulting “double-cleaned” spectrum is shown in Fig. 2, where we extracted the spectrum from a square aperture centred on the brightest spaxel of the cube median image. This image was obtained by taking the median flux value at each spaxel across all valid wavelength slices and spans approximately . The chosen aperture (illustrated in Fig. 1) is approximately the largest extent over which we can probe spatially resolved kinematics.
3 Methods
3.1 Photometry Analysis and Morphology Modelling
For kinematical calculations, we need an accurate model of the galaxy’s surface brightness profile. Our approach requires Multi-Gaussian Expansion of the light profile (Emsellem et al., 1994; Cappellari, 2002, MGE;). Since GS-9209 is highly compact (Carnall et al., 2023b), we follow the methods of van Houdt et al. (2021); we first use a Sérsic model, taking advantage of its small number of free parameters (Section 3.1.1), and then re-parametrize this best-fit model using MGE (Section 3.1.2).
3.1.1 Photometry Modelling with PySersic

| Parameter | Value |
|---|---|
| observed ellipticity | |
| Sérsic index | |
| (arcsec) | |
| (deg) |
To determine our fiducial Sérsic profile, we used the PySersic44 4 version 0.1.5; https://github.com/pysersic/pysersic Bayesian fitting tool for galaxy photometry (Pasha and Miller, 2023). We fit the galaxy image in the NIRCam F200W band and we use the empirical NIRCam ePSF from Ji et al. (2024c) for this filter. The imaging data was obtained as part of JADES (Eisenstein et al., 2023, JWST Advanced Deep Extragalactic Survey;), processed as described in Rieke et al. (2023); Eisenstein et al. (2025); D’Eugenio et al. (2025). We show our results from PySersic fitting in Fig. 3; we will construct all our subsequent analysis based on the median values of the posterior distributions of the parameters of the model profile (given in Table 1).
In our analysis, we fit the background-subtracted NIRCam galaxy image to a Sérsic profile (Sersic, 1968). The noise maps required as inputs for PySersic are taken from the background-removed photometry data. In order to evaluate the quality of the models, we have chosen the Student’s loss function which is to be minimised by the fitting algorithm. For estimating the posterior distribution, we compare both of the methods currently implemented into PySersic: Laplace method and SVI (stochastic variational inference) flow. The first method initially finds the Maximum A Posteriori (MAP) values of the parameters and assumes Gaussian posterior distributions around the MAP, whereas in the second (which we choose as fiducial), a normalised flow is trained to estimate the posterior distributions. We find that none of the results of our analysis depends on the method chosen; these results are consistent with each other, within their associated uncertainties (given in Tables 1 in the main text and 3 in Appendix A). The calculated effective radius is in agreement with the value obtained by Carnall et al. (2023b), but our Sérsic index is somewhat larger than the literature value (). For the next step, we used the median values of the posterior distributions from the PySersic fit – SVI method – in order to obtain the model image, de-convolved from the empirical PSF of the original F200W image. We also oversample by a factor of 10 with respect to the original image.
3.1.2 Multi-Gaussian Expansion (MGE) Fitting of Photometry
We perform a MGE fitting of the PSF de-convolved model image from PySersic. We used the mge_fit_1d procedure within the MgeFit package (Cappellari, 2002). This procedure gives an approximation of the one-dimensional radial surface brightness profile (with a MGE re-parametrisation) of the model image. Because the latter is, by construction, a purely Sérsic model, the surface brightness profile is given by (Ciotti and Bertin, 1999):
| (1) |
In our case, since our procedure fits a normalised image (), we will need to convert to real physical units after doing the fit. We can obtain using the equation 4 from Ciotti and Bertin (1999). In that equation, for n=2.97 (equation 18 from the same paper) and for n=2.97 (equation 7). With pixels on the oversampled image, we get normalised arbitrary units per .
Each Gaussian j has three parameters:
- •
The peak flux given by the MgeFit. This is measured in arbitrary units (relative to the normalised total luminosity) per pixel.
- •
The dispersion of the 2-dimensional Gaussian along the major axis, in pixels.
- •
The observed axial ratio of the 2-dimensional Gaussian, following the notation of Cappellari (2008). In the mge_fit_1d fitting procedure, this is not given as an output of the fit. We assume that all of the 2-dimensional Gaussians have a fixed observed axial ratio , the value given by the PySersic photometry fitting tool.
GS-9209 has an apparent F200W band AB magnitude of . At the source redshift z = 4.658, this corresponds to an absolute magnitude at a rest frame wavelength . The pivot wavelength of the F200W bandpass is and the absolute magnitude of the Sun in the SDSS_u bandpass (with a pivot wavelength of , close to the rest frame wavelength that we are probing in the case of GS-9209) is (Willmer, 2018). This means that the absolute luminosity of GS-9209 (at rest-frame wavelength of ) is . We then need to convert the integrated flux values that we have for our Gaussians, to surface brightness values, that we will use in our Jeans Anisotropic Modelling (JAM) algorithm. This is done using the following equation (Cappellari, 2002; Cappellari, 2008):
| (2) |
3.2 Spectrum Fitting with ppxf
To measure the stellar kinematics, we use the ppxf55 5 We used version 9.4.1; the software is available from https://pypi.org/project/ppxf/ software, an efficient full spectral fitting algorithm (Cappellari and Emsellem, 2004; Cappellari, 2017; Cappellari, 2023). ppxf is able to simultaneously fit both the stellar continuum and gas emission lines so one can extract the kinematics of multiple components (Westfall et al., 2019; Belfiore et al., 2019, e.g.,). The algorithm constructs a model of the galaxy as a linear combination of individual spectral templates, convolved with the line-of-sight velocity distribution (LOSVD).
In our work, we used templates built using FSPS v 3.2 (Conroy and others, 2009; Conroy and Gunn, 2010), with the MILES stellar library for the optical region (Sánchez-Blázquez and others, 2006; Falcón-Barroso and others, 2011) and with the MIST isochrones (Choi et al., 2016). We adopted a Salpeter (1955) initial mass function (IMF), but this choice has no impact on the derived stellar kinematics. This is because for the stellar-population age of the target ( Myr; Carnall et al. 2023b) and spectral range of our data we do not track a wide enough variety of IMF-sensitive features. In order to determine the IMF characterising GS-9209, we need to use the ratio result from the JAM dynamical modelling (Section 4.2).
The stellar spectral templates have an instrumental resolution with constant full-width at half maximum (FWHM) (Falcón-Barroso and others, 2011). For comparison, the average rest-frame instrumental resolution that we have for the galaxy spectra observations is with and . Since the resolution of the data is better than the resolution of the templates, we need to correct the derived stellar dispersion using the following equation (adapted from equation 5 from Cappellari 2017):
| (3) |
where , the velocity dispersion indicated by the ppxf algorithm, is not the same as the intrinsic (but not de-projected yet) velocity dispersion, . We need to correct for the Gaussian dispersions of the line spread functions of the instrument observing the galaxy () and of the stellar templates that we used in our analysis (). In order to convert from to or from to we use the general formula (valid for both cases):
| (4) |
where “j” = either “templ” or “instr” and is the median wavelength of our range. To confirm the accuracy of our methods, we repeated our analysis by using stellar templates from a higher-resolution library66 6 These templates are available from the authors C. Conroy upon reasonable request.() which uses the C3K model atmospheres (Conroy et al., 2019) instead of MILES. The results did not differ by more than a few percent compared to our original method (e.g. for the spectrum in Fig. 2 using MILES stellar spectra, we obtained compared to when using C3K). This is in good agreement with the value obtained by Carnall et al. (2023b, using medium-resolution spectroscopy) for the stellar dispersion .
3.3 Voronoi Bins Analysis
The purpose of the Voronoi binning algorithm is to perform a 2-dimensional re-binning of our spectral data to achieve a minimum S/N threshold. We create S/N maps for all the spaxels using the median-filtered signal across the wavelength slices for which . As can be seen from Fig. 2 this represents the flattest region of the spectrum, so the computed S/N is not affected too much by the presence of absorption/emission lines or by the slope of the continuum. We mask all the noise dominated spaxels with . We used the VorBin77 7 We used version 3.1.5, available from https://pypi.org/project/vorbin/ package (Cappellari and Copin, 2003). We set a threshold S/N target for our Voronoi bins.
For each Voronoi bin, we obtain the spectrum as the sum of the spectra of the pixels contained within that bin. The spectrum for each Voronoi bin has been further processed as follows:
- •
In the case of each spectrum, the non-valid values and the outliers were masked. This creates the “cleaned” Voronoi bin spectrum, which is then smoothed using a median filter. The smoothed spectrum is not brought forward into our analysis but it is used only to identify and mask bad spectral pixels.
- •
We log-rebin each “cleaned” spectrum to a velocity scale 50 (here represents the number of wavelength slices) and run an initial ppxf fit. We impose constraints on the ages and metallicities ranges of the templates to be used: age 1.3 Gyr (the age of the Universe at ) and . The purpose of allowing high-metallicity templates is to capture the effect of -elements enrichment (Beverage et al., 2021; Beverage et al., 2023; Carnall et al., 2024, e.g.,). The goal of this initial ppxf run on the cleaned spectra is to reduce the numbers of stellar templates that we use. We determine the stellar templates (in this first run of the ppxf fit) for which the light weights are positive. These stellar templates will be used in the second fit (the gas templates remain unchanged).
- •
We then run a second ppxf fit on the “cleaned” Voronoi bin spectra and the results of this fit are used for further analysis, specifically the stellar kinematic values , the stellar rotational velocity, and , the stellar velocity dispersion returned by ppxf, together with the uncertainties in each of these parameters. We use equation 3 in order to take into account the difference between the stellar velocity dispersion returned by ppxf and the value corrected for instrument and templates line widths.
Using the intrinsic velocity dispersion (obtained after applying the correction from Equation 3) we build our map that is required for our subsequent JAM Dynamical Modelling (Section 4.2). Here .
4 Results
4.1 Spatially Resolved Kinematics Maps of GS-9209

The results of our stellar kinematics analysis are shown in Fig. 4. The image on the left side shows that the stars in this galaxy have substantial angular momentum around the galaxy centre. The image on the right side shows a decrease of the stellar velocity dispersion from the galaxy centre to its outskirts. With our kinematics data alone, it is difficult to disentangle between beam smearing effects and the plausible explanation of this structure being related to the presence of a dispersion dominated central bulge. This information can be revealed if we combine spatially resolved kinematics data and resolved stellar population ages maps. The key point of this analysis is that the disc-like kinematics is still preserved after the quenching took place. Hence it turns out that galaxies may first stop forming stars (and quench inside-out) but preserve their disc-like kinematics for another time interval before other dynamical processes may come into play and transform them into the slowly rotating spheroids and early-type galaxies (ETGs) that we observe at .
4.2 JAM Dynamical Modelling

| Parameter | Value | Model |
|---|---|---|
| Fiducial | ||
| Fiducial | ||
| Fiducial | ||
| Fiducial | ||
| imposed prior | Fiducial |
Jeans Anisotropic Modelling is a robust method that is suitable for a plethora of galaxies dynamical modelling tasks including estimating the galaxies dark matter content (van de Ven et al., 2010; Barnabè et al., 2012; Comerón et al., 2023), computing central supermassive black holes masses (Drehmer et al., 2015; Feldmeier-Krause et al., 2017; Comerón et al., 2023) or determining dynamical masses to high accuracy (van der Marel and van Dokkum, 2007; Cappellari et al., 2009; van Houdt et al., 2021; Zhu et al., 2023; Cappellari, 2023). The better performance and accuracy of JAM has been tested and acknowledged against other techniques such as the more generalised Schwarzschild dynamical models (Schwarzschild, 1979). Such tests were done using either simulated data (Jin et al., 2019) or real data (Leung et al., 2018). These tests revealed the ability of this method to accurately produce a robust dynamical model for a wide variety of input kinematics data. In our study, we use the JamPy package88 8 version 8.0.0, available at https://pypi.org/project/jampy.
To calculate the posterior probability distributions on the model parameters, we use the Adaptive Metropolis algorithm (Metropolis et al., 1953) as implemented within the adamet package99 9 version 2.0.9 available from https://pypi.org/project/adamet/ (Cappellari et al., 2013). We repeated our analysis using the Markov-Chain Monte-Carlo sampling alogirthm emcee (Goodman and Weare, 2010; Foreman-Mackey et al., 2013) and we concluded the results obtained were statistically consistent but that adamet algorithm had a better time efficiency by a factor of .
Our JAM dynamical models rely on the assumption that our galaxy is axisymmetric and furthermore that there is no spatial variation of the ratio or of the radial anisotropy parameter (Lablanche et al., 2012). This assumption is motivated by the findings of Suess et al. (2021) who report that massive PSB galaxies at typically have flat colour gradients. The outputs from the MGE fitting of the F200W photometry (surface brightness, dispersions along the major axis and observed axial ratios of the Gaussians) are given as inputs for the light map of JAM. The choice of F200W band to construct these flux maps is justified because in this way, we capture the stellar light at rest-frame wavelengths near the Balmer break () primarily coming from type A-stars dominating the spectrum of GS-9209. Furthermore, at these wavelengths, we avoid possible contamination from faint AGN that might be present at lower rest-frame wavelengths.
The coordinates of the Voronoi bins that we pass onto JAM were rotated such that the major axis of the galaxy is parallel to the horizontal axis of the new coordinate system. This means that we need to rotate our and counter-clockwise by an angle of (the best-fit position angle retrieved by the pafit algorithm1010 10 version 2.0.8 available from https://pypi.org/project/pafit/). This value agrees to within with the negative of the position angle measured clock-wise from the image X-axis. i.e. where is the astronomical PA measured by PySersic from North (the Y axis) counter-clockwise, suggesting a very good alignment of the kinematic axis to the morphological major axis. Our JAM dynamical modelling algorithm further requires the size of the PSF as an additional input. We assume a 2-dimensional Gaussian PSF of circular shape i.e. with the same FWHM in both the direction of the NIRSpec/IFU slicers and perpendicular to them. The NIRSpec PSF size that we give as an input to JAM is the geometrical average between the values given by the equations 3 and 4 from D’Eugenio et al. (2024) adopting a typical wavelength of (because our photometry analysis was based on NIRCam F200W data). In our case, this average value is .
All the dynamical models that we build assume a cylindrically aligned framework of the velocity ellipsoid (Cappellari, 2008). Our fiducial dynamical model assumes a Navarro-Frenk-White (NFW; Navarro et al. 1996) density profile for the dark matter halo and a Gaussian probability prior on the logarithm of the central BH mass (with the mean being and a standard deviation of 0.3). The choice for the mean and the standard deviation of this Gaussian prior is motivated by the results from the broad line component of fit obtained by Carnall et al. (2023b). The reason for imposing a prior on the central BH mass is because our spatial resolution of is about 6.5 times larger than the radius of the black hole’s sphere of influence (assuming the mass obtained by Carnall et al. 2023b). This is discussed in Appendix B and illustrated in Fig. 9 where we present our Alternative-1 Black-Hole-Mass-Follows-Light (BH+MFL) model used to infer the central BH mass, which was allowed to be fit freely by the JAM algorithm. The other parameters of Alternative-1 the dynamical model (reported in Table 4) agree within uncertainties with the values obtained from our Fiducial dynamical model (the latter were reported in Table 2).
We obtain a stellar mass for this galaxy of from our Fiducial dynamical model. This value is consistent within with the value of estimated by Carnall et al. (2023b) from stellar population modelling. In any case, we can see from e.g. figure 1 of Duan et al. (2024) that this galaxy is at least more massive than the median of the redshift range .
In our fiducial dynamical model, the dark matter density profile is assumed to be classical NFW (with the small radius slope ) satisfying the equation (Navarro et al., 1996; Wyithe et al., 2001):
| (5) |
is the break radius of the dark matter (DM) Halo in which GS-9209 resides. Using the stellar mass halo mass (SMHM) relation results from the figure 7 of Behroozi et al. (2013), we deduce that the halo of GS-9209 has a mass of . Then we determine the virial radius of our DM Halo, from:
| (6) |
In this equation, we assume that the density contrast is . Doing the calculation we obtain kpc. Next we estimate the concentration parameter from figure 5 of Klypin et al. (2011). We obtain a value of which gives kpc. This is the reason for which we have chosen to fix this break radius in our calculations to 15 kpc ( at this redshift) in our JAM dynamical modelling algorithm. In a similar way to the method illustrated in Section 3.1.2, we fit this NFW profile to obtain the MGE Gaussians for the Dark Matter component. Subsequently, the one-dimensional MGE best-fit of the dark matter halo density profile and the MGE fit of the stellar component light profile (constructed in Section 3.1.2) are combined.
The dynamical model is used to determine a number of parameters that define either the morphology or the structure of this galaxy:
- •
, the intrinsic axial ratio. Combined with the observed axial ratio, this will give us the inclination angle of the galaxy with respect to the line-of-sight. The latter is crucial in computing the de-projected values of various kinematic parameters (Section 4.4).
- •
, the radial anisotropy of the velocity ellipsoid (cylindrically aligned). This is also used in de-projection calculations.
- •
, the stellar mass to light ratio.
Because is independent of the tangential anisotropy (see the discussion in Section 3.1.5 of Cappellari 2008), we need to test another dynamical model Alternative-2 in order to determine the tangential anisotropy (this parameter is required for subsequent de-projection calculations). We fit the first order velocity moment along the line-of-sight i.e. the spatially resolved map from the left panel of Fig. 4 with the JAM keyword input moment=‘z’. In this model, we again assume a classic NFW DM halo density profile and Gaussian priors on each of the parameters , , , and . The means and the standard deviations of their Gaussian priors are taken as the best-fit and the uncertainty estimates produced as outputs of Fiducial dynamical model (Table 2). We introduce the new parameter to be fitted by the JAM algorithm. We impose an informative Gaussian prior on this parameter with a mean of 1 and a standard deviation of 0.2 as motivated by the second panel of figure 2 from Cappellari et al. (2007). The outcome posterior distributions of this model are shown in Fig. 10 in Appendix C. We are thus able to put a tight constraint .
4.3 Dynamical Mass of GS-9209
We compute the total dynamical mass of this galaxy using equation 7 from van der Wel et al. (2022) (assuming that our galaxy behaves kinematically similar to a disc; this is justified by the rotation pattern that we can see in spatially resolved map; Fig. 4):
| (7) |
We use the same parametrisations as in van der Wel et al. (2022); this parametrisation assumes that the total dynamical mass is two times larger than the mass predicted by JAM dynamical modelling within the half light radius: . In this equation, is given by eq. (20) of Cappellari et al. (2006). This correction factor depends on the Sérsic index (we adopt a value following the results of the PySersic photometric fitting and given in Table 1) whereas depends on the observed axial ratio, for which we take with also taken from the PySersic fitting results (Table 1). From the PySersic photometry fitting, we have that . This uncertainty is propagated from the PySersic fitting and is not our actual error for . We estimate the latter to be around , taking into account the systematic uncertainties. For the stellar velocity dispersion, we take to be the non de-projected value that we obtained from the ppxf full spectrum fitting i.e. (Section 3.2).
Using these values, we obtain . The quoted uncertainties are dominated by systematics such as the calibration uncertainty of the virial estimator scaling relation. Overall, this result is consistent (within the uncertainties) with the stellar masses that we have found using our Fiducial dynamical model ( = 10.52). A considerably more robust method of computing the dynamical mass was proposed in Section 5.2 of Cappellari (2023) and relies on the use of jam_axi_sersic_mass procedure which has a number of important advantages such as allowing us to pass as inputs the size of the PSF and our custom rectangular aperture () that we used to produce the spectrum in Fig. 2. Furthermore, the method takes into account the effects of inclination and radial anisotropy when predicting the dynamical mass of the Sérsic model of our galaxy. With , and the values for and mentioned above, we obtain a remarkably similar value: . Our result is consistent with the fact the target has a relatively low dark matter fraction, as inferred from our fiducial dynamical model (Fig. 5), with the total density of this galaxy being close to its stellar density.
4.4 Quantitative Analysis of the Galaxy’s Kinematics
To allow for a better comparison with the observationally retrieved kinematics parameters of other galaxy samples from the literature or with the characteristics of galaxies in numerical simulations, we must compute some quantities that numerically quantify the rotational pattern observed in this galaxy and the net contribution of rotation itself to the total kinetic energy budget of the galaxy. These are:
- •
the ratio of between stellar rotational velocity and velocity dispersion.
- •
the spin parameter of our galaxy, calculated using all the bins available within a projected distance of from the galaxy’s centre. The reason for choosing an aperture of instead of the conventional is because of the fact that we only have one Voronoi bin within the latter aperture. We adopt the effective radius and the galaxy’s centre position that were determined by PySersic.
- •
. This is the fraction of kinetic energy that goes into ordered stellar rotation (defined in the same way as in Sales et al. 2012).
4.4.1 Inclination Angle; De-projection calculations
The intrinsic (de-projected) axial ratio of the galaxy, , is a free parameter that our JAM algorithm provides a best-fit for. In the Fiducial model (which is more robust compared to the BH-MFL one in Appendix B), JAM predicts a value (Table 2), although the data do not provide tight constraints, since the posterior probability distribution is consistent with the upper limit set by the priors (Fig. 5). In order to test the robustness of this estimate, we conduct a further dynamical model test Alternative-3. In this model, we use the same setup as in the Fiducial model but this time we put an additional Gaussian prior on with a mean of 0.41 and a standard deviation of 0.18. The choice for these values is motivated by the study of van Houdt et al. (2021) on a sample of massive galaxies from the LEGA-C survey (van der Wel et al., 2016). While these values apply to a sample of galaxies at , there are currently no similarly large spectroscopic surveys of quiescent galaxies at much higher redshifts than this LEGA-C sample. As given in Table 6 the Alternative-3 dynamical model gives and it has a higher reduced than the Fiducial dynamical model. Since is significantly closer to retrieved by the fiducial model than to the mean of the prior imposed on this parameter within the Alternative-3 dynamical model, it means that we can trust the reliability of our data to determine the true value of the intrinsic axial ratio of GS-9209. Hence we assume in our subsequent calculations. This value agrees with the median axial ratio found by Kawinwanichakij et al. (2025) for a sample of 17 massive quiescent galaxies at (originally from Nanayakkara et al. 2025).
The equation that relates the observed axial ratio, the intrinsic axial ratio and the inclination of our line-of-sight compared to the galaxy axis of symmetry is the equation 14 from Cappellari (2008). Re-arranging the terms, we have:
| (8) |
We obtain an inclination angle of ( would correspond to a face-on view). The inclination angle that we obtain for GS-9209 is surprisingly (although not physically impossibly) high. We should keep in mind the fact that this galaxy exhibits line emission from the AGN broad-line region (Carnall et al., 2023b, BLR;). There have been several studies about BLRs, Type-1 AGN and Seyfert-1 galaxies from a geometrical perspective (Zhang and Wu, 2002; Decarli et al., 2011; Kuhn et al., 2024). The general consensus is that the maximum half-opening angle of the cone of BLR emission is somewhere in the region which means that, in our case, the detection of broad line emission in GS-9209 implies that the inclination angle should (conservatively) be below . Given the inclination angle value of for GS-9209, it means that the line-of-sight is only barely inside the BLR emission cone. Although the distribution of the inclination angles for general BLRs is peaked at around if we assume thin disc shapes (Decarli et al., 2011), there have been studies which reported an inclination angle close to the cone half opening angle and also close to about (e.g. Bentz et al. 2022). In other cases, the inclination angles of the galactic disc and the inclination angle of the BLR are widely different but broad line emission is still detected (e.g. sources MCG +04–22–042, Mrk 1392 or Zw ; Du et al. 2025).
4.4.2
We adopt the following method for determining . We consider a set of points located on the major axis of the galaxy (in the rotated coordinate system in which the major axis is in the horizontal direction). Therefore, we select this set of points in the projected space such that they have and they are equally spaced between = -4 spaxels and = +4 spaxels along the major axis indicated on the bottom panel on the right hand side of Fig. 5 (4 spaxels mean which is approximately the size of the region we can extract kinematics data from). For each Voronoi bin ‘V’ (located at coordinates and with ) we compute the angular distances to each point ‘P’ on galaxy’s major axis ( and for ; we chose to sample the data-points at distances of from one another, giving a total of five points on the galaxy’s major axis): . Then for each constructed point on the galaxy’s major axis we define a kinematic rotational velocity and velocity dispersion such that:
| (9) |
| (10) |
and are the rotational velocity and the velocity dispersion (for the Voronoi bin ‘k’) computed by our Fiducial dynamical model for the Voronoi bin ‘k’. In this section, and can be regarded as the PSF-deconvolved kinematics map values obtained within the Fiducial dynamical model (Fig. 6). These are retrieved by setting the keywords in JAM: analytic_los = False and interp = False.
Using the equations 9 and 10, we obtain the radial profile data-points (the pink cross symbols on Fig. 6) at various radial distances from the galaxy’s centre along the galaxy’s major axis (at the positions with respect to galaxy’s observed centre). We then compute the values for and at the galaxy’s outskirts (so in our case at R = 0.2 along the major axis). This procedure gives us the projected value of . In order to calculate the de-projected value we use equation (A.2) from Falcón-Barroso et al. (2019) and obtain .
4.4.3 Specific angular momentum parameter
Our resolution does not allow us to compute the spin parameter within directly. We have only one Voronoi bin within (out of the 17 Voronoi bins) but 6 Voronoi bins within of the galaxy’s centre. The radial distances of the Voronoi bin “k” are where and are the Voronoi bins coordinates in the rotated system. We do not correct for inclination at this step yet as we will do the de-projection calculations at a later step. The spin parameter within can be computed by summing over the Voronoi bins within the said aperture. For the resolved stellar kinematics maps of the galaxy, and we use the output stellar kinematics maps from the JAM fiducial dynamical model. Following the definition from Emsellem et al. (2007):
| (11) |
In this equation represents the light flux at the position of the Voronoi bin. This light flux distribution map can be obtained as a direct output of our JAM dynamical model, but an alternative method is to simply add up all the signal from the pixels contained within each Voronoi bin. We chose to use the former method because it ensures better consistency with the input light maps that were used for JAM. However, in order to estimate the uncertainties on the Voronoi bin fluxes, , we proceeded by first creating a pseudo-NIRCam F200W band image of our target in order to mimic the photometric data from which the light maps inputs for JAM were constructed. Each Voronoi bin spectrum was convolved with the transmission curve of the F200W band1111 11 Information about the NIRCam filters can be found here. such that for any wavelength slice :
| (12) |
with the wavelength slices weights defined as . The noise values associated with the pseudo-F200W images are calculated using:
| (13) |
As a result, we will approximate the uncertainties on the JAM Voronoi bin fluxes as which we will use to propagate the uncertainties on from equation 11. Doing the calculations and the error propagations, we obtain the raw (not de-projected and not PSF corrected) . In order to account for PSF effects, we use the empirical correction given by equations 9 and 16 from Harborne et al. (2020) and plugging in our values for observed ellipticity, Sérsic index, effective radius from Table 1 and , we obtain . This still needs to be corrected for de-projection effects, for which we use equation (A.3) from Falcón-Barroso et al. (2019, originally from ) and we obtain .
Next, we can convert from to using equation 2 from Falcón-Barroso et al. (2019): . With this extrapolation, we would obtain: . This value enables us to make comparisons with observations from the literature (see Section 5). The criterion to define a galaxy as a slow rotator was proposed as the equation 19 of Cappellari (2016): . The intrinsic ellipticity of our galaxy is in the Fiducial dynamical model. This certainly places our galaxy well within the fast rotator regime. We can instead consider the alternative criterion from Emsellem et al. (2011): for fast rotators. In this case, we reach the same conclusion that GS-9209 is definitely a fast rotator. This is further illustrated by calculating the value for (obtained from by using equation 18 from Cappellari 2016) is in agreement, within the uncertainties, with the value computed in Section 4.4.2.
4.4.4
We want to compute how much of the total kinetic energy budget of our galaxy goes into stellar ordered rotation. This parameter is defined using the equation 1 of Sales et al. (2012). In order to determine its value in our case, we use the jam.axi.intr routine which computes the intrinsic first and second velocity moments for an arbitrary axisymmetric galaxy model.
The first step is to compute the light and the dark matter components MGE parametrisation. For a Gaussian with a peak surface brightness , dispersion , and observed axial ratio and intrinsic axial ratio (see Section 3.1.2 for details), the luminosity density is (equation 38 from Cappellari 2020):
| (14) |
In our case, for all Gaussians of the light component in our parametrisation and . For the dark matter component, we fit the classic NFW density profile (equation 5) using mge_fit_1d in a similar way to how we fit the Sérsic profile in Section 3.1.2 for the luminuous component. The resulting best-fit peak surface densities of the DM Gaussians are converted to volume densities using again the equation 14 and assuming a spherical dark matter halo so for all of these Gaussians . We next use the jam.mge.radial_mass function in order to calculate the amount of luminous mass within the effective radius in order to scale the dark matter component in such a way that matches the result from our Fiducial dynamical model (14.5%). Combining the MGE Gaussians for these two components, we obtain the gravitational potential parametrisation for our dynamical model that will be passed as input to jam.axi.intr (together with the luminous component parametrisation alone). We assume the central BH mass to be (Carnall et al., 2023b), the inclination angle is and (both values are computed based on the results of the Fiducial dynamical model).
For our intrinsic dynamical model we use a grid in a cylindrical system of coordinates with R = 0 at the centre of the galaxy and z = 0 in the central plane of this galaxy. The points in the grid at which we evaluate the model span from and from with 1000 equally spaced points in both R and z ranges. At each of these points, this model evaluates four quantities:
- •
, the squared velocity dispersions along the radial, vertical and azimuthal directions.
- •
, the second velocity moment along the tangential direction which in turn gives us the mean velocity of rotation along the tangential direction .
The equation 1 from Sales et al. (2012) can thus be re-written as:
| (15) |
The mass weights at each point of the (R, z) grid have been computed using equation 13 from Cappellari (2008) for the luminous component MGE parametrisation and its analogous (equation 15 from Cappellari 2008) for the dark matter component Gaussians and for each point on the grid . The total luminosity of a Gaussian with peak surface brightness , dispersion and observed axial ratio is and the equation is completely analogous for the total mass of a DM Gaussian. Using our results for these quantities, we obtain .
5 Discussion
5.1 Dynamical Structure of GS-9209
In this subsection, we discuss the properties of GS-9209 resulting from our dynamical model. We combine this information with the findings of our kinematics analysis in order to infer the most likely scenarios for the mass assembly history for this galaxy. In Carnall et al. (2023b), the authors justify, based on their model SFH, that MQGs have likely gone through a starburst/sub-millimetre galaxy (SMG) phase prior to the observation epoch. Therefore, we will now focus on exploring what the possible low redshift descendants of MQGs like GS-9209 might be.
5.1.1 Dark Matter Content - Comparison with Local Observations
In the corner plot of Fig. 5, we estimate a dark matter mass fraction within of . Because we assume a classical NFW dark matter density profile, this allows us to subsequently extrapolate the fraction of DM within one effective radius: , although it is crucial to stress that this quantity is obtained indirectly, because the spatial resolution of our data do not allow us to directly measure this quantity or the precise shape of the inner DM profile.
We compare this inferred low dark matter fraction that we found for GS-9209 (within with the values reported by a number of observational studies. Cappellari et al. (2013) analyse a sample of local ETGs within the survey and conduct JAM dynamical modelling of these galaxies, finding a median for their entire sample, but only about for their most robustly modelled galaxies. Lu et al. (2024) have a 20 times larger sample of low redshift ETGs and conduct a similar JAM dynamical modelling analysis, obtaining that the average for . Shetty and Cappellari (2015) also find a median for a sample of massive galaxies () at . For the higher redshift sample of massive quiescent galaxies of Mendel et al. (2020), the average DM fraction within the effective radius is lower ( on average) compared with their likely local descendants. This is in line with the predictions of simulations such as Hilz et al. (2013), who find that increases as galaxies build up their stellar mass via mergers throughout their evolution. Hence, is also predicted to increase with cosmic time. In the case of post-Cosmic Noon major mergers, the increase is mild and mainly driven by mixing processes leading to an intrinsic change in the spatial distribution of light and dark matter components (Hilz et al., 2012). However, minor mergers will lead to a more substantial increase in because in this case, the increase in stellar effective size is significant (Nipoti et al., 2009) meaning that now probes more extended regions of the dark matter halo (hence with more dark matter mass). Possible colour gradients could also have an impact, since the outskirts of MQGs are dominated by younger stellar populations (assuming an inside-out quenching scenario) hence with lower ratios. This was proved to be true for GS-9209 (Ji et al., 2024a) with the galaxy’s outskirts at from the centre being younger than the central region at . Since our kinematics data only extend up to and our dark matter fractions are measured within apertures lower than , this means that the gradient discovered by Ji et al. (2024a) was probed on larger spatial scales and our assumption of spatially uniform is still valid.
We provide a comparison between the dark matter fraction of GS-9209, , and the predictions of numerical simulations (focusing on the TNG50-1 simulation box) in Appendix E.
5.1.2 Extremely Compact Nature and Possible Descendants of GS-9209
Compact stellar sizes were reported for individual MQGs (Carnall et al., 2023b; de Graaff et al., 2024; Weibel et al., 2025) but also for sample studies (Ito et al., 2024; Ji et al., 2024b; Wright et al., 2024). It means that prior to quenching, the cold gas fuelling the extreme star formation episodes in the history of such galaxies was either channelled to the galaxy’s innermost central part (this is in agreement with the findings of previous studies based on cosmological simulations, e.g. Zolotov et al. 2015; Tacchella et al. 2016; McClymont et al. 2025) or that a compaction episode happened post-quenching: when the gas in the original stellar disc was consumed and the turbulent motions disappeared, the stellar orbits got shrinked as a result of dynamical friction. The rotation pattern of the stellar component observed in GS-9209 tells us that the stellar disc is not destroyed by the quenching mechanism (at least not immediately). This seems to be in agreement with the inside-out quenching scenario (Tacchella and others, 2015) and it tells us that the formation of spheroid components takes place on a much longer timescale compared to quenching in the case of MQGs in the early Universe.
The presence of a rotational pattern in the resolved map of this galaxy further indicates that this galaxy assembled most of its stellar mass, not by dry major mergers but more likely via secular accretion of cold gas possibly channelled along the cosmic web filaments (which ensures transportation of the gas deeper towards the central regions of massive halos). This picture is, however, challenged by the findings of Kimmig et al. (2025) who argue in the favour of the hypothesis that high-redshift MQGs may have initially been local nodes of the cosmic web residing in underdense environments. This means that the local filamentary structure is unable to efficiently accumulate mass at the node, leading to an extreme episode of isotropic, spherical mass accretion onto the node which is followed by a strong starburst phase. In any case, the subsequent quenching is likely the result of the action of AGN ejective feedback driving large outflows of cold gas, which is rapidly expelled out of the galaxy’s circumgalactic medium. Preventative feedback causes the heating of the gas in the halo, which ensures the long-term quiescence of galaxies such as GS-9209 or ZF-UDS-7329 (Glazebrook et al., 2024).
Gas-rich mergers (either major or minor) must also take place (likely before the quenching event) in the case of GS-9209, since this galaxy is somewhat rounder compared to both the average local and high-z pure discs. Lagos et al. (2018) show that gas-rich mergers typically produce small changes in a galaxy’s stellar specific angular momentum and, in some cases, it might even cause a galaxy to spin-up. Dry major mergers, however, are less plausible since they would distort or even destroy the stellar rotation pattern that we observe. This seems to be in agreement with the findings of Puskás et al. (2025) who determine that major mergers contribute less than 15% to galaxies’ stellar mass growth (in a redshift range and for a sample with stellar masses ). Such galaxies could be the progenitors of MQGs like GS-9209. Numerical simulations (e.g. Tacchella et al. 2019) reveal that ex-situ processes become the dominant source of mass growth in the case of massive galaxies only at lower redshifts . Duan et al. (2025) find that at the redshift of GS-9209, the merger rate per galaxy is about on average. Carnall et al. (2023b) calculate that the age of this galaxy at the observation time (i.e. ) is 400-500 Myr. Thus, all these results support the possibility that GS-9209 has not undergone a significant major merger throughout its history prior to z = 4.66. However, any major mergers in the subsequent evolution of MQGs like GS-9209 will ultimately determine the possible descendants of early formed, early quenched massive galaxies.
Due to the high-z MQGs’ compactness, many authors claimed them to be the progenitors of the compact, dense cores of Cosmic Noon and later ETGs (Carnall et al., 2023b; Ji et al., 2024c; Weibel et al., 2025). Indeed, correlations between quenching and exist (Cappellari and others, 2013; Bluck et al., 2014) and, furthermore, by there is clear evidence for massive bulges and galaxies with suppressed star formation, at least in their core regions (Tacchella and others, 2015). However, it is likely that a fraction of high redshift compact MQGs similar to GS-9209 may not be involved in low redshift major mergers. They might be the progenitors of a rare class of compact, massive early-type galaxies known as ‘relics’. An example of such a galaxy is NGC 1277 (Trujillo et al., 2014; Comerón et al., 2023), which has seen little change in terms of its stellar populations or structural properties within the last 12 Gyr. Further evidence that internal processes have the largest contribution to the mass assembly of NGC 1277 is represented by the discovery that this galaxy predominantly hosts metal-rich (red) globular clusters (Beasley et al., 2018). The stellar populations of relic galaxies are believed to be formed during a single starburst episode in the history of this galaxy. Beasley et al. (2018) find that the fraction of blue, metal-poor globular clusters in NGC 1277 (whose likely origin is accretion from less massive companion galaxies) is significantly smaller compared to galaxies of similar to NGC 1277.
Regarding the dark matter content, NGC 1277 is even more baryon dominated () than GS-9209. Both NGC 1277 and GS-9209 are fast rotators, highly compact and strongly baryon dominated, indicating that the latter galaxy is the currently highest-redshift analogue of the local relics galaxy population. A possible link between high redshift MQGs and low redshift relics has been suggested by Hartmann et al. (2025). Comerón et al. (2023) suggest that the low dark-matter content of relics in the local Universe might be caused by processes taking place in early stages of galaxy formation. One possible explanation could be that, during the early stages of massive galaxy formation, baryons cool and accrete onto the central galaxy on a shorter timescale than dark matter. An alternative possibility is given by an extensive dark matter component stripping during the galaxy’s infall into a rich galaxy cluster (NGC 1277 is part of the Perseus Cluster, but this does not apply to GS-9209 which is an isolated object). Finally, the low dark matter fraction could also be explained by an early proto-galactic collision that essentially left the galaxy heavily baryon dominated for its entire subsequent evolution.
Interestingly, GS-9209 and NGC 1277 possess a key difference: the initial mass functions (IMFs) of their stellar populations. Comerón et al. (2023) found an extremely bottom-heavy IMF with for NGC 1277. Ferré-Mateu et al. (2017) also found that two additional relic galaxies (Mrk 1216 and PGC-032873) have bottom-heavy IMFs. Indeed, Maksymowicz-Maciata et al. (2024) reported (figure 5 of their paper) that extreme relic galaxies are generally characterised by a bottom-heavy IMF. However, we find that GS-9209 is instead characterised by a standard IMF. This is because our fiducial dynamical model returned , which is in excellent agreement with the value found by Carnall et al. (2023b) () who performed a SED fitting of the galaxy’s spectrum and assumed a Kroupa IMF (Kroupa, 2001). This may point to some differences in the formation and mass assembly processes of early massive quenched galaxies, compared to low-redshift relic galaxies. Hence, it is unclear whether the former category truly represents the progenitors of the latter.
Regardless, our findings represent the first dynamical measurement of the IMF at , highlighting the potential of future spatially resolved surveys of high redshift MQGs.
5.2 Comparison with Literature
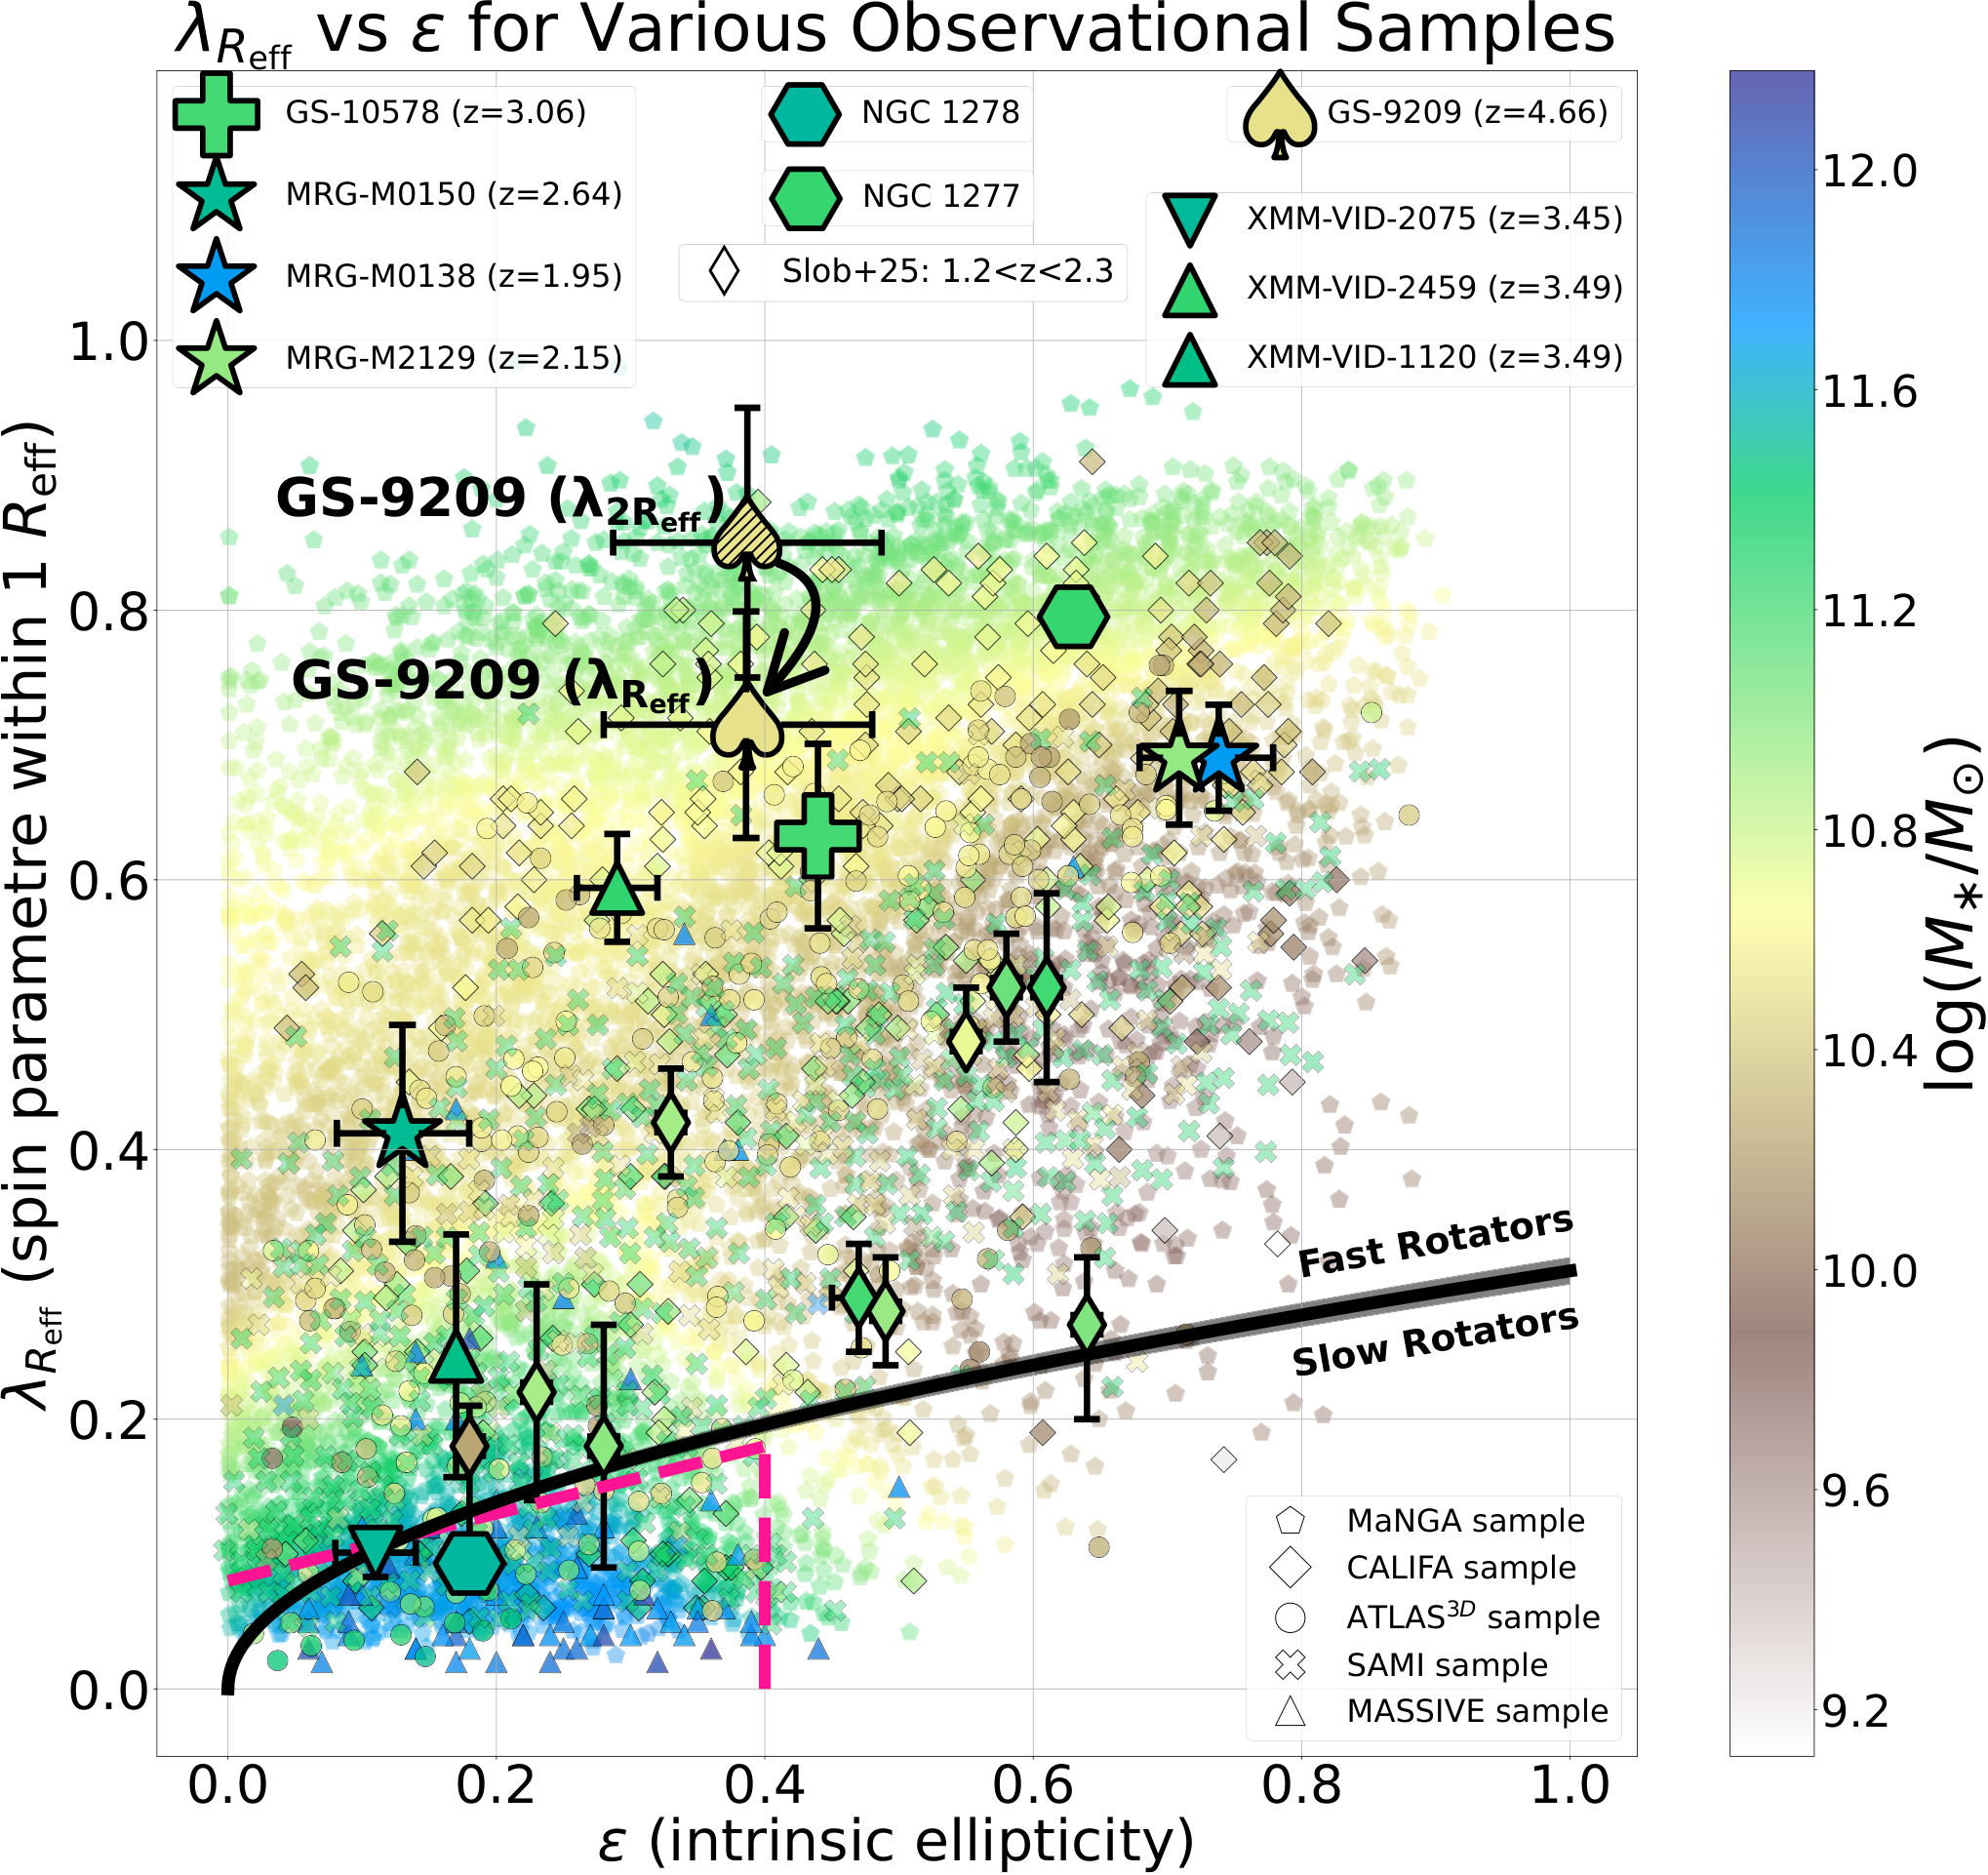
Our value of gives (as shown in Section 4.4.2). We can study the properties of GS-9209 by comparing it with GS-10578 (another Massive Quiescent Galaxy, but at lower redshift, ). As we can observe in Fig. 7 these galaxies occupy a similar place in the plane but they have quite different stellar masses. It is important to look in more detail at some potential key differences between the way these two galaxies assembled their mass and quenched star formation.
D’Eugenio et al. (2024) mention that GS-10578 had its main star formation episodes at epochs . The stellar mass of GS-10578 is approximately 5 times larger than that of GS-9209. Both galaxies retain high values of specific angular momentum which means that these galaxies formed most of their stellar mass in-situ and that they likely did not experience significant gas-poor mergers (otherwise we would not observe a significant stellar rotation; e.g. Lagos et al. 2018). If galaxies like GS-9209 were the direct progenitors of those like GS-10578, given the stellar mass differences between the two galaxies, and the difference in the ages of the Universe at these redshifts, this would imply an average stellar mass growth rate of . If this was fuelled solely by fresh cold gas accretion (major mergers would disturb the observed stellar disc motions), that new reservoir of cold gas would need to be converted into stars in order to match the observational constraints of low molecular hydrogen mass fraction in quiescent galaxies (e.g. Suzuki et al. 2022; Scholtz et al. 2024). Such high values of SFR are typically associated with high redshift sub-millimetre galaxies (SMGs) or high redshift dusty star forming galaxies (Carniani et al., 2013; Gilli et al., 2014; Tan et al., 2014; Casey et al., 2019; Sharda et al., 2019; Riechers et al., 2020; Rizzo et al., 2020; Birkin et al., 2021; Fraternali et al., 2021; Rizzo et al., 2021; Ikarashi et al., 2022; Sun et al., 2024; Parlanti et al., 2023; Arribas et al., 2024; Fuentealba-Fuentes et al., 2024; Zhu et al., 2024; Sillassen et al., 2025, DSFGs; ). Consequently, a plausible explanation is that SMGs and/or DSFGs could be the progenitors of MQGs like GS-9209 or GS-10578. Some galaxy formation and evolution simulations predict an evolutionary link between SMGs and MQGs (Lagos et al., 2015).
Park et al. (2024) analysed SFHs in Cosmic Noon MQGs and they report having found their sample to be split into three different sub-categories (figure 7 of that paper). In our case, the findings of Park et al. (2024) resonate with the different star formation histories of GS-10578 (which is a recently formed, recently quenched galaxy) and GS-9209 (an early formed, early quenched galaxy). As a result, despite showing some similarities, galaxies such as GS-9209 are unlikely to be the direct progenitors of those like GS-10578. This underlines the idea that the likely mechanisms of mass assembly and quenching of massive quiescent galaxies were already in place at and, moreover, the same processes seem to occur in a similar way for widely different stellar masses.
Close similarity in terms of the position in the plane can be observed in the case of the galaxies MRG-M0138 and MRG-M2129. However, just as in the case of GS-10578 vs GS-9209, the stellar masses of these Cosmic Noon quiescent galaxies are also widely different: for MRG-M2129 and for MRG-M0138. In the case of these galaxies, the stellar rotation component (highlighted by the high ellipticity and high ) has been preserved after quenching. In addition, the galaxies are observed (via lensing) at similar redshifts ( for MRG-M2129, Toft et al. 2017 and for MRG-M0138, Newman et al. 2018b) which, given the highly different stellar masses, argues for different star formation histories in these galaxies. Again, given the high , it is most likely that these galaxies built most of their stellar masses via secular cosmological gas accretion and in-situ gas conversion into stars. Nevertheless, the quenching mechanism leading to the halting of star formation in such massive galaxies seem to be taking place in a similar way independent of . It can be remarked that the MQGs at that we plotted in Fig. 7 and the relic galaxy NGC 1277 at are all fast-rotators. This is in very good agreement with the findings from the Magneticum Pathfinder simulations. Figure 10 from Kimmig et al. (2025) highlights that at all redshifts tested by the authors, slow rotators quiescent galaxies represent a minority of the overall galaxy population.
5.3 Comparison with Observations

In Fig. 8, we plot the evolution of the ratio between stellar rotational velocity and stellar velocity dispersion () based various observational samples. We present the quiescent galaxies in the LEGA-C and SUSPENSE samples, together with the six MQGs at which have available stellar kinematics data. In cases where is not directly reported, we compute this ratio as follows. For five of our individual MQGs highlighted in the plot (GS-9209, GS-10578 from D’Eugenio et al. 2024, MRG-0138, MRG-0150 and MRG-2129 from Newman et al. 2018b), we use their radial profiles of the velocity dispersion to determine the ratio . In the case of the slow rotator XMM-VID-2075, Forrest et al. (2025) report and , from which we obtain a value of for this ratio. We then estimate the values of based on the measured parameters using equation 18 from Cappellari 2016. We then multiplied by . The existence of a slow rotator MQG at could be potentially explained as the outcome of a major merger event which strongly disrupted a previously existing stellar disc. This would also be consistent with the relatively high observed axial ratio of that object (; Forrest et al. 2025). However, an alternative hypothesis of an isotropic gas infall has been proposed by Chandro-Gómez et al. (2025).
For the three lensed massive quiescent targets from Newman et al. (2018b), their effective radii are given in Newman et al. (2018a) in the case of MRG-2129 and MRG-0150 and in Newman et al. (2025) for MRG-0138. We have assumed that for these three MQGs . This approximation is true in the case of GS-9209 ( km/s, see Section 3.2 while km/s, see Fig. 6). The numerical uncertainty of the aperture-integrated velocity dispersion that we measure is larger than the difference between and by an order of magnitude.
In the case of quiescent galaxy samples with stellar kinematics, there is no significant trend between and redshift (see Fig. 8). However, this sample of MQGs, together with the quenched galaxies from LEGA-C and SUSPENSE, is not large enough to obtain a statistically significant conclusion. Within the LEGA-C sample, lower-mass quiescent galaxies have more rotational support. This is in contrast with the findings of ionised gas kinematics surveys targetting star-forming galaxies (Wisnioski et al., 2015; Simons et al., 2016; Förster Schreiber et al., 2018; Wisnioski et al., 2019; Genzel et al., 2020); in these cases, the galaxies with the highest ratios are also very massive (Wisnioski et al., 2019; Danhaive et al., 2025). This highlights the different behaviour of distinct kinematics tracers (e.g. star and warm ionised gas, in this case), which furthermore implies that and cannot be compared directly. This is because ionised gas typically traces a more dynamically active interstellar medium, while the stars in fast-rotators MQGs like GS-9209 or GS-10578 have reached a steady-state ordered rotation.
6 Conclusions
In this paper, we used ultra-deep (14.7 hours) high-resolution IFU JWST/NIRSpec data with the G235H grating to conduct a detailed analysis of the structural, kinematic and dynamic properties of the massive quiescent galaxy GS-9209.
- •
From the integrated aperture spectrum, we measure a stellar velocity dispersion of in agreement with the value found by Carnall et al. (2023b) ( , obtained using medium-resolution spectroscopy).
- •
We showed the resolved maps and , extending out to . The stellar velocity map shows clear evidence for ordered rotation, which makes GS-9209 the highest-redshift galaxy for which such a feature is probed via integral field spectroscopy.
- •
We find that GS-9209 is rotation supported, having a high (PSF-corrected) , from which we can extrapolate that , comparable to other quiescent galaxies at . This value of is equivalent to a . This means that the mechanism responsible for quenching this galaxy still preserved the rotating stellar disc. GS-9209 is a fast rotator similar to other intermediate and high-z massive quiescent galaxies (Newman et al., 2018b; D’Eugenio et al., 2024). Furthermore, the high degree of rotational support suggests that the kinematic transformation between fast and slow rotators observed at lower redshifts occurs only after quenching. This is in agreement with the results obtained from numerical simulations: quenching preceedes kinematic transformation in galaxies that become slow rotators at (Tacchella et al., 2019; Lagos et al., 2022).
- •
We then fit our fiducial dynamical model (with a classical NFW DM profile and a BH whose mass takes a Gaussian prior motivated by virial scaling relations based on its broad-line H emission properties). The model assumes a cylindrical alignment of the velocity ellipsoid. With our fiducial dynamical model, we obtain the currently highest redshift measurement of the dark matter content of a galaxy based on its stellar kinematics: . Given the compact nature of the source (compared to e.g. its host dark matter halo) the low DM fraction is in line with the expectations. Other important parameters that come out from the dynamical modelling are the intrinsic axial ratio and the radial anisotropy. These are crucial in our de-projection calculations for the kinematics parameters.
- •
Also from our fiducial dynamical model, we infer a . This represents the first such measurement at and it is consistent with a standard, Milky-Way like IMF from stellar population modelling. The agreement with the value inferred from SED modelling (Carnall et al., 2023b) provides independent confirmation on the large stellar mass of early quiescent galaxies.
- •
The low dark matter content of GS-9209 and its high spin parameter make it similar to the population of relic galaxies (e.g. Comerón et al. 2023). This remarkable category of galaxies has undergone little evolution within a time interval of Gyr or more. However, one possible key difference between high redshift MQGs and low redshift relics is the difference between their IMFs. Further dynamical studies on high z MQGs would reveal their IMFs, which could confirm or refute the possibility of them being the progenitors of low redshift relic galaxies.
- •
We compared the value of of GS-9209 (corrected for projection and PSF effects) to independent observational surveys in the Universe but also to various particular MQGs for which this parameter was calculated. For virtually all intermediate and high- MQGs (except for one recently discovered high-redshift slow rotator) the positions on the plane indicate that they are fast rotators. This is a strong evidence that the star formation quenching and the destruction of the stellar disc likely happen in this precise order. The causality relation between these two important milestones in a galaxy’s evolution is yet to be fully understood. For the general galaxy population, as they build up their stellar mass, the amount of rotational support diminishes. This is in good agreement with the current galaxy evolution theories (e.g. Schulze et al. 2018 analyse the evolution of plane at in the Magneticum simulations, reporting an increased fraction of slow rotators). This is correlated with the formation and growth of central bulges and dispersion dominated spheroidal sub-structures.
The difficulty encountered by multiple simulations to reproduce the observed number density of MQGs and their physical properties (the most problematic one being the compact size) points to key differences between the processes governing the evolution of galaxies within Gyr and the ones implemented in theoretical models. By exploring these differences, we can improve our understanding of the complex physical processes shaping the SFHs of high-redshift galaxies, their mass assembly histories and the spatial distribution of baryons. In this direction, our work highlights the crucial ability of stellar kinematics data to provide constraints for cosmological simulations. From an observational point of view, studying quiescent galaxies enables us to measure their dark matter content without the complication of a possible large gas fraction such as in star-forming galaxies. Constructing a sample of high redshift quenched galaxies with spatially resolved stellar kinematics would provide tighter constraints on current theoretical models.
In the absence of galactic outflows, this galaxy could be able to rejuvenate in the future via merger induced starbursts, for instance. The analysis of spatially resolved outflow properties in high- MQGs could give more clear insights into their possible descendants. Another possible study would also involve FIR/sub-mm observations of this galaxy with ALMA, having the primary goal of investigating the amount of cold molecular gas and the state of that gas. This can be done with the fine structure emission line or with CO emission lines, which are both tracers of molecular gas even for quiescent galaxies (D’Eugenio et al., 2023). Such studies can be extended to samples of multiple MQGs at , which would allow us to determine both the cold gas content and the gas-consumption histories of MQGs more accurately. This is because high-redshift MQGs are usually quenched close (less than 1 Gyr) to the observation time, so passive evolution effects are minimal, which puts more stringent constraints on the nature of the quenching mechanism. Such a sample could be compared with the results of numerical simulations (e.g Lorenzon et al. 2025) and thus provide an extremely valuable step forward in constraining the physics implemented in the next generation of galaxy evolution simulations.
Acknowledgements
We are grateful to the referee for insightful and constructive feedback that substantially improved the quality of this manuscript. RGP acknowledges funding support from a STFC PhD studentship. RGP, FDE, RM and JS acknowledge support by the Science and Technology Facilities Council (STFC), by the ERC through Advanced Grant 695671 “QUENCH”, and by the UKRI Frontier Research grant RISEandFALL. RM also acknowledges funding from a research professorship from the Royal Society. ST acknowledges support from the Royal Society Research Grant G125142. SC acknowledges support by European Union’s HE ERC Starting Grant No. 101040227 - WINGS. AJB acknowledges funding from the “FirstGalaxies” Advanced Grant from the European Research Council (ERC) under the European Union’s Horizon 2020 research and innovation program (Grant Agreement No. 789056). SA and MP acknowledge grant PID2021-127718NB-I00 funded by the Spanish Ministry of Science and Innovation/State Agency of Research (MICIN/AEI/ 10.13039/501100011033); MP also acknowledges the grant RYC2023-044853-I, funded by MICIU/AEI/10.13039/501100011033 and European Social Fund Plus (FSE+). We thank William Baker and Yuki Isobe for insightful discussions that led to improvements of the original manuscripts and paper drafts.
Data Availability
This work is based on observations conducted with the NASA/ESA/CSA James Webb Space Telescope. The data were obtained as part of the JWST program ID 3659 (Cycle 2, PI: Francesco D’Eugenio). These data are available from Mikulski Archive for Space Telescopes at the Space Telescope Science Institute, which is operated by the Association of Universities for Research in Astronomy , Inc., under NASA contract NAS 5-03127 for JWST. The fully reduced datacube is available upon reasonable request. The photometry data in the JWST/NIRCam F200W band are available from the public data release page of the JADES survey on MAST.
References
- Quantifying Morphological Evolution from Low to High Redshifts. Ap&SS 269-270, pp. 323–338. External Links: Document, astro-ph/0006166 Cited by: §1.
- To High Redshift and Low Mass: Exploring the Emergence of Quenched Galaxies and Their Environments at 3 < z < 6 in the Ultra-deep JADES MIRI F770W Parallel. ApJ 975 (1), pp. 85. External Links: Document, 2312.12207 Cited by: §1.
- GA-NIFS: The core of an extremely massive protocluster at the epoch of reionisation probed with JWST/NIRSpec. A&A 688, pp. A146. External Links: Document, 2312.00899 Cited by: §5.2.
- The Astropy Project: Sustaining and Growing a Community-oriented Open-source Project and the Latest Major Release (v5.0) of the Core Package. ApJ 935 (2), pp. 167. External Links: Document, 2206.14220 Cited by: §2.1.2.
- The abundance and nature of high-redshift quiescent galaxies from JADES spectroscopy and the FLAMINGO simulations. MNRAS 539 (1), pp. 557–589. External Links: Document, 2410.14773 Cited by: §1, §1.
- Exploring over 700 massive quiescent galaxies at z = 2─7: Demographics and stellar mass functions. A&A 702, pp. A270. External Links: Document, 2506.04119 Cited by: §1.
- The SWELLS survey - IV. Precision measurements of the stellar and dark matter distributions in a spiral lens galaxy. MNRAS 423 (2), pp. 1073–1088. External Links: Document, 1201.1692 Cited by: §4.2.
- A single population of red globular clusters around the massive compact galaxy NGC 1277. Nature 555 (7697), pp. 483–486. External Links: Document, 1803.04893 Cited by: §5.1.2.
- The Average Star Formation Histories of Galaxies in Dark Matter Halos from z = 0-8. ApJ 770 (1), pp. 57. External Links: Document, 1207.6105 Cited by: §4.2.
- The data analysis pipeline for the sdss-iv manga ifu galaxy survey: emission-line modeling. AJ 158 (4), pp. 160. External Links: Document, 1901.00866 Cited by: §3.2.
- The Diverse Molecular Gas Content of Massive Galaxies Undergoing Quenching at z 1. ApJ 909 (1), pp. L11. External Links: Document, 2102.07881 Cited by: §1.
- Star formation shut down by multiphase gas outflow in a galaxy at a redshift of 2.45. Nature 630 (8015), pp. 54–58. External Links: Document, 2308.05795 Cited by: §1.
- The Broad Line Region and Black Hole Mass of NGC 4151. ApJ 934 (2), pp. 168. External Links: Document, 2206.03513 Cited by: §4.4.1.
- Elemental Abundances and Ages of z 0.7 Quiescent Galaxies on the Mass-Size Plane: Implication for Chemical Enrichment and Star Formation Quenching. ApJ 917 (1), pp. L1. External Links: Document, 2105.12750 Cited by: 2nd item.
- From Carbon to Cobalt: Chemical Compositions and Ages of z 0.7 Quiescent Galaxies. ApJ 948 (2), pp. 140. External Links: Document, 2303.03412 Cited by: 2nd item.
- Now You See It, Now You Don’t: Star Formation Truncation Precedes the Loss of Molecular Gas by 100 Myr in Massive Poststarburst Galaxies at z 0.6. ApJ 925 (2), pp. 153. External Links: Document, 2111.14877 Cited by: §1.
- An ALMA/NOEMA survey of the molecular gas properties of high-redshift star-forming galaxies. MNRAS 501 (3), pp. 3926–3950. External Links: Document, 2009.03341 Cited by: §5.2.
- ARA&A 47 (1), pp. 159–210. External Links: Document, 0908.3017 Cited by: §1.
- Are galactic star formation and quenching governed by local, global, or environmental phenomena?. MNRAS 492 (1), pp. 96–139. External Links: Document, 1911.08857 Cited by: §1.
- Bulge mass is king: the dominant role of the bulge in determining the fraction of passive galaxies in the Sloan Digital Sky Survey. MNRAS 441 (1), pp. 599–629. External Links: Document, 1403.5269 Cited by: §5.1.2.
- MNRAS 499 (1), pp. 230–268. External Links: Document, 2009.05341 Cited by: §1.
- The Near-Infrared Spectrograph (NIRSpec) on the James Webb Space Telescope. III. Integral-field spectroscopy. A&A 661, pp. A82. External Links: Document, 2202.03308 Cited by: §2.
- What shapes the galaxy mass function? Exploring the roles of supernova-driven winds and active galactic nuclei. MNRAS 422 (4), pp. 2816–2840. External Links: Document, 1112.2712 Cited by: §1.
- Monthly Notices of the Royal Astronomical Society 370 (2), pp. 645–655. External Links: ISSN 0035-8711, Document, Link, https://academic.oup.com/mnras/article-pdf/370/2/645/2898993/mnras0370-0645.pdf Cited by: §1, §1.
- astropy/photutils: 2.0.2 External Links: Document Cited by: §2.1.2.
- The relationship between star formation activity and galaxy structural properties in CANDELS and a semi-analytic model. MNRAS 465 (1), pp. 619–640. External Links: Document, 1607.06075 Cited by: §1.
- MNRAS 490 (4), pp. 5134–5146. External Links: Document, 1910.02088 Cited by: §1, §1.
- Active Galactic Nucleus Feedback in Quiescent Galaxies at Cosmic Noon Traced by Ionized Gas Emission. ApJ 981 (1), pp. 25. External Links: Document, 2406.08547 Cited by: §1.
- The sauron project - iv. the mass-to-light ratio, the virial mass estimator and the fundamental plane of elliptical and lenticular galaxies. MNRAS 366, pp. 1126–1150. External Links: Document, arXiv:astro-ph/0505042 Cited by: §4.3.
- Adaptive spatial binning of integral-field spectroscopic data using Voronoi tessellations. MNRAS 342 (2), pp. 345–354. External Links: Document, astro-ph/0302262 Cited by: §3.3.
- Dynamical Masses of Early-Type Galaxies at z ~2: Are they Truly Superdense?. ApJ 704 (1), pp. L34–L39. External Links: Document, 0906.3648 Cited by: §4.2.
- The SAURON project - X. The orbital anisotropy of elliptical and lenticular galaxies: revisiting the (V/, ɛ) diagram with integral-field stellar kinematics. MNRAS 379 (2), pp. 418–444. External Links: Document, astro-ph/0703533 Cited by: Figure 10, Figure 10, §4.2.
- The ATLAS project - I. A volume-limited sample of 260 nearby early-type galaxies: science goals and selection criteria. MNRAS 413 (2), pp. 813–836. External Links: Document, 1012.1551 Cited by: Figure 7, Figure 7.
- Parametric Recovery of Line-of-Sight Velocity Distributions from Absorption-Line Spectra of Galaxies via Penalized Likelihood. PASP 116 (816), pp. 138–147. External Links: Document, astro-ph/0312201 Cited by: §3.2.
- MNRAS 432 (3), pp. 1862–1893. External Links: Document, 1208.3523 Cited by: Figure 7, Figure 7, §5.1.2.
- The ATLAS project - XV. Benchmark for early-type galaxies scaling relations from 260 dynamical models: mass-to-light ratio, dark matter, Fundamental Plane and Mass Plane. MNRAS 432 (3), pp. 1709–1741. External Links: Document, 1208.3522 Cited by: §4.2, Figure 7, Figure 7, §5.1.1.
- Efficient multi-Gaussian expansion of galaxies. MNRAS 333 (2), pp. 400–410. External Links: Document, astro-ph/0201430 Cited by: §2.1.1, §3.1.2, §3.1.2, §3.1.
- Measuring the inclination and mass-to-light ratio of axisymmetric galaxies via anisotropic Jeans models of stellar kinematics. MNRAS 390 (1), pp. 71–86. External Links: Document, 0806.0042 Cited by: Appendix E, 3rd item, §3.1.2, §4.2, §4.2, §4.4.1, §4.4.4.
- Structure and Kinematics of Early-Type Galaxies from Integral Field Spectroscopy. ARA&A 54, pp. 597–665. External Links: Document, 1602.04267 Cited by: §4.4.3, Figure 7, Figure 7, §5.3.
- Improving the full spectrum fitting method: accurate convolution with Gauss-Hermite functions. MNRAS 466 (1), pp. 798–811. External Links: Document, 1607.08538 Cited by: §3.2, §3.2.
- Efficient solution of the anisotropic spherically aligned axisymmetric Jeans equations of stellar hydrodynamics for galactic dynamics. MNRAS 494 (4), pp. 4819–4837. External Links: Document, 1907.09894 Cited by: §4.4.4.
- Full spectrum fitting with photometry in PPXF: stellar population versus dynamical masses, non-parametric star formation history and metallicity for 3200 LEGA-C galaxies at redshift z 0.8. MNRAS 526 (3), pp. 3273–3300. External Links: Document, 2208.14974 Cited by: §3.2, §4.2, §4.3.
- The JWST EXCELS survey: too much, too young, too fast? Ultra-massive quiescent galaxies at 3 < z < 5. MNRAS 534 (1), pp. 325–348. External Links: Document, 2405.02242 Cited by: Appendix E, §1, 2nd item.
- A surprising abundance of massive quiescent galaxies at 3 < z < 5 in the first data from JWST CEERS. MNRAS 520 (3), pp. 3974–3985. External Links: Document, 2208.00986 Cited by: Appendix E, §1.
- A massive quiescent galaxy at redshift 4.658. Nature 619 (7971), pp. 716–719. External Links: Document, 2301.11413 Cited by: §1, §1, §1, §3.1.1, §3.1, §3.2, §3.2, §4.2, §4.2, §4.4.1, §4.4.4, §5.1.2, §5.1.2, §5.1.2, §5.1.2, §5.1, 1st item, 5th item.
- Strongly star-forming rotating disks in a complex merging system at z = 4.7 as revealed by ALMA. A&A 559, pp. A29. External Links: Document, 1308.5113 Cited by: §5.2.
- Physical Characterization of an Unlensed, Dusty Star-forming Galaxy at z = 5.85. ApJ 887 (1), pp. 55. External Links: Document, 1910.13331 Cited by: §5.2.
- Unveiling the properties and origin of massive quenched galaxies at in the COLIBRE hydrodynamical simulations. arXiv e-prints, pp. arXiv:2512.16208. External Links: Document, 2512.16208 Cited by: §5.3.
- Mesa Isochrones and Stellar Tracks (MIST). I. Solar-scaled Models. ApJ 823 (2), pp. 102. External Links: Document, 1604.08592 Cited by: §3.2.
- Analytical properties of the R law. A&A 352, pp. 447–451. External Links: Document, astro-ph/9911078 Cited by: §3.1.2, §3.1.2.
- Locally Weighted Regression: An Approach to Regression Analysis by Local Fitting. Journal of the American Statistical Association 83 (403), pp. 596–610. External Links: Document, Link Cited by: Figure 12, Figure 12, Figure 7, Figure 7.
- The massive relic galaxy NGC 1277 is dark matter deficient. From dynamical models of integral-field stellar kinematics out to five effective radii. A&A 675, pp. A143. External Links: Document, 2303.11360 Cited by: §4.2, Figure 7, Figure 7, §5.1.2, §5.1.2, §5.1.2, 6th item.
- ApJ 712 (2), pp. 833–857. External Links: Document, 0911.3151 Cited by: §3.2.
- Resolving the Metallicity Distribution of the Stellar Halo with the H3 Survey. ApJ 887 (2), pp. 237. External Links: Document, 1909.02007 Cited by: §3.2.
- ApJ 699 (1), pp. 486–506. External Links: Document, 0809.4261 Cited by: §3.2.
- The dawes review 9: the role of cold gas stripping on the star formation quenching of satellite galaxies. Publ. Astron. Soc. Australia 38, pp. e035. External Links: Document, 2104.02193 Cited by: §1.
- The SAMI Galaxy Survey: galaxy spin is more strongly correlated with stellar population age than mass or environment. MNRAS 529 (4), pp. 3446–3468. External Links: Document, 2402.06877 Cited by: §1.
- Monthly Notices of the Royal Astronomical Society 365 (1), pp. 11–28. External Links: ISSN 0035-8711, Document, Link, https://academic.oup.com/mnras/article-pdf/365/1/11/5530258/365-1-11.pdf Cited by: §1.
- The dawn of discs: unveiling the turbulent ionized gas kinematics of the galaxy population at z 4─6 with JWST/NIRCam grism spectroscopy. MNRAS 543 (4), pp. 3249–3302. External Links: Document, 2503.21863 Cited by: §5.3.
- SIMBA: Cosmological simulations with black hole growth and feedback. MNRAS 486 (2), pp. 2827–2849. External Links: Document, 1901.10203 Cited by: Appendix E.
- Efficient formation of a massive quiescent galaxy at redshift 4.9. Nature Astronomy. External Links: Document, 2404.05683 Cited by: §1, §5.1.2.
- Observed structural parameters of EAGLE galaxies: reconciling the mass-size relation in simulations with local observations. MNRAS 511 (2), pp. 2544–2564. External Links: Document, 2110.02235 Cited by: Appendix E.
- Geometry and inclination of the broad-line region in blazars. MNRAS 413 (1), pp. 39–46. External Links: Document, 1011.5879 Cited by: §4.4.1.
- Galaxy bimodality due to cold flows and shock heating. MNRAS 368 (1), pp. 2–20. External Links: Document, astro-ph/0412300 Cited by: §1.
- Efficient formation of massive galaxies at cosmic dawn by feedback-free starbursts. MNRAS 523 (3), pp. 3201–3218. External Links: Document, 2303.04827 Cited by: §1, §1.
- Energy input from quasars regulates the growth and activity of black holes and their host galaxies. Nature 433 (7026), pp. 604–607. External Links: Document, astro-ph/0502199 Cited by: §1.
- Coincidence between morphology and star formation activity through cosmic time: the impact of the bulge growth. MNRAS 513 (1), pp. 256–281. External Links: Document, 2203.15819 Cited by: §1.
- The benchmark black hole in NGC 4258: dynamical models from high-resolution two-dimensional stellar kinematics. MNRAS 450 (1), pp. 128–144. External Links: Document, 1503.04540 Cited by: §4.2.
- On the Relation between the Inclination Angle of the Accretion Disk and the Broad-line Region in Active Galactic Nuclei. ApJ 988 (1), pp. 3. External Links: Document, 2412.09451 Cited by: §4.4.1.
- Galaxy mergers in the epoch of reionization – I. A JWST study of pair fractions, merger rates, and stellar mass accretion rates at z = 4.5–11.5. MNRAS 540 (1), pp. 774–805. External Links: Document, 2407.09472 Cited by: §5.1.2.
- Galaxy Mergers in the Epoch of Reionization II: Major Merger-Triggered Star Formation and AGN Activities at . arXiv e-prints, pp. arXiv:2411.04944. External Links: Document, 2411.04944 Cited by: §4.2.
- The [CII] 158 m emission line as a gas mass tracer in high redshift quiescent galaxies. A&A 678, pp. L9. External Links: Document, 2309.12730 Cited by: §6.
- JADES Data Release 3: NIRSpec/Microshutter Assembly Spectroscopy for 4000 Galaxies in the GOODS Fields. ApJS 277 (1), pp. 4. External Links: Document, 2404.06531 Cited by: §3.1.1.
- A fast-rotator post-starburst galaxy quenched by supermassive black-hole feedback at z = 3. Nature Astronomy 8, pp. 1443–1456. External Links: Document, 2308.06317 Cited by: Appendix E, §1, §2.1.3, §4.2, Figure 7, Figure 7, Figure 8, Figure 8, §5.2, §5.3, 3rd item.
- Overview of the jwst advanced deep extragalactic survey (jades). arXiv preprint arXiv:2306.02465. Cited by: §3.1.1.
- The JADES Origins Field: A New JWST Deep Field in the JADES Second NIRCam Data Release. ApJS 281 (2), pp. 50. External Links: Document, 2310.12340 Cited by: §3.1.1.
- The multi-gaussian expansion method: a tool for building realistic photometric and kinematical models of stellar systems I. The formalism. A&A 285, pp. 723–738. Cited by: §3.1.
- The ATLAS project - III. A census of the stellar angular momentum within the effective radius of early-type galaxies: unveiling the distribution of fast and slow rotators. MNRAS 414 (2), pp. 888–912. External Links: Document, 1102.4444 Cited by: §1, §4.4.3, §4.4.3, Figure 7, Figure 7.
- The SAURON project - IX. A kinematic classification for early-type galaxies. MNRAS 379 (2), pp. 401–417. External Links: Document, astro-ph/0703531 Cited by: §1, §4.4.3.
- A&A 532, pp. A95. External Links: Document, 1107.2303 Cited by: §3.2, §3.2.
- The CALIFA view on stellar angular momentum across the Hubble sequence. A&A 632, pp. A59. External Links: Document, 1910.06236 Cited by: §4.4.2, §4.4.3, §4.4.3, Figure 7, Figure 7.
- Triaxial orbit-based modelling of the Milky Way Nuclear Star Cluster. MNRAS 466 (4), pp. 4040–4052. External Links: Document, 1701.01583 Cited by: §4.2.
- Two new confirmed massive relic galaxies: red nuggets in the present-day Universe. MNRAS 467 (2), pp. 1929–1939. External Links: Document, 1701.05197 Cited by: §5.1.2.
- Quasar feedback revealed by giant molecular outflows. A&A 518, pp. L155. External Links: Document, 1006.1655 Cited by: §1.
- MNRAS 483 (4), pp. 4586–4614. External Links: Document, 1805.05352 Cited by: §1.
- Emcee: the mcmc hammer. PASP 125, pp. 306–312. External Links: 1202.3665, Document Cited by: §4.2.
- An Extremely Massive Quiescent Galaxy at z = 3.493: Evidence of Insufficiently Rapid Quenching Mechanisms in Theoretical Models. ApJ 890 (1), pp. L1. External Links: Document, 1910.10158 Cited by: §1.
- A massive, evolved slow-rotating galaxy in the early Universe. arXiv e-prints, pp. arXiv:2508.10987. External Links: Document, 2508.10987 Cited by: Figure 7, Figure 7, Figure 8, Figure 8, §5.3.
- The SINS/zC-SINF Survey of z 2 Galaxy Kinematics: SINFONI Adaptive Optics-assisted Data and Kiloparsec-scale Emission-line Properties. ApJS 238 (2), pp. 21. External Links: Document, 1802.07276 Cited by: §5.3.
- Star-Forming Galaxies at Cosmic Noon. ARA&A 58, pp. 661–725. External Links: Document, 2010.10171 Cited by: §1.
- Fast rotating and low-turbulence discs at z ≃ 4.5: Dynamical evidence of their evolution into local early-type galaxies. A&A 647, pp. A194. External Links: Document, 2011.05340 Cited by: §5.2.
- Study of the 50 kpc circumgalactic environment around the merger system J2057-0030 at z 4.6 using ALMA. A&A 687, pp. A62. External Links: Document, 2404.11658 Cited by: §5.2.
- The James Webb Space Telescope Mission. PASP 135 (1048), pp. 068001. External Links: Document, 2304.04869 Cited by: §1.
- Rotation Curves in z 1-2 Star-forming Disks: Evidence for Cored Dark Matter Distributions. ApJ 902 (2), pp. 98. External Links: Document, 2006.03046 Cited by: §5.3.
- ALMA reveals a warm and compact starburst around a heavily obscured supermassive black hole at z = 4.75. A&A 562, pp. A67. External Links: Document, 1312.1248 Cited by: §5.2.
- A massive galaxy that formed its stars at z 11. Nature 628 (8007), pp. 277–281. External Links: Document, 2308.05606 Cited by: §1, §5.1.2.
- A massive, quiescent galaxy at a redshift of 3.717. Nature 544 (7648), pp. 71–74. External Links: Document, 1702.01751 Cited by: Appendix E.
- Ensemble samplers with affine invariance. Communications in applied mathematics and computational science 5 (1), pp. 65–80. Cited by: §4.2.
- SDSS-IV MaNGA: stellar angular momentum of about 2300 galaxies: unveiling the bimodality of massive galaxy properties. MNRAS 477 (4), pp. 4711–4737. External Links: Document, 1802.08213 Cited by: §1.
- On the Infall of Matter Into Clusters of Galaxies and Some Effects on Their Evolution. ApJ 176, pp. 1. External Links: Document Cited by: §1.
- Recovering and V/ from seeing-dominated IFS data. MNRAS 497 (2), pp. 2018–2038. External Links: Document, 2006.12730 Cited by: §4.4.3.
- AGN outflows and feedback twenty years on. Nature Astronomy 2, pp. 198–205. External Links: Document, 1802.10306 Cited by: §1.
- The first quiescent galaxies in tng300. Monthly Notices of the Royal Astronomical Society 522 (2), pp. 3138–3144. External Links: ISSN 0035-8711, Document, Link, https://academic.oup.com/mnras/article-pdf/522/2/3138/50171246/stad1162.pdf Cited by: §1.
- ZF-UDS-7329: A relic galaxy in the early Universe. A&A 694, pp. L7. External Links: Document, 2501.06050 Cited by: §5.1.2.
- How do minor mergers promote inside-out growth of ellipticals, transforming the size, density profile and dark matter fraction?. MNRAS 429 (4), pp. 2924–2933. External Links: Document, 1206.5004 Cited by: §5.1.1.
- Relaxation and stripping - The evolution of sizes, dispersions and dark matter fractions in major and minor mergers of elliptical galaxies. MNRAS 425 (4), pp. 3119–3136. External Links: Document, 1206.1597 Cited by: §5.1.1.
- A Cosmological Framework for the Co-Evolution of Quasars, Supermassive Black Holes, and Elliptical Galaxies. I. Galaxy Mergers and Quasar Activity. ApJS 175 (2), pp. 356–389. External Links: Document, 0706.1243 Cited by: §1.
- NOEMA confirmation of an optically dark ALMA-AzTEC submillimetre galaxy at z = 5.24. A late-stage starburst prior to quenching. A&A 659, pp. A154. External Links: Document, 2112.09026 Cited by: §5.2.
- Size–Stellar Mass Relation and Morphology of Quiescent Galaxies at z 3 in Public JWST Fields. ApJ 964 (2), pp. 192. External Links: Document, 2307.06994 Cited by: §5.1.2.
- The Near-Infrared Spectrograph (NIRSpec) on the James Webb Space Telescope. I. Overview of the instrument and its capabilities. A&A 661, pp. A80. External Links: Document, 2202.03305 Cited by: §2.
- The VISTA Deep Extragalactic Observations (VIDEO) survey. MNRAS 428 (2), pp. 1281–1295. External Links: Document, 1206.4263 Cited by: Figure 7, Figure 7.
- Extended hot dust emission around the earliest massive quiescent galaxy. arXiv e-prints, pp. arXiv:2409.17233. External Links: Document, 2409.17233 Cited by: §1, §5.1.1.
- JADES: Rest-frame UV-to-NIR Size Evolution of Massive Quiescent Galaxies from Redshift z=5 to z=0.5. arXiv e-prints, pp. arXiv:2401.00934. External Links: Document, 2401.00934 Cited by: §5.1.2.
- JADES + JEMS: A Detailed Look at the Buildup of Central Stellar Cores and Suppression of Star Formation in Galaxies at Redshifts 3 < z < 4.5. ApJ 974 (1), pp. 135. External Links: Document, 2305.18518 Cited by: §3.1.1, §5.1.2.
- Evaluating the ability of triaxial Schwarzschild modelling to estimate properties of galaxies from the Illustris simulation. MNRAS 486 (4), pp. 4753–4772. External Links: Document, 1904.12942 Cited by: §4.2.
- Stellar Mass-Size Relation and Morphology of Massive Quiescent Galaxies at with JWST. arXiv e-prints, pp. arXiv:2505.03089. External Links: Document, 2505.03089 Cited by: §4.4.1.
- How do galaxies get their gas?. Monthly Notices of the Royal Astronomical Society 363 (1), pp. 2–28. External Links: ISSN 0035-8711, Document, Link, https://academic.oup.com/mnras/article-pdf/363/1/2/4126209/363-1-2.pdf Cited by: §1.
- Blowing Out the Candle: How to Quench Galaxies at High Redshift—An Ensemble of Rapid Starbursts, AGN Feedback, and Environment. ApJ 979 (1), pp. 15. External Links: Document, 2310.16085 Cited by: §1, §5.1.2, §5.2.
- Dark Matter Halos in the Standard Cosmological Model: Results from the Bolshoi Simulation. ApJ 740 (2), pp. 102. External Links: Document, 1002.3660 Cited by: §4.2.
- On the variation of the initial mass function. MNRAS 322 (2), pp. 231–246. External Links: Document, astro-ph/0009005 Cited by: §5.1.2.
- Broad-line region geometry from multiple emission lines in a single-epoch spectrum. A&A 684, pp. A52. External Links: Document, 2401.12396 Cited by: §4.4.1.
- The ATLAS 3D project - XII. Recovery of the mass-to-light ratio of simulated early-type barred galaxies with axisymmetric dynamical models. MNRAS 424 (2), pp. 1495–1521. External Links: Document, 1206.0291 Cited by: §4.2.
- Quenching massive galaxies across cosmic time with the semi-analytic model shark v2.0. Monthly Notices of the Royal Astronomical Society 531 (3), pp. 3551–3578. External Links: ISSN 0035-8711, Document, Link, https://academic.oup.com/mnras/article-pdf/531/3/3551/58211224/stae1024.pdf Cited by: §1.
- Effects of AGN feedback on CDM galaxies. MNRAS 388 (2), pp. 587–602. External Links: Document, 0805.1930 Cited by: §1.
- Molecular hydrogen abundances of galaxies in the EAGLE simulations. MNRAS 452 (4), pp. 3815–3837. External Links: Document, 1503.04807 Cited by: §5.2.
- The diverse nature and formation paths of slow rotator galaxies in the EAGLE simulations. MNRAS 509 (3), pp. 4372–4391. External Links: Document, 2012.08060 Cited by: 3rd item.
- Quantifying the impact of mergers on the angular momentum of simulated galaxies. MNRAS 473 (4), pp. 4956–4974. External Links: Document, 1701.04407 Cited by: §5.1.2, §5.2.
- The diverse star formation histories of early massive, quenched galaxies in modern galaxy formation simulations. MNRAS 536 (3), pp. 2324–2354. External Links: Document, 2409.16916 Cited by: §1, §1.
- The EDGE-CALIFA survey: validating stellar dynamical mass models with CO kinematics. MNRAS 477 (1), pp. 254–292. External Links: Document, 1803.02259 Cited by: §4.2.
- In situ versus ex situ drivers of galaxy quenching: critical black hole mass and main sequence universality in the FLAMINGO simulation. MNRAS 543 (3), pp. 2204–2221. External Links: Document, 2504.02027 Cited by: §1.
- Efficient NIRCam Selection of Quiescent Galaxies at 3 < z < 6 in CEERS. ApJ 970 (1), pp. 68. External Links: Document, 2305.04662 Cited by: §1.
- Tracing the evolutionary pathways of dust and cold gas in high-z quiescent galaxies with SIMBA. A&A 693, pp. A118. External Links: Document, 2404.10568 Cited by: §6.
- First light and reionisation epoch simulations (flares) – viii. the emergence of passive galaxies at z ≥ 5. Monthly Notices of the Royal Astronomical Society 525 (4), pp. 5520–5539. External Links: ISSN 0035-8711, Document, Link, https://academic.oup.com/mnras/article-pdf/525/4/5520/51606230/stad2550.pdf Cited by: §1.
- MaNGA DynPop - V. The dark-matter fraction versus stellar velocity dispersion relation and stellar initial mass function variations in galaxies: dynamical models and full spectrum fitting of integral-field spectroscopy. MNRAS 530 (4), pp. 4474–4492. External Links: Document, 2309.12395 Cited by: §5.1.1.
- Numerical convergence of simulations of galaxy formation: the abundance and internal structure of cold dark matter haloes. MNRAS 488 (3), pp. 3663–3684. External Links: Document, 1812.05777 Cited by: Table 7, Table 7, Appendix E, Appendix E.
- Evidence of strong quasar feedback in the early Universe. MNRAS 425 (1), pp. L66–L70. External Links: Document, 1204.2904 Cited by: §1, §1.
- INSPIRE: INvestigating Stellar Population In RElics - VI. The low-mass end slope of the stellar initial mass function and chemical composition. MNRAS 531 (2), pp. 2864–2880. External Links: Document, 2401.15769 Cited by: §5.1.2.
- Star formation quenching in massive galaxies. Nature Astronomy 2 (9), pp. 695–697. External Links: ISSN 2397-3366, Link, Document Cited by: §1.
- The THESAN-ZOOM project: central starbursts and inside-out quenching govern galaxy sizes in the early Universe. MNRAS 544 (2), pp. 1732–1747. External Links: Document, 2503.04894 Cited by: §5.1.2.
- The atlas3d project – xxx. star formation histories and stellar population scaling relations of early-type galaxies. Monthly Notices of the Royal Astronomical Society 448 (4), pp. 3484–3513. External Links: ISSN 0035-8711, Document, Link, https://academic.oup.com/mnras/article-pdf/448/4/3484/13771073/stv105.pdf Cited by: §1.
- The evolution of the galaxy stellar-mass function over the last 12 billion years from a combination of ground-based and HST surveys. MNRAS 503 (3), pp. 4413–4435. External Links: Document, 2009.03176 Cited by: §1.
- The Kinematics of Massive Quiescent Galaxies at 1.4 < z < 2.1: Dark Matter Fractions, IMF Variation, and the Relation to Local Early-type Galaxies. ApJ 899 (1), pp. 87. External Links: Document, 2006.13949 Cited by: §5.1.1.
- Equation of State Calculations by Fast Computing Machines. J. Chem. Phys. 21 (6), pp. 1087–1092. External Links: Document Cited by: §4.2.
- A population of faint, old, and massive quiescent galaxies at 3<z<4 revealed by jwst nirspec spectroscopy. Scientific Reports 14 (1). External Links: ISSN 2045-2322, Link, Document Cited by: §1.
- The Formation Histories of Massive and Quiescent Galaxies in the 3 < z < 4.5 Universe. ApJ 981 (1), pp. 78. External Links: Document, 2410.02076 Cited by: §4.4.1.
- The Structure of Cold Dark Matter Halos. ApJ 462, pp. 563. External Links: Document, astro-ph/9508025 Cited by: §4.2, §4.2.
- The IllustrisTNG simulations: public data release. Computational Astrophysics and Cosmology 6 (1), pp. 2. External Links: Document, 1812.05609 Cited by: Appendix E.
- Resolving Quiescent Galaxies at z 2. I. Search for Gravitationally Lensed Sources and Characterization of Their Structure, Stellar Populations, and Line Emission. ApJ 862 (2), pp. 125. External Links: Document, 1806.06814 Cited by: §5.3.
- Resolving Quiescent Galaxies at z 2. II. Direct Measures of Rotational Support. ApJ 862 (2), pp. 126. External Links: Document, 1806.06815 Cited by: Figure 7, Figure 7, Figure 8, Figure 8, §5.2, §5.3, §5.3, 3rd item.
- A stellar dynamical mass measure of an inactive black hole in the distant universe. arXiv e-prints, pp. arXiv:2503.17478. External Links: 2503.17478 Cited by: §5.3.
- Dry Mergers and the Formation of Early-Type Galaxies: Constraints from Lensing and Dynamics. ApJ 703 (2), pp. 1531–1544. External Links: Document, 0908.1621 Cited by: §5.1.1.
- Widespread Rapid Quenching at Cosmic Noon Revealed by JWST Deep Spectroscopy. ApJ 976 (1), pp. 72. External Links: Document, 2404.17945 Cited by: Appendix E, §1, §5.2.
- ALMA hints at the presence of turbulent disk galaxies at z > 5. A&A 673, pp. A153. External Links: Document, 2304.00036 Cited by: §5.2.
- Pysersic: a python package for determining galaxy structural properties via bayesian inference, accelerated with jax. Journal of Open Source Software 8 (89), pp. 5703. External Links: Document, Link Cited by: §3.1.1.
- Nature 521 (7551), pp. 192–195. External Links: Document, 1505.03143 Cited by: §1.
- Accelerated quenching and chemical enhancement of massive galaxies in a z 4 gas-rich halo. Nature Astronomy 9, pp. 1240–1255. External Links: Document, 2405.03744 Cited by: §1.
- GA-NIFS: The ultra-dense, interacting environment of a dual AGN at z 3.3 revealed by JWST/NIRSpec IFS. A&A 679, pp. A89. External Links: Document, 2304.06756 Cited by: §2.1.
- Simulating galaxy formation with the IllustrisTNG model. MNRAS 473 (3), pp. 4077–4106. External Links: Document, 1703.02970 Cited by: Appendix E.
- On the quenching of star formation in observed and simulated central galaxies: evidence for the role of integrated AGN feedback. MNRAS 512 (1), pp. 1052–1090. External Links: Document, 2112.07672 Cited by: §1.
- A&A 641, pp. A6. External Links: Document, 1807.06209 Cited by: §1.
- Constraining the major merger history of z ~3-9 galaxies using JADES: dominant in situ star formation. MNRAS 540 (3), pp. 2146–2175. External Links: Document, 2502.01721 Cited by: §5.1.2.
- Improved Reference Sampling and Subtraction: A Technique for Reducing the Read Noise of Near-infrared Detector Systems. PASP 129 (980), pp. 105003. External Links: Document, 1707.09387 Cited by: §2.
- Relight the Candle: What Happens to High-redshift Massive Quenched Galaxies. ApJ 982 (1), pp. 30. External Links: Document, 2310.16089 Cited by: Appendix E.
- COLDz: A High Space Density of Massive Dusty Starburst Galaxies 1 Billion Years after the Big Bang. ApJ 895 (2), pp. 81. External Links: Document, 2004.10204 Cited by: §5.2.
- JADES Initial Data Release for the Hubble Ultra Deep Field: Revealing the Faint Infrared Sky with Deep JWST NIRCam Imaging. ApJS 269 (1), pp. 16. External Links: Document, 2306.02466 Cited by: §3.1.1.
- The Science Performance of JWST as Characterized in Commissioning. PASP 135 (1046), pp. 048001. External Links: Document, 2207.05632 Cited by: §1.
- A dynamically cold disk galaxy in the early Universe. Nature 584 (7820), pp. 201–204. External Links: Document, 2009.01251 Cited by: §5.2.
- Dynamical properties of z 4.5 dusty star-forming galaxies and their connection with local early-type galaxies. MNRAS 507 (3), pp. 3952–3984. External Links: Document, 2102.05671 Cited by: §5.2.
- The evolution of the cold interstellar medium in galaxies following a starburst. MNRAS 448 (1), pp. 258–279. External Links: Document, 1412.6090 Cited by: §1.
- The origin of discs and spheroids in simulated galaxies. MNRAS 423 (2), pp. 1544–1555. External Links: Document, 1112.2220 Cited by: 3rd item, §4.4.4, §4.4.4.
- The Luminosity Function and Stellar Evolution.. ApJ 121, pp. 161. External Links: Document Cited by: §3.2.
- Monthly Notices of the Royal Astronomical Society 371 (2), pp. 703–718. External Links: ISSN 0035-8711, Document Cited by: §3.2.
- The COLIBRE project: cosmological hydrodynamical simulations of galaxy formation and evolution. arXiv e-prints, pp. arXiv:2508.21126. External Links: Document, 2508.21126 Cited by: Appendix E.
- The EAGLE project: simulating the evolution and assembly of galaxies and their environments. MNRAS 446 (1), pp. 521–554. External Links: Document, 1407.7040 Cited by: Appendix E, Appendix E.
- The FLAMINGO project: cosmological hydrodynamical simulations for large-scale structure and galaxy cluster surveys. MNRAS 526 (4), pp. 4978–5020. External Links: Document, 2306.04024 Cited by: Appendix E.
- Net-zero gas inflow: deconstructing the gas consumption history of a massive quiescent galaxy with JWST and ALMA. arXiv e-prints, pp. arXiv:2405.19401. External Links: Document, 2405.19401 Cited by: Appendix E, §1, §5.2.
- Kinematics of simulated galaxies - I. Connecting dynamical and morphological properties of early-type galaxies at different redshifts. MNRAS 480 (4), pp. 4636–4658. External Links: Document, 1802.01583 Cited by: 7th item.
- A numerical model for a triaxial stellar system in dynamical equilibrium.. ApJ 232, pp. 236–247. External Links: Document Cited by: §4.2.
- Atlas de Galaxias Australes. Cited by: §3.1.1.
- UNCOVER NIRSpec/PRISM Spectroscopy Unveils Evidence of Early Core Formation in a Massive, Centrally Dusty Quiescent Galaxy at z = 3.97. ApJ 974 (1), pp. 145. External Links: Document, 2402.05664 Cited by: §1.
- Testing star formation laws on spatially resolved regions in a z 4.3 starburst galaxy. MNRAS 487 (3), pp. 4305–4312. External Links: Document, 1906.01173 Cited by: §5.2.
- MNRAS 454 (2), pp. 1332–1357. External Links: Document, 1508.05009 Cited by: §5.1.1.
- A&A 331, pp. L1–L4. External Links: Document, astro-ph/9801013 Cited by: §1, §1.
- Behind the dust veil: A panchromatic view of an optically dark galaxy at z = 4.82. A&A 693, pp. A309. External Links: Document, 2412.09363 Cited by: §5.2.
- Kinematic Downsizing at z 2. ApJ 830 (1), pp. 14. External Links: Document, 1606.00009 Cited by: §5.3.
- Fast rotators at cosmic noon: Stellar kinematics for 15 quiescent galaxies from JWST-SUSPENSE. A&A 702, pp. A110. External Links: Document, 2506.04310 Cited by: Figure 7, Figure 7, Figure 8, Figure 8.
- ARA&A 53, pp. 51–113. External Links: Document, 1412.2712 Cited by: §1.
- First results from the IllustrisTNG simulations: matter and galaxy clustering. MNRAS 475 (1), pp. 676–698. External Links: Document, 1707.03397 Cited by: Appendix E.
- Dissecting the Size-Mass and -Mass Relations at 1.0 < z < 2.5: Galaxy Mass Profiles and Color Gradients as a Function of Spectral Shape. ApJ 915 (2), pp. 87. External Links: Document, 2101.05820 Cited by: §4.2.
- Minor Merger Growth in Action: JWST Detects Faint Blue Companions around Massive Quiescent Galaxies at 0.5 z 3.0. ApJ 956 (2), pp. L42. External Links: Document, 2307.14209 Cited by: §1.
- JADES: Resolving the Stellar Component and Filamentary Overdense Environment of Hubble Space Telescope (HST)-dark Submillimeter Galaxy HDF850.1 at z = 5.18. ApJ 961 (1), pp. 69. External Links: Document, 2309.04529 Cited by: §5.2.
- Low Star Formation Activity and Low Gas Content of Quiescent Galaxies at z = 3.5-4.0 Constrained with ALMA. ApJ 936 (1), pp. 61. External Links: Document, 2206.14238 Cited by: Appendix E, §5.2.
- Science 348 (6232), pp. 314–317. External Links: Document, 1504.04021 Cited by: §5.1.2, §5.1.2.
- A Redshift-independent Efficiency Model: Star Formation and Stellar Masses in Dark Matter Halos at z 4. ApJ 868 (2), pp. 92. External Links: Document, 1806.03299 Cited by: §1.
- Fast, Slow, Early, Late: Quenching Massive Galaxies at z 0.8. ApJ 926 (2), pp. 134. External Links: Document, 2102.12494 Cited by: §1.
- The confinement of star-forming galaxies into a main sequence through episodes of gas compaction, depletion and replenishment. MNRAS 457 (3), pp. 2790–2813. External Links: Document, 1509.02529 Cited by: §5.1.2.
- Morphology and star formation in IllustrisTNG: the build-up of spheroids and discs. MNRAS 487 (4), pp. 5416–5440. External Links: Document, 1904.12860 Cited by: §5.1.2, 3rd item.
- Dust and gas in luminous proto-cluster galaxies at z = 4.05: the case for different cosmic dust evolution in normal and starburst galaxies. A&A 569, pp. A98. External Links: Document, 1403.7992 Cited by: §5.2.
- The relationship between the morphology and kinematics of galaxies and its dependence on dark matter halo structure in eagle. Monthly Notices of the Royal Astronomical Society 485 (1), pp. 972–987. External Links: ISSN 0035-8711, Document, Link, https://academic.oup.com/mnras/article-pdf/485/1/972/27985061/stz448.pdf Cited by: §1.
- Environment and self-regulation in galaxy formation. Monthly Notices of the Royal Astronomical Society 404 (4), pp. 1775–1789. External Links: ISSN 0035-8711, Document, Link, https://academic.oup.com/mnras/article-pdf/404/4/1775/3777097/mnras0404-1775.pdf Cited by: §1.
- A massive, dead disk galaxy in the early Universe. Nature 546 (7659), pp. 510–513. External Links: Document, 1706.07030 Cited by: §5.2.
- NGC 1277: A Massive Compact Relic Galaxy in the Nearby Universe. ApJ 780 (2), pp. L20. External Links: Document, 1310.6367 Cited by: §5.1.2.
- Age-dating early quiescent galaxies: high star formation efficiency, but consistent with direct, higher-redshift observations. MNRAS 537 (2), pp. 1826–1848. External Links: Document, 2410.05377 Cited by: §1.
- An atlas of color-selected quiescent galaxies at z > 3 in public jwst fields. The Astrophysical Journal 947 (1), pp. 20. External Links: Document, Link Cited by: Appendix E, §1, §1.
- The SAMI Galaxy Survey: revising the fraction of slow rotators in IFS galaxy surveys. MNRAS 472 (2), pp. 1272–1285. External Links: Document, 1707.03402 Cited by: Figure 7, Figure 7.
- A relation between the characteristic stellar ages of galaxies and their intrinsic shapes. Nature Astronomy 2, pp. 483–488. External Links: Document, 1804.07769 Cited by: §1.
- The Einstein Cross: Constraint on Dark Matter from Stellar Dynamics and Gravitational Lensing. ApJ 719 (2), pp. 1481–1496. External Links: Document, 0807.4175 Cited by: §4.2.
- Deprojecting Sérsic Profiles for Arbitrary Triaxial Shapes: Robust Measures of Intrinsic and Projected Galaxy Sizes. ApJ 914 (1), pp. 45. External Links: Document, 2104.01810 Cited by: Appendix E.
- Dynamical models of elliptical galaxies in z = 0.5 clusters. i. data-model comparison and evolution of galaxy rotation. The Astrophysical Journal 668 (2), pp. 738. External Links: Document, Link Cited by: §4.2.
- THE vlt lega-c spectroscopic survey: the physics of galaxies at a lookback time of 7 gyr. The Astrophysical Journal Supplement Series 223 (2), pp. 29. External Links: Document, Link Cited by: §4.4.1.
- The Mass Scale of High-redshift Galaxies: Virial Mass Estimates Calibrated with Stellar Dynamical Models from LEGA-C. ApJ 936 (1), pp. 9. External Links: Document, 2208.12605 Cited by: §4.3, §4.3.
- Stellar Dynamical Models for 797 z 0.8 Galaxies from LEGA-C. ApJ 923 (1), pp. 11. External Links: Document, 2108.08142 Cited by: §3.1, §4.2, §4.4.1, Figure 8, Figure 8.
- Probing galaxy evolution from z = 0 to z ≃ 10 through galaxy scaling relations in three L-GALAXIES flavours. MNRAS 536 (1), pp. 777–806. External Links: Document, 2408.00824 Cited by: §1, §1.
- The MASSIVE Survey - VII. The relationship of angular momentum, stellar mass and environment of early-type galaxies. MNRAS 471 (2), pp. 1428–1445. External Links: Document, 1703.08573 Cited by: Figure 7, Figure 7.
- The MASSIVE Survey - V. Spatially resolved stellar angular momentum, velocity dispersion, and higher moments of the 41 most massive local early-type galaxies. MNRAS 464 (1), pp. 356–384. External Links: Document, 1609.00391 Cited by: Figure 7, Figure 7.
- A&ARv 28 (1), pp. 2. External Links: Document, 2002.07765 Cited by: §1.
- RUBIES Reveals a Massive Quiescent Galaxy at z = 7.3. ApJ 983 (1), pp. 11. External Links: Document, 2409.03829 Cited by: §1, §1, §5.1.2, §5.1.2.
- The data analysis pipeline for the sdss-iv manga ifu galaxy survey: overview. AJ 158 (6), pp. 231. External Links: Document, 1901.00856 Cited by: §3.2.
- Quenching of star formation from a lack of inflowing gas to galaxies. Nature 597 (7877), pp. 485–488. External Links: Document, 2109.10384 Cited by: §1.
- Core condensation in heavy halos: a two-stage theory for galaxy formation and clustering. Monthly Notices of the Royal Astronomical Society 183 (3), pp. 341–358. External Links: ISSN 0035-8711, Document, Link, https://academic.oup.com/mnras/article-pdf/183/3/341/2943374/mnras183-0341.pdf Cited by: §1.
- ALMA Measures Rapidly Depleted Molecular Gas Reservoirs in Massive Quiescent Galaxies at z 1.5. ApJ 908 (1), pp. 54. External Links: Document, 2012.01433 Cited by: §1.
- The Absolute Magnitude of the Sun in Several Filters. ApJS 236 (2), pp. 47. External Links: Document, 1804.07788 Cited by: §3.1.2.
- The KMOS Survey: Data Release and Final Survey Paper. ApJ 886 (2), pp. 124. External Links: Document, 1909.11096 Cited by: §5.3.
- The KMOS Survey: Design, First Results, and the Evolution of Galaxy Kinematics from 0.7 <= z <= 2.7. ApJ 799 (2), pp. 209. External Links: Document, 1409.6791 Cited by: §5.3.
- Molecular Gas Reservoirs in Massive Quiescent Galaxies at z 0.7 Linked to Late-time Star Formation. ApJ 940 (1), pp. 39. External Links: Document, 2210.03832 Cited by: §1.
- Remarkably Compact Quiescent Candidates at 3 < z < 5 in JWST-CEERS. ApJ 964 (1), pp. L10. External Links: Document, 2311.05394 Cited by: §5.1.2.
- Gravitational Lens Statistics for Generalized NFW Profiles: Parameter Degeneracy and Implications for Self-Interacting Cold Dark Matter. ApJ 555 (1), pp. 504–523. External Links: Document, astro-ph/0007354 Cited by: §4.2.
- The First Quenched Galaxies: When and How?. ApJ 966 (1), pp. L2. External Links: Document, 2402.01314 Cited by: §1.
- Inclination of broad line region in narrow line and broad line seyfert 1 galaxies. Chinese Journal of Astronomy and Astrophysics 2 (6), pp. 487. External Links: Document, Link Cited by: §4.4.1.
- RUBIES spectroscopically confirms the high number density of quiescent galaxies from . arXiv e-prints, pp. arXiv:2508.08577. External Links: Document, 2508.08577 Cited by: §1.
- MaNGA DynPop - I. Quality-assessed stellar dynamical modelling from integral-field spectroscopy of 10K nearby galaxies: a catalogue of masses, mass-to-light ratios, density profiles, and dark matter. MNRAS 522 (4), pp. 6326–6353. External Links: Document, 2304.11711 Cited by: §4.2, Figure 7, Figure 7.
- Discovery of a Unique Close Quasar–DSFG Pair Linked by a [C II] Bridge at z = 5.63. Research Notes of the American Astronomical Society 8 (11), pp. 284. External Links: Document, 2411.06698 Cited by: §5.2.
- Compaction and quenching of high-z galaxies in cosmological simulations: blue and red nuggets. MNRAS 450 (3), pp. 2327–2353. External Links: Document, 1412.4783 Cited by: §5.1.2.
1 Kavli Institute for Cosmology, University of Cambridge, Madingley Road, Cambridge CB3 0HA, UK
2 Cavendish Laboratory – Astrophysics Group, University of Cambridge, 19 JJ Thomson Avenue, Cambridge CB3 0HE, UK
3 Department of Physics and Astronomy, University College London, Gower Street, London WC1E 6BT, UK
4 Sub-Department of Astrophysics, Department of Physics, University of Oxford, Denys Wilkinson Building, Keble Road, Oxford, OX1 3RH, UK
5 International Centre for Radio Astronomy Research, The University of Western Australia, 35 Stirling Highway, Crawley,
Western Australia 6009, Australia
6 ARC Centre for All-Sky Astrophysics in 3 Dimensions (ASTRO 3D)
7 Max-Planck-Institut für extraterrestrische Physik (MPE), Gießenbachstraße 1, 85748 Garching, Germany
8 INAF - Osservatorio Astrofisico di Arcetri, Largo E. Fermi 5, I-50125, Firenze, Italy
9 Centro de Astrobiología (CAB), CSIC-INTA, Cra. de Ajalvir Km. 4, 28850- Torrejón de Ardoz, Madrid, Spain
10 Sterrenkundig Observatorium, Universiteit Gent, Krijgslaan 281 S9, 9000 Gent, Belgium
11 NSF National Optical-Infrared Astronomy Research Laboratory, 950 North Cherry Avenue, Tucson, AZ 85719, USA
12 Steward Observatory, University of Arizona, 933 North Cherry Avenue, Tucson, AZ 85719, USA
13 Max-Planck -Institut für Astronomie, Königstuhl 17, Heidelberg, Germany
14 Max Planck Institute for Astrophysics, Karl-Schwarzschild-Str. 1, 85741 Garching bei München, Germany
15 Ludwig-Maximilians-Universität München, Geschwister-Scholl-Platz 1, 80539 München, Germany
16 Department of Astronomy, University of Wisconsin-Madison, Madison, WI 53706, USA
17 Institute for Astronomy, University of Edinburgh, Royal Observatory, Edinburgh, EH9 3HJ, UK
18 Sorbonne Université, CNRS, UMR 7095, Institut d’Astrophysique de Paris, 98 bis bd Arago, 75014 Paris, France
19 Scuola Normale Superiore, Piazza dei Cavalieri 7, I-56126 Pisa, Italy
Appendix A Best-fit parameters from PySersic Photometry Fitting
These tables present the best-fit parameters that we obtain from PySersic photometry fitting of the galaxy image in NIRCam’s F200W filter. The first table gives the parameters obtained using the Laplace sampling method of retrieving the best-fit parameters from the chains’ samples. In general, the SVI flow method is more reliable and accurate so we chose to use these values in our subsequent analysis. For the data reported in Table 3, we use a prior assumption of a simple Sérsic profile across all the galaxy.
| parameter | Value |
|---|---|
| observed ellipticity | |
| Sérsic index | |
| (arcsec) | |
| (deg) |
Appendix B JAM Dynamical Model Test for the central Black Hole mass

This alternative dynamical model (Alternative-1) is a simple mass-follows-light (MFL) model (i.e. no dark matter component) with an additional central BH mass (). As we can remark from Fig. 9, we cannot pose tight constraints on but we are able to reject central black holes with masses: at level (97.7%) and at level (99.9%).
Using and , the radius of the sphere of influence of the black hole is about 7.7 mas, 6.5 times below the pixel resolution of our IFU data (). This angular resolution limitation is the main reason for which we can only infer an upper black hole mass for GS-9209. The inferred stellar mass is , in remarkable agreement with the value obtained from the Fiducial dynamical model (see Sec. 4.2).
| Parameter | Value | Model |
|---|---|---|
| Alternative-1 | ||
| Alternative-1 | ||
| < 9.27 () | Alternative-1 | |
| Alternative-1 |
Appendix C JAM Dynamical Model Test with Tangential Anisotropy
In this case, we use a dynamical model similar to our Fiducial model: classical NFW Dark Matter Halo density profile, but this time we fit instead of . We adopt Gaussian priors on all the parameters to be fitted, as explain in the caption of Fig. 10. As this figure shows, Alternative-2 dynamical model constrains the tangential anisotropy to be . This quantity is important because it is used in de-projection calculations.
.
| parameter | Best-fit Value |
|---|---|

Appendix D JAM Dynamical Model Test with a Gaussian Prior on the Intrinsic Axial Ratio

. parameter Best-fit Value
This dynamical model fits and it is similar to the Fiducial model, the only difference being the fact that now we introduce a Gaussian prior on (in addition to the already existing prior on the central BH mass). The reason for this test is to probe to what extent the predictions on that are purely based on our data alone can win against a physically motivated prior. The results of Alternative-3 dynamical model fitting are given in Table 6.
Appendix E Dark Matter Content - Comparison with the TNG-50 simulations

| Simulation box | (pc) |
| TNG50-1 | 233 |
| TNG100-1 | 591 |
| Illustris-1 | 568 |
| Eagle - 100 cMpc box | 646 |
| Eagle - 25 cMpc box | 323 |
| Magneticum - uhr resolution | 1195 |
| Magneticum - xhr resolution | 447 |
| COLIBRE - L050m5 box | 301 |
| COLIBRE - L200m6 box | 601 |
| SIMBA | 1406 |
| FLAMINGO - best resolution | 2700 |
Based on their study of EAGLE hydrodynamical simulations (Schaye et al., 2015), Ludlow et al. (2019) propose the following criterion for simulated galaxies size convergence:
| (16) |
with being the mean spacing between dark matter particles, calculated using the equation and . The values for the threshold convergence radius for a number of TNG simulation boxes (Nelson et al., 2019), as well as for the EAGLE (Schaye et al., 2015), Illustris-1 (Pillepich et al., 2018; Springel et al., 2018), SIMBA (Davé et al., 2019), FLAMINGO (Schaye et al., 2023), Magneticum (Remus and Kimmig, 2025), and COLIBRE (Schaye et al., 2025) cosmological simulations, are given in Table 7. For GS-9209, the effective light radius is , which is below the convergence radius calculated using this criterion, for all simulations considered except for TNG50-1 (which has a convergence radius comparable to GS-9209 effective radius). This means that all the other simulations cannot accurately probe the existence and number densities of extremely compact, high-redshift MQGs, because the size convergence is uncertain for simulated galaxies which have . We will therefore focus on analysing the MQGs produced within the TNG50-1 simulation box.
We compare of GS-9209 with the values in the cases of simulated galaxies in the TNG50-1 box. However, these simulations compute the dark matter fraction within twice the stellar half mass radius (twice the radius enclosing half of the total stellar mass within a given subhalo). PySersic computed the projected effective light radius obtained from the galaxy’s photometry data in NIRCam/F200W band, . The first step is to use JAM dynamical modelling to compute the 3-dimensional intrinsic half light radius (the radius of a sphere enclosing half of the total light emitted over the entire volume of the galaxy) of GS-9209. This is done by using an entirely analogous procedure to jam_mge_half_light_radius. The latter computes the radius of a circle enclosing half of the light within the surface brightness Gaussian surfaces (characterised by , and using the same notations as in Section 3.1.2) from the MGE parametrisation of the galaxy’s Sérsic profile fitted by PySersic to the original image. Instead, we need to convert these surface brightness Gaussians to luminosity density Gaussians as we did in Section 4.4.4. The intrinsic luminosity density Gaussians are characterised by , and (with the same notations as in Equation 14). The integrated luminosity of a Gaussian is given by (equation 13 from Cappellari 2008):
| (17) |
The total luminosity of all the Gaussians is the sum of values. This allows us to compute the radial distance at which Gaussians within that aperture only add up to half the total luminosity. We obtain that, for GS-9209, where is the effective light radius from the F200W image. This is in good agreement with the findings highlighted in the top-left panel of figure 4 from van de Ven and van der Wel (2021) who determine similar values for the ratio between the 2-dimensional projected effective light radius and the 3-dimensional intrinsic counterpart. Because GS-9209 is a massive quiescent galaxy, it is reasonable to assume that its gas mass is negligible. Future studies using the G395H / F270LP spectrum from NIRSpec will allow us to quantify neutral gas in the galaxy’s interstellar medium, whereas ALMA could determine the amount of cold gas (or at least impose a stringent upper limit for the cold gas mass in GS-9209). Studies such as Scholtz et al. (2024) showed that for GS-10578, a MQG at , the CO-derived cold gas mass is less than 3% of its whereas D’Eugenio et al. (2024) determine that the neutral gas mass of GS-10578 is about (derived from NaD absorption). The upper limits found by Suzuki et al. (2022) on the gas fractions of 5 MQGs at and with are less stringent () but consistent with the general picture that high redshift MQGs are highly likely to contain very little cold gas. For these reasons, we can consider that stars are the only luminous component in our model of GS-9209. Assuming no spatial variation of the stellar mass-to-light ratio, it means that . This result is in agreement with the findings from figure 8 of de Graaff et al. (2022) based on galaxies from EAGLE simulations, who obtain that for the most compact galaxies in their sample, their photometry-based effective radii are typically slightly larger than the mass effective radii, but the difference is less than 0.1 dex.
In order to compute within we use the method outlined below. We chose the snapshot that is closest to the redshift of GS-9209, which has the ID “18” and redshift . We use the provided group catalogues to extract all the galaxy or halo properties needed in the subsequent analysis. Specifically, all the quantities we need at this point reside in the Subhalos data repositories (these are retrieved using the Subfind algorithm modified to account for the properties and behaviour of the galaxies’ baryonic component). For our analysis we only need the quantities that can be queried using the keywords: SubhaloMassInRadType, SubhaloHalfmassRadType, SubhaloMassType and SubhaloSFR. SubhaloFlag is used to eliminate possible artefacts from our sample. This is particularly important for our analysis because such contaminating subhalos are typically compact and baryon dominated (although usually more than 3 orders of magnitude less massive than GS-9209). They are not individual galaxies but clumps within genuine galaxies. The first keyword is used to extract, from the group catalogue, the masses for each component of a galaxy (gas, DM, stars + winds, BH) within , and hence to compute the DM fraction within this aperture . The total mass is obtained by adding up all the particles of all types within from the subhalo’s centre of mass. The second keyword gives the stellar half mass radii of the galaxies in each simulation. The units in the catalogue are ckpc/h so in order to convert to pkpc, we take h = 0.6774 (this value is adopted by TNG simulations) and we divide by . The SubhaloMassType keyword gives the masses of each component of a galaxy that is gravitationally bound to that subhalo. In our case we are only interested in the stellar mass.
The results of variation across the are shown in Fig. 12. This plot shows that the low dark matter content of GS-9209 is in good agreement with the values obtained in the case of its simulated counterparts. Furthermore, it is expected that we find a low amount of dark matter within two effective stellar half-mass radii for GS-9209 given its extremely compact size. Analysing the plot, we find that the TNG50-1 simulation cannot reproduce massive quiescent galaxies with similar stellar masses and effective radii to GS-9209 at .
Overall, GS-9209 occupies a notably different position on the mass-size plane than the majority of the population of quiescent galaxies in this simulation (marked as circles). By carefully analysing the high mass and low-effective radius end of the diagram (; ), we notice that there is only one compact MQG similar to GS-9209. This object has a slightly higher dark matter fraction of than the value we infer for GS-9209, but it is still unambiguously baryon dominated. This allows us to estimate the number density of compact massive quiescent galaxies (c-MQGs) like GS-9209 (as predicted by simulations): . This is approximately one order of magnitude below the calculated number densities values that were reported in various recent MQGs observational studies (e.g Glazebrook et al. 2017; Carnall et al. 2023a; Carnall et al. 2024; Valentino et al. 2023; Park et al. 2024). This result can be explained in two different ways, one of them being the claim that even highly performant cosmological full hydro-dynamical simulations with the best spatial resolution might be unable to fully capture the physical processes that govern the formation and evolution of c-MQGs in the early Universe. However, it is also likely that these simulations do not accurately reproduce compact galaxies, primarily because of size convergence caveats (for TNG50-1, is approximately equal to the effective light radius of GS-9209). Even if TNG50-1 can theoretically probe the regime of compact MQGs, it still struggles to reproduce the existence of objects similar to GS-9209, highlighting the need for building cosmological simulations that have both a large box volume () and good enough spatial resolution (; as defined based on the convergence criterion of Ludlow et al. 2019). This would be required in order to test whether the disagreement between the observed number densities of high- MQGs and the predictions of simulations is an issue related to number statistics and computational limitations of the simulations or, alternatively, if the physical mechanisms implemented need to be revised.
Appendix F JAM recovery tests of galaxy’s dynamical parameters
In this section we present some example recovery tests we conducted on our fiducial dynamical model used in the main text. For each of these runs in particular, we use jam_axi_proj routine to construct a model galaxy data based on a set of 4 parameters: the intrinsic axial ratio, , radial anisotropy ratio , the stellar mass to light ratio and the logarithmic dark matter fraction within one effective radius, . We have chosen that in this case we will not use the Gaussian prior on the central BH mass and instead just fix it to (for speeding up the computations). We perform the tests as follows:
- •
We start from the values of the parameters obtained for GS-9209 (Table 2). For each parameter, we run one recovery test.
- •
We vary only one parameter at a time. For instance, for the recovery test, all the other parameters besides are taken to be the values found in Table 2 (and the BH mass is taken as ). We then assign an arbitrary value for the parameter we want to test, sufficiently different from the value we had in the case of GS-9209 (e.g. in our example case that we described).
- •
We keep doing one such test per parameter per dynamical model. However we do not test for since this value cannot be constrained given the kinematics resolution we have. We test for all the other parameters instead. For the light distribution map we use the same values as obtained from the MgeFit in the case of GS-9209. We also use the same distance, same Voronoi bins rotated coordinates, same pixel scale as we did for GS-9209 (as keywords for jam_axi_proj).
- •
After initialising the set of parameters for a test, the next thing to do is to build the model galaxy kinematics using jam_axi_proj routine with no input data or error maps. We add the noise after creating the model galaxy using the same noise map as for GS-9209. We pass all of these to the JAM minimisation routine and we run adamet with steps (instead of as we did in the main text dynamical modelling). This is done in order to illustrate the validity of the recovery tests, of the models we used and to allow the computation of more dynamical models tested in a short time. Nevertheless, even in the case of the original dynamical models, the convergence is reached quickly enough that if we use steps in adamet instead of , this does not produce a noticeable difference in terms of the retrieved best-fit parameters from the posterior distribution.


