REDISCUSSION OF ECLIPSING BINARIES. PAPER XIV.
THE F-TYPE SYSTEM V570 PERSEI
By John Southworth
Astrophysics Group, Keele University, Staffordshire, ST5 5BG, UK
V570 Per is a binary star system containing two F-type stars in a 1.90 d period circular orbit. It shows shallow partial eclipses that were discovered from its Hipparcos light curve. We present an analysis of this system based on two sectors of high-quality photometry from the NASA Transiting Exoplanet Survey Satellite (TESS) mission, and published spectroscopic light ratio and radial velocity measurements. We find masses of and , and radii of and . The radius measurements are set by the spectroscopic light ratio and could be improved by obtaining a more precise light ratio. The eclipses in the TESS data arrived s later than expected, suggesting the presence of a faint third body on a wider orbit around the eclipsing system. Small trends in the residuals of the fit to the TESS lightcurve are attributed to weak starspots. The distance to the system is close to the Gaia DR3 value, but the Gaia spectroscopic orbit is in moderate disagreement with the results from the published ground-based data.
Introduction
Detached eclipsing binary stars (dEBs) are our main source of measurements of the physical properties of normal stars. The number of dEBs for which precise measurements are available is increasing gradually, as traced by reviews of this subject Popper80araa; Andersen91aarv; Torres++10aarv as well as compiled catalogues Malkov+06aa; Eker+14pasa; Me15aspc. The Detached Eclipsing Binary Catalogue (DEBCat** * https://www.astro.keele.ac.uk/jkt/debcat/, ref. Me15aspc) currently lists just over 300 dEBs for which masses and radii are measured to 2% precision or better, helped by the widespread availability of light curves from space telescopes Me21univ.
dEBs are useful in understanding the physical processes that govern the structure and evolution of stars. They have been used to calibrate the amount of convective core overshooting Andersen++90apj; ClaretTorres16aa; ClaretTorres18apj albeit with conflicting results ConstantinoBaraffe18aa, the size of the convective core in massive stars Tkachenko+20aa, mixing length Graczyk+16aa, and the radii of low-mass stars Torres13an; Jennings+23mn. They are also sources of distance measurements which have been used to calibrate the cosmological distance scale Pietrzynski+19nat; Freedman+20apj
We are currently pursuing a project to increase the number of dEBs with reliable measurements of their masses and radii Me20obs, primarily using new observations from the NASA Transiting Exoplanet Survey Satellite (TESS) mission Ricker+15jatis. TESS has observed thousands of dEBs IJspeert+21aa; JustesenAlbrecht21apj; Prsa+21apjs, many of which have available high-quality radial velocity (RV) measurements. In this context, we present an analysis of the V570 Persei system.
V570 Per (Table I) is an F-type dEB which was discovered using data from the Hipparcos satellite Vanleeuwen+97aa and given its variable-star name by Kazarovets et al. Kazarovets+99ibvs. It was selected for analysis by Munari et al. Munari+01aa in the context of assessing the expected performance of the Gaia satellite in the study of dEBs. These authors used the Hipparcos photometry of V570 Per along with ground-based spectroscopy restricted to the 850–875 nm wavelength range to mimic the expected characteristics of the Gaia observations. They measured the masses of the components of V570 Per to 2.5%, and the radii to low precisions of 10% and 25% due to the large scatter in the Hipparcos data and the shallow eclipses shown by this dEB. Tomasella et al. Tomasella+08aa2 (hereafter T08) presented a more detailed study of V570 Per based on new ground-based photometry, and the same spectroscopy but this time using the full available 450–948 nm wavelength range. They constrained the model of the light curve using spectroscopically-measured light contributions of the two stars in the -band. They determined the atmospheric parameters of the component stars via a fit of synthetic spectra to their observed spectra, a process which neglected the systematic errors inherent in this method.
| Property | Value | Reference |
| Right ascension (J2000) | 03:09:34.94 | Gaia21aa |
| Declination (J2000) | +48:38:28.7 | Gaia21aa |
| Henry Draper designation | HD 19457 | CannonPickering18anhar |
| Hipparcos designation | HIP 1673 | Hipparcos97 |
| Gaia DR3 designation | 435997252803241856 | Gaia21aa |
| Gaia DR3 parallax | mas | Gaia21aa |
| TESS Input Catalog designation | TIC 116991977 | Stassun+19aj |
| magnitude | Hog+00aa | |
| magnitude | Hog+00aa | |
| magnitude | Cutri+03book | |
| magnitude | Cutri+03book | |
| magnitude | Cutri+03book | |
| Spectral type | F3 V + F5 V | Tomasella+08aa2 |
Observational material

The TESS mission Ricker+15jatis observed V570 Per in sectors 18 (2019/11/02 to 2019/11/27) and 58 (2022/10/29 to 2022/11/26), in both cases in short cadence mode with a 120 s sampling rate. We used the lightkurve package Lightkurve18 to download these data and reject points flagged as bad. The simple aperture photometry (SAP) and pre-search data conditioning SAP (PDCSAP) data Jenkins+16spie are almost indistinguishable, so we used the SAP data in our analysis for consistency with previous papers in this series.
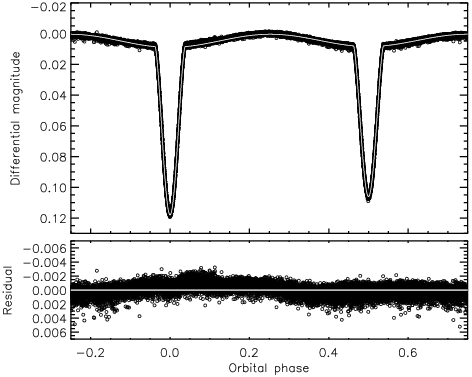
We converted the data to differential magnitude and subtracted the median magnitude for further analysis, ending up with 15 256 datapoints from sector 18 and 19 475 from sector 58. On further inspection we found that the first stretches of data from both halves of the sector 18 light curve were affected by instrumental systematics, so we trimmed them by removing data in the intervals [2458790.6,2458792.5] and [2458801.0,2458804.7]. This left a total of 32 719 datapoints over both TESS sectors (Fig. 1).
We queried the Gaia DR3 database†† † https://vizier.cds.unistra.fr/viz-bin/VizieR-3?-source=I/355/gaiadr3 for objects within 2 arcmin of V570 Per. A total of 108 were found, all of which are fainter than V570 Per by at least 7.2 mag in the Gaia band. We deduce that the amount of light contaminating the TESS aperture for this dEB is negligible.
Light curve analysis

We modelled the light curves from the two sectors both individually and together, using version 43 of the jktebop‡‡ ‡ http://www.astro.keele.ac.uk/jkt/codes/jktebop.html code Me++04mn2; Me13aa. In all cases the parameters of the fit included the fractional radii of the stars ( and ), expressed as their sum () and ratio (), the orbital inclination (), the central surface brightness ratio (), the ephemeris (period and reference time of primary minimum ) and the coefficients of the reflection effect. We define star A to be the one eclipsed at the deeper minimum and star B to be its companion. A circular orbit was assumed based on the appearance of the light curve and of the RVs presented by T08 – when allowing for an eccentric orbit we found a best-fitting eccentricity of and almost no change in the other parameters. We included a quadratic function versus time for each half-sector to account for slow changes in the brightness of the dEB due to instrumental effects.
The eclipses are partial and shallow, so the light curve solution suffers from a strong degeneracy between , and (e.g. refs. Torres+00aj and Me++07aa). This effect was found by T08 when modelling their ground-based photometry, and remains present in the much more extensive and higher-precision TESS data used in the current study. We therefore applied a spectroscopic light ratio as a constraint, in the same way as done in our work on V1022 Cas Me21obs2 and HD 23642 Me++23mn. The light contributions found by T08 correspond to a light ratio of in the -band. We propagated this to the TESS passband using the response function from Ricker et al. Ricker+15jatis, theoretical spectra from Allard et al. Allard++12rspta, and the effective temperature () values from T08, finding .
Limb darkening (LD) was included in the fit Me23obs2 using the power-2 law Hestroffer97aa and theoretical LD coefficients ClaretSouthworth22aa. Fitting for the scaling coefficient (“c” in the terminology of Maxted Maxted18aa) for both stars yielded determinate values and little change in the other parameters, so was adopted as the default approach.
The amount of third light () has a significant effect on the best-fitting parameter values. If fitted, it converges to a formally significant but unphysically negative value () despite the negligible amount of light from nearby stars (see previous section). We therefore fixed it at zero in our default solution, but added contributions to the errorbars based on the change in parameter values by assuming instead. For information, such an assumption decreases by 1.1% and increases by 0.4%.
The best fits to the light curves from the two sectors are shown in Figs. 2 and 3. These plots show the result of a fit to both sectors simultaneously, but divided into individual sectors in the plots. Slow trends in the residuals are apparent in both cases, and are discussed below.
The fitted parameters are given in Table II. Uncertainties in the parameters were determined using Monte Carlo and residual-permutation simulations Me++04mn; Me08mn. The Monte Carlo errorbars are significantly larger than the residual-permutation alternatives because the latter do not account for the uncertainty in the spectroscopic light ratio. We therefore adopted the Monte Carlo errorbars for all parameters. The dominant source of uncertainty is the spectroscopic light ratio, which could be improved by further observations and analysis.
| Parameter | Value |
|---|---|
| Fitted parameters: | |
| Time of primary eclipse (BJDTDB) | |
| Orbital period (d) | |
| Orbital inclination (∘) | |
| Sum of the fractional radii | |
| Ratio of the radii | |
| Central surface brightness ratio | |
| LD coefficient for star A | |
| LD coefficient for star B | |
| LD coefficient for star A | 0.498 (fixed) |
| LD coefficient for star B | 0.467 (fixed) |
| Orbital eccentricity | 0.0 (fixed) |
| Derived parameters: | |
| Fractional radius of star A | |
| Fractional radius of star B | |
| Light ratio |
The out-of-eclipse variability
The best fits to the light curves (Figs. 2 and 3) show slow trends in the residuals which differ between the two sectors. Our preferred interpretation of this is small brightness variations present on the surface of one or both stars, with the star(s) rotating synchronously with the orbit in order to obtain the consistent phasing in Figs. 2 and 3. This could be caused by starspots, and evolution of the spot configuration is a natural explanation for the differences between the residuals of the fits to the two sectors. The values of the stars are relatively high for this explanation, but are only slightly higher than KIC 5359678 for which spot activity was clearly detected Wang+21mn; Me22obs3. The lack of increased residuals during eclipse suggests the spots are either a similar temperature to the rest of the photosphere and/or are located on parts of the star(s) that are not eclipsed.
We checked for the possibility of pulsations by calculating a periodogram of the residuals of the fit to the data from sector 58, using the period04 code LenzBreger04iaus. Significant signals were found at the orbital period and half the orbital period, in agreement with the starspot hypothesis. No evidence for either Scuti or Doradus pulsations were found, despite a significant number of such pulsators now being known in dEBs GaulmeGuzik19aa; Me21obs6; MeVanreeth22mn; Kahraman+22raa; Chen+22apjs.
Radial velocities
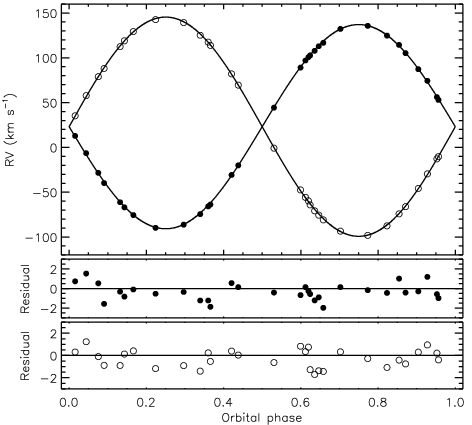
T08 measured RVs of both stars from each of 31 high-quality échelle spectra obtained using the Asiago 1.8 m telescope. We obtained these from table 2 in T08 and modelled them using jktebop, adopting a circular orbit and separate systemic velocities () for the two stars. We fitted for velocity amplitudes ( and ), , and . The period was fixed at the value from Table II. Uncertainties were calculated from 1000 Monte Carlo simulations Me++04mn2; Me21obs5 after adjusting the sizes of the errorbars to give a reduced of unity for the RVs for each star.
We found km s-1, km s-1, km s-1 and km s-1, where the uncertainties in the systemic velocities do not include any transformation onto a standard system. The best fits are shown in Fig. 4. We cannot compare the and values directly with the results from T08 because they did not calculate these parameters explicitly.
We found an offset of s between the from the RV fit and that predicted from the ephemeris in Table II. Further investigation suggests that this offset is also present in the times of minimum light given by T08 and Hubscher et al. Hubscher+10ibvs. As the current work is the first by the author that used the lightkurve package to access TESS data, one possibility is that this approach has caused an offset in the timestamps. We checked this by using lightkurve to download TESS light curves for ZZ UMa and ZZ Boo and compared them to those used in refs. Me23obs1 and Me22obs6. No offset in the timings was found, suggesting that the timing offset is an astrophysical effect, perhaps caused by a third component on a wider orbit around V570 Per.
V570 Per is present in the Gaia DR3 Non-single-star orbital models for sources compatible with Double Lined Spectroscopic binary model catalogue§§ § https://vizier.cds.unistra.fr/viz-bin/VizieR-3?-source=I/357/tbosb2 which reports objects detected as double-lined and with a fitted spectroscopic orbit Gaia16aa; Gaia22aa. The orbital parameters given are , km s-1 and km s-1, based on RVs from 24 spectra. The eccentricity is very small and consistent with zero, as expected. We find that is in good agreement with our , but that is moderately discrepant with our . It is clear that the identities of the stars have been swapped, but the source of the / discrepancy is unknown. We chose not to use these results because the spectra and RVs on which they are based are not publicly available so cannot be checked. It is relevant that Tokovinin Tokovinin23aj has found issues with the Gaia DR3 and values in the sense that a significant fraction (14 of 22 in that case) have underestimated values or other problems.
Physical properties of V570 Per
We determined the physical properties of V570 Per using the jktabsdim code Me++05aa. The input values to this were: (i) the , , and from Table II; the and from the RV analysis; the values from T08 with the errorbars increased to 50 K to account for the systematic uncertainties of the scale for F-stars Depascale+14aa; Ryabchikova+16mn; Jofre++19araa; an interstellar reddening of mag from the stilism¶¶ ¶ https://stilism.obspm.fr online tool Lallement+14aa; Lallement+18aa; the and magnitudes from Tycho-2 Hog+00aa which are averages of 12 measurements at effectively random orbital phases; and the magnitudes from 2MASS Cutri+03book converted to the Johnson system using the transformations from Carpenter Carpenter01aj. The 2MASS magnitudes were taken at phase 0.10 so are representative of the average brightness of the system. The results are given in Table II, where the errorbars have been propagated individually from each input parameter.
| Parameter | Star A | Star B | ||
| Mass ratio | ||||
| Semimajor axis of relative orbit () | ||||
| Mass () | 1.4489 | 0.0063 | 1.3495 | 0.0062 |
| Radius () | 1.538 | 0.035 | 1.349 | 0.032 |
| Surface gravity ([cgs]) | 4.225 | 0.020 | 4.308 | 0.021 |
| Density () | 0.398 | 0.027 | 0.550 | 0.039 |
| Synchronous rotational velocity ( km s-1) | 40.93 | 0.92 | 35.89 | 0.85 |
| Effective temperature (K) | 6842 | 50 | 6562 | 50 |
| Luminosity | 0.669 | 0.023 | 0.483 | 0.024 |
| (mag) | 3.068 | 0.058 | 3.533 | 0.061 |
| Distance (pc) | ||||
The agreement between the measurements in Table II and the results from T08 is good, with all quantities within 1. The radii of the stars have been determined to 2.3% precision, which is slightly worse than managed by T08 despite the availability of much better photometry for the current study. This arises because the precision of the radius measurements is limited by the spectroscopic light ratio applied in the photometric analysis, and perhaps from underestimated errorbars in T08. A better spectroscopic light ratio is needed to measure the radii more precisely.
The synchronous rotational velocities are consistent with the values measured by T08. This is in agreement with our assertion that the trends in the residuals of the fit to the light curves are due to starspots rotating synchronously with the orbit.
Inversion of the Gaia DR3 parallax gives a distance to the system of pc, which is 1.4 longer than that found in our own work via the -band surface brightness method Me++05aa and calibrations from Kervella et al. Kervella+04aa. An increase in to 0.1 mag would bring our optical () and infrared () distances into better agreement at the expense of shortening the distance measurement to pc; this reddening is significantly more than the mag found by T08 from the interstellar sodium and potassium lines. The shorter distance could then be compensated by adopting larger values for the stars. The Gaia distance is questionable because the renormalised unit weight error (RUWE) of 1.395 for V570 Per is near the maximum value of 1.4 for a reliable astrometric solution Gaia21aa.
Summary and conclusions
V570 Per is a dEB containing two F-type stars on a 1.90 d circular orbit. The system shows shallow (0.12 and 0.11 mag) partial eclipses which were discovered using the Hipparcos satellite. We used TESS light curves from two sectors and published RVs from T08 to determine its physical properties. The partial eclipses make a solution of the light curve alone poorly determined, but the addition of a spectroscopic light ratio was sufficient to reach a determinate solution. The resulting radius measurements are relatively imprecise (2.3%) due to this, and in comparison with the mass measurements (0.5%). Our measured distance to the system is in reasonable agreement with that from Gaia DR3.
We compared the masses, radii and s of the stars to predictions from the parsec stellar evolutionary models Bressan+12mn. The models provide a match to these properties to within the 1 errorbars for an age of 800–900 Myr and a slightly supersolar fractional metal abundance of (where the solar value is ).
We also found the eclipses to arrive 11 min later than expected in the TESS light curves. Checks turned up no evidence for this being due to instrumental or data reduction issues, so it may be an astrophysical effect. The system should be monitored for eclipse timing variations caused by a possible third body. We also found residual systematics in the light curve which we attribute to weak starspots rotating synchronously with the orbit. Twenty-four observations with the Gaia Radial Velocity Spectrograph Cropper+18aa yielded a double-lined spectroscopic orbit for the system which is in partial agreement with the ground-based results from T08. Future observations with Gaia should allow the addition of more RV measurements to this analysis, plus direct access to the Gaia spectra for checking the discrepancy found for one of the two stars.
Acknowledgements
We thank the anonymous referee for a quick and positive report. This paper includes data collected by the TESS mission and obtained from the MAST data archive at the Space Telescope Science Institute (STScI). Funding for the TESS mission is provided by the NASA’s Science Mission Directorate. STScI is operated by the Association of Universities for Research in Astronomy, Inc., under NASA contract NAS 5–26555. This work has made use of data from the European Space Agency (ESA) mission Gaia∥∥ ∥ https://www.cosmos.esa.int/gaia, processed by the Gaia Data Processing and Analysis Consortium (DPAC**** ** https://www.cosmos.esa.int/web/gaia/dpac/consortium). Funding for the DPAC has been provided by national institutions, in particular the institutions participating in the Gaia Multilateral Agreement. The following resources were used in the course of this work: the NASA Astrophysics Data System; the SIMBAD database operated at CDS, Strasbourg, France; and the ariv scientific paper preprint service operated by Cornell University.
References
- 1 D. M. Popper, ARA&A, 18, 115, 1980.
- 2 J. Andersen, A&ARv, 3, 91, 1991.
- 3 G. Torres, J. Andersen & A. Giménez, A&ARv, 18, 67, 2010.
- 4 O. Y. Malkov et al., A&A, 446, 785, 2006.
- 5 Z. Eker et al., PASA, 31, e024, 2014.
- 6 J. Southworth, in Living Together: Planets, Host Stars and Binaries (S. M. Rucinski, G. Torres & M. Zejda, eds.), 2015, Astronomical Society of the Pacific Conference Series, vol. 496, p. 321.
- 7 J. Southworth, Universe, 7, 369, 2021.
- 8 J. Andersen, J. V. Clausen & B. Nordström, ApJ, 363, L33, 1990.
- 9 A. Claret & G. Torres, A&A, 592, A15, 2016.
- 10 A. Claret & G. Torres, ApJ, 859, 100, 2018.
- 11 T. Constantino & I. Baraffe, A&A, 618, A177, 2018.
- 12 A. Tkachenko et al., A&A, 637, A60, 2020.
- 13 D. Graczyk et al., A&A, 594, A92, 2016.
- 14 G. Torres, Astronomische Nachrichten, 334, 4, 2013.
- 15 Z. Jennings et al., MNRAS, 521, 3405, 2023.
- 16 G. Pietrzyński et al., Nature, 567, 200, 2019.
- 17 W. L. Freedman et al., ApJ, 891, 57, 2020.
- 18 J. Southworth, The Observatory, 140, 247, 2020.
- 19 G. R. Ricker et al., Journal of Astronomical Telescopes, Instruments, and Systems, 1, 014003, 2015.
- 20 L. W. IJspeert et al., A&A, 652, A120, 2021.
- 21 A. B. Justesen & S. Albrecht, ApJ, 912, 123, 2021.
- 22 A. Prša et al., ApJS, 258, 16, 2022.
- 23 F. van Leeuwen et al., A&A, 323, L61, 1997.
- 24 E. V. Kazarovets et al., IBVS, 4659, 1, 1999.
- 25 U. Munari et al., A&A, 378, 477, 2001.
- 26 L. Tomasella et al., A&A, 483, 263, 2008.
- 27 Gaia Collaboration, A&A, 649, A1, 2021.
- 28 A. J. Cannon & E. C. Pickering, Annals of Harvard College Observatory, 91, 1, 1918.
- 29 ESA (ed.), The Hipparcos and Tycho catalogues. Astrometric and photometric star catalogues derived from the ESA Hipparcos space astrometry mission, ESA Special Publication, vol. 1200, 1997.
- 30 K. G. Stassun et al., AJ, 158, 138, 2019.
- 31 E. Høg et al., A&A, 355, L27, 2000.
- 32 R. M. Cutri et al., 2MASS All Sky Catalogue of Point Sources (The IRSA 2MASS All-Sky Point Source Catalogue, NASA/IPAC Infrared Science Archive, Caltech, US), 2003.
- 33 Lightkurve Collaboration, ‘(Lightkurve: Kepler and TESS time series analysis in Python)’, Astrophysics Source Code Library, 2018.
- 34 J. M. Jenkins et al., in Proc. SPIE, 2016, Society of Photo-Optical Instrumentation Engineers (SPIE) Conference Series, vol. 9913, p. 99133E.
- 35 J. Southworth, P. F. L. Maxted & B. Smalley, MNRAS, 351, 1277, 2004.
- 36 J. Southworth, A&A, 557, A119, 2013.
- 37 G. Torres et al., AJ, 120, 3226, 2000.
- 38 J. Southworth, H. Bruntt & D. L. Buzasi, A&A, 467, 1215, 2007.
- 39 J. Southworth, The Observatory, 141, 52, 2021.
- 40 J. Southworth, S. J. Murphy & K. Pavlovski, MNRAS, 520, L53, 2023.
- 41 F. Allard, D. Homeier & B. Freytag, Philosophical Transactions of the Royal Society of London Series A, 370, 2765, 2012.
- 42 J. Southworth, The Observatory, 143, 71, 2023.
- 43 D. Hestroffer, A&A, 327, 199, 1997.
- 44 A. Claret & J. Southworth, A&A, 664, A128, 2022.
- 45 P. F. L. Maxted, A&A, 616, A39, 2018.
- 46 J. Southworth, P. F. L. Maxted & B. Smalley, MNRAS, 349, 547, 2004.
- 47 J. Southworth, MNRAS, 386, 1644, 2008.
- 48 J. Wang et al., MNRAS, 504, 4302, 2021.
- 49 J. Southworth, The Observatory, 142, 103, 2022.
- 50 P. Lenz & M. Breger, in The A-Star Puzzle, Cambridge University Press, Cambridge, UK. (J. Zverko, J. Žižnovsky, S. J. Adelman, & W. W. Weiss, ed.), 2004, IAU Symposium, vol. 224, pp. 786–790.
- 51 P. Gaulme & J. A. Guzik, A&A, 630, A106, 2019.
- 52 J. Southworth, The Observatory, 141, 282, 2021.
- 53 J. Southworth & T. Van Reeth, MNRAS, 515, 2755, 2022.
- 54 F. Kahraman Aliçavuş et al., RAA, 22, 085003, 2022.
- 55 X. Chen et al., ApJS, 263, 34, 2022.
- 56 J. Southworth, The Observatory, 141, 234, 2021.
- 57 J. Hubscher et al., IBVS, 5918, 1, 2010.
- 58 J. Southworth, The Observatory, 143, 19, 2023.
- 59 J. Southworth, The Observatory, 142, 267, 2022.
- 60 Gaia Collaboration, A&A, 595, A1, 2016.
- 61 Gaia Collaboration, arXiv:2206.05595, 2022.
- 62 A. Tokovinin, AJ, in press, arXiv:2304.02706, 2023.
- 63 J. Southworth, P. F. L. Maxted & B. Smalley, A&A, 429, 645, 2005.
- 64 M. De Pascale et al., A&A, 570, A68, 2014.
- 65 T. Ryabchikova et al., MNRAS, 456, 1221, 2016.
- 66 P. Jofré, U. Heiter & C. Soubiran, ARA&A, 57, 571, 2019.
- 67 R. Lallement et al., A&A, 561, A91, 2014.
- 68 R. Lallement et al., A&A, 616, A132, 2018.
- 69 J. M. Carpenter, AJ, 121, 2851, 2001.
- 70 A. Prša et al., AJ, 152, 41, 2016.
- 71 P. Kervella et al., A&A, 426, 297, 2004.
- 72 A. Bressan et al., MNRAS, 427, 127, 2012.
- 73 M. Cropper et al., A&A, 616, A5, 2018.