A solid-state high harmonic generation spectrometer with cryogenic cooling
Abstract
Solid-state high harmonic generation spectroscopy (sHHG) is a promising technique for studying electronic structure, symmetry, and dynamics in condensed matter systems. Here, we report on the implementation of an advanced sHHG spectrometer based on a vacuum chamber and closed-cycle helium cryostat. Using an in situ temperature probe, it is demonstrated that the sample interaction region retains cryogenic temperature during the application of high-intensity femtosecond laser pulses that generate high harmonics. The presented implementation opens the door for temperature-dependent sHHG measurements down to few Kelvin, which makes sHHG spectroscopy a new tool for studying phases of matter that emerge at low temperatures, which is particularly interesting for highly correlated materials.
I Introduction
High harmonic generation (HHG) is a highly nonlinear optical process that has become a standard method for generating ultrashort extreme ultraviolet (XUV) pulses in noble gases. In the gas phase, the process can be classically described by the three-step model, in which electrons tunnel-ionize from an atom in a strong field, accelerate through space, and then re-collide with the parent ion with excess kinetic energy, which results in harmonic emission. In the solid phase, HHG was first observed in bulk crystals in 2011 using strong mid-infrared (MIR) laser pulses to generate a visible to ultraviolet harmonic spectrum.Ghimire et al. 2011 Solid-state HHG (sHHG) occurs by a similar process to gas HHG and exhibits similar features such as a plateau of harmonics reaching out to a cut-off at high energies. However, one key aspect of how sHHG deviates from the basic three-step model is that accelerated electrons are not free particles, but rather constrained by allowed bound energy states in a periodic crystal structure (see Fig. 1a). This allows harmonics to both be emitted from electron-hole recombination (interband polarization), as well as directly from a nonlinear intraband current of electrons in the conduction band and holes in the valence band due to Bloch oscillations.Teichmann et al. 2011; Ghimire et al. 2011; Ghimire and Reis 2019 The process of accelerating charge carriers through the material’s band structure accounts for major differences observed between sHHG and gas HHG spectra and makes sHHG a promising tool for studying the electronic structure of solids, as the potential energy surface experienced by accelerated electrons is encoded in the efficiency of harmonic emission in the sHHG spectrum. The potential energy surface and therefore the harmonic spectrum also depends on the lattice direction along which electrons and holes are accelerated, providing a way to access 3D band structure through measuring the anisotropy of harmonics, which has become a standard measurement in the field. sHHG has been observed in a broad variety of materials, from wide-gap dielectrics like SiO2 Luu et al. 2015 and GaSe Ndabashimiye et al. 2016 to (quasi-)2D materials like grapheneBowlan et al. 2014; Taucer et al. 2017; Yoshikawa, Tamaya, and Tanaka 2017; Baudisch et al. 2018 and transition metal dichalcogenidesLiu et al. 2017; Lou et al. 2020; Yoshikawa et al. 2019; Heide et al. 2022a; Yue et al. 2022 and has inherent capabilities to probe phenomena on femtosecond timescales and beyond,Bowlan et al. 2014; Langer et al. 2016; Garg et al. 2016; Uzan et al. 2020; Bionta et al. 2021; Heide et al. 2022a making it an emerging probe with significant potential to study electronic structure and properties in solids.Zong et al. 2023
a) Sketch showing the principle of the sHHG mechanism. (1) In the presence of a strong laser field, an electron is tunnel-ionized from the valence band (VB) into the conduction band (CB), creating a hole in the VB. (2) The electron-hole pair is accelerated along the materials nonlinear band structure, giving rise to the intraband component of the sHHG process. (3) Polarization buildup between VB and CB and subsequent recombination of electron-hole pairs cause the interband component of sHHG emission.
b) Example ZnO spectrum showing the 7th and 9th harmonic as well as broad photoluminescence (PL) peak and emerging lasing mode, taken at an intensity of TW/cm2 and K temperature.
sHHG has recently been extended to investigations of new and exotic classes of quantum materials such as Weyl semimetalsLv et al. 2021 and topological insulators.Baykusheva et al. 2021; Schmid et al. 2021; Heide et al. 2022b These strongly correlated systems often exhibit unique phase transitions that can be accessed through changes in external conditions, in particular, a large number of relevant materials require access to cryogenic temperature to reach such phase transitions. To this end, we have implemented a sHHG spectrometer with a vacuum chamber and closed-cycle helium cryostat with the goal of measuring temperature-dependent sHHG spectra at temperatures down to K and pressures down to Torr, allowing the study of electronic band structure in hard-to-access phases and across phase transitions. In particular, to precisely analyze temperature-dependent dynamics of thin film materials using sHHG spectroscopy, accurate determination of the sample temperature in the optical interaction region is crucial. Given the high intensities required to drive the sHHG process and mW level average powers applied to thin-film samples, it is critical to assess the sample temperature in situ and determine the relationship between local sample temperature relative to external temperature probes such as typically installed on sample holders. Ensuring accurate sample temperatures is crucial for avoiding experimental artifacts and potentially erroneous conclusions.Kivelson et al. 2020 As a test case to benchmark the performance of the apparatus, we investigate the band gap shift of a ZnO thin film while simultaneously measuring the 7th and 9th harmonic, as shown in Fig. 1b. It is found that by applying laser intensities in the Mott transition regime, a strong photoluminescence (PL) signal featuring a lasing transition, as has been previously observed in ZnO,Wille et al. 2016 one can accurately track the temperature-dependent band gap by measuring the PL wavelength and therefore utilize this emission for accurate in situ sample temperature assessment under strong-field conditions.
II Technical Description
II.1 Overview of Instrument
A schematic diagram of the cryogenic sHHG spectrometer is shown in Fig. 2. The instrument is based on a commercial Ti:sapphire chirped pulse amplifier system (Coherent Legend Elite Duo, 800 nm center wavelength, 1 kHz repetition rate, mJ amplified pulse energy, fs pulse duration). A portion of the amplifier (5 mJ) used for this spectrometer pumps a commercial optical parametric amplifier (Light Conversion TOPAS) and noncollinear difference frequency generation (DFG) unit (Light Conversion NDFG). An active laser beam stabilization system (MRC Systems GmbH) is used between the amplifier and optical parametric amplifier to improve shot-to-shot stability and prevent long-time alignment drift. The MIR wavelength ranges from 2.6–11 m with typical measurements utilizing 3–5 m radiation with J pulse energy.
The MIR driving beam is then transmitted through a series of polarization optics consisting of a pair of wire-grid polarizers (Thorlabs WP25M-IRA) to control the field strength and an achromatic half waveplate (B.Halle Nachfl. GmbH, Achromatic 3–6 m) mounted in a motorized rotation stage (Thorlabs K10CR1) to control the polarization state for sHHG anisotropy measurements. The MIR driving beam is transmitted into and out of the vacuum chamber through 3 mm thick CaF2 windows (Edmund Optics 11-875). The focusing and collimating optics are two uncoated plano-convex CaF2 lenses with 50 mm focal lengths (Thorlabs LA5763). Due to the size of the vacuum chamber, the focusing and collimating optics are both placed inside the chamber. Both lenses are mounted on motorized linear translation stages driven by piezoelectric linear actuators (Newport PicoMotor) and their longitudinal positions are remotely controlled from the outside of the chamber, allowing them to be optimized even under vacuum conditions. This allows for a high degree of dynamic control over the effective beam size on the sample surface down to a 50 m diameter at the focus.
The collimated high-harmonic emission in the UV-visible range is analyzed using another wire-grid polarizer (Thorlabs WP25M-UB) mounted in a motorized rotation stage (Thorlabs K10CR) and is focused into a high-sensitivity imaging spectrometer (Andor Kymera 328i) with a Peltier-cooled camera (Andor iDus DU420A-BU2) using a 25.4 mm focal length uncoated biconvex CaF2 lens (Thorlabs LB5774). A typical polarization anisotropy measurement involves measuring the resulting high-harmonic spectra both parallel and perpendicular to the MIR driving field polarization; both the MIR driving field polarization and high-harmonic emission analyzer polarizer are rotated together. However, the benchmark measurements presented in Sec. III focus on characterizing the cryogenic capabilities of the instrument, so polarization anisotropy measurements were not performed in this work.
II.2 Description of the Cryostat
II.2.1 Vacuum Chamber
A diagram of the custom-made vacuum chamber (Kurt Lesker) is shown in Fig. 3a. The vacuum chamber features a quick-access loading door (Kurt Lesker DS-LL0800) mounted on a DN150CF port, two DN100CF ports along the optical axis for transmission measurements, an additional DN150CF port perpendicular to the sample for reflection measurements, and ten smaller DN63CF ports for accessories such as electrical feedthroughs. Currently, the vacuum chamber is equipped with electrical feedthroughs for the piezo linear actuators, a cold cathode pressure gauge (Pfeiffer Vacuum IKR 270), and a burst disk (Ideal Vacuum Products P107370) for nitrogen venting. Ultra-high vacuum is achieved using a turbo pump (Pfeiffer Vacuum HiPace 80) backed by an oil-free dry scroll roughing pump (Edwards nxDS10i). The foreline pressure is measured using a Pirani gauge (Pfeiffer Vacuum TPR 280). A subsequent leak test showed the chamber pressure stabilizing in the low Torr regime. By baking out the chamber, the pressure was successfully reduced by another order of magnitude. The final chamber pressure reached Torr, which is sufficient to safely operate the liquid helium cryostat without noticeable condensation on the sample.
a) View of the complete chamber assembly including closed-cycle helium cryostat, window flanges for beam/signal transmission, and electrical feedthroughs. The optical axis (OA) is represented by a dashed red line. A quick-access loading door is mounted on the front chamber wall (removed from sketch to allow inside view). b) Sample holder mounted on a PEEK adapter connected to the 3D translation stage controlled by piezo linear actuators. The adapter and 1 cm diameter copper braid ensure thermal exchange with the cryostat while allowing adjustments of the sample position using the triple-axis translational stage.
II.2.2 Closed-Cycle Cryostat
The closed-cycle helium cryostat (Sumitomo Heavy Industries, Ltd. RDK-101D AK Cold Head) depicted in Fig. 3a consists of two cooling stages that provide closed-cycle refrigeration down to 4 K. This technique relies on expansion of high-pressure helium gas at 250 psi, supplied by a helium compressor (Sumitomo Heavy Industries, Ltd. HC-4E1). This periodic compression introduces significant vibrations that can affect laser stability and precise focusing onto the sample that is attached to the cooling finger. The vibration is especially problematic for studying small samples, such as exfoliated 2D materials, where the sample size is on the order of the MIR spot size. To remedy this issue, the cooling head and cooling finger are decoupled from each other for operation and thermal exchange between them is achieved using a helium gas filled low-vibration interface. Therefore, this part of the cryostat needs an additional external helium supply for continued effective thermal exchange. The vibrational isolation interface slightly reduces the cooling power of the cryostat, and in combination with the sample’s connection to the translational stage adding cooling load, the effective minimum temperature is K. However, this could be remedied with additional radiation shielding and/or adjustment of the vibrational isolation interface.
II.2.3 Sample Environment
The sample holder is made from oxygen-free high thermal conductivity (OFHC) copper and is mounted on a three-axis linear translation stage via an adapter made out of polyetheretherketone (PEEK), a thermally insulating plastic, allowing for 3D spatial positioning of the sample during operation using a series of piezoelectric linear actuators (Newport PicoMotor). A schematic diagram of the sample holder and 3D positioning stage is shown in Fig. 3 b). The sample holder and the cooling finger are connected via a 11.6 mm diameter OFHC copper braid which has been crimped onto machined connector pieces that effectively connect the cooling finger tip to the sample holder through the braid. All contact surfaces were polished.
III Results and Discussion
III.1 Choice of Calibration Target
In order to benchmark the performance of the cryogenic sHHG spectrometer described above, temperature-resolved measurements were performed on ZnO. ZnO is a direct band gap semiconductor ( eV) that has been proposed as a promising candidate to compete with common semiconductors such as Si, GaAs, and GaN for a broad range of applications.Look 2001 ZnO-based devices are significantly less expensive to fabricate than dry-etched GaN-based devices due to the well-developed bulk and epitaxial growth techniques based on wet chemical processes.Pearton et al. 2003; Ozgur et al. 2005 They also have high breakdown strength and saturation velocity, making them appealing for electronic applications such as piezoelectric transducers and transparent conducting films.Golovanov et al. 2022; Zhao et al. 2022
However, its primary advantage, especially as a photon emitter, lies in its large exciton binding energy of about 60 meV (compared to GaN with 26 meV), which makes ZnO a highly efficient excitonic emitter even at low excitation energies and high temperatures. For over a decade, this has drawn significant attention to its potential relevance in short-wavelength optoelectronic devices such as semiconductor micro- and nanolasers, which are of interest for the construction of compact integrated circuits that are able to enhance the spatial resolution of a variety of sensors and imaging applications.Rai et al. 2012; Dai et al. 2014; Wille et al. 2016; Sentosa et al. 2011
For prospective use as a semiconductor laser material, the density of free carriers is crucial because it effectively determines the optical properties. Spontaneous emission leading to photoluminescence due to electron-hole recombination in excitons takes place at fluences below the threshold excitation density, for which the carrier density is low and the radiative decay times are long ( ps). Exceeding this critical threshold, when the carrier density reaches the level characterized by the Mott density, the excitons scatter and eventually dissociate into unbound electrons and holes due to screening of their binding potential. They form an electron-hole plasma accompanied by much higher scattering rates and thus faster radiative decay ( ps), which causes the semiconductor to exhibit strong stimulated emission and therefore enables lasing at nm through the recombination of the free electrons and holes.Dai et al. 2014; Wille et al. 2016 Because of its high sensitivity to the charge carrier density in the conduction bands, sHHG spectroscopy presents a promising new approach to reveal insights into charge carrier dynamics around the Mott transition. In this study, we use a well characterized material, ZnO, to show the technique’s capabilities and its potential for investigation of less well understood materials.
In addition to potential technological relevance, ZnO is an ideal spatio-temporal alignment target owing to its strong emission in the UV-visible region that can be used to align and optimize the instrument. Furthermore, the well-studied temperature-dependent band gap enables verification of cryogenic temperatures under experimental conditions (e.g., MIR irradiation). ZnO exhibits a blue-shift of the band gap upon cooling like other semiconductors, leading to an observed shift of the photoluminescence and lasing mode to shorter wavelength. This is due to electron-phonon interactionsFan 1950; Muto and Oyama 1950; Fan 1951 and a decrease in inter-atomic spacing with decreasing thermal energy, which consequently increases the average potential seen by the electrons and therefore the band gap.Rai et al. 2012 The band gap energy as a function of temperature exhibits quadratic behavior which can be modeled empirically with the Varshni equation,
| (1) |
where is the band gap at K and fitting parameters are and , with being proportional to the Debye temperature.Varshni 1967
Temperature-resolved sHHG measurements were collected on a ZnO thin film (300 nm polycrystalline film grown by RF-magnetron sputtering on a 500 m sapphire substrate)Hollinger et al. 2019 in the temperature range of 19 K to 285 K with MIR intensities both above and below the Mott transition ( TW/cm2 and TW/cm2, respectively). The field strength values on target were calculated by measuring the incident pulse energy directly in front of the chamber window, accounting for its transmission, assuming a 100 fs pulse duration, and assuming a 50 m spot size in diameter, which had been determined in previous experiments on the same beamline with the same focusing lens. Spectra were collected from 270 nm to 530 nm using a UV-blazed grating (300 nm blaze, 300 lines/mm), which captured the 7th harmonic, 9th harmonic, and PL features simultaneously. Starting from 20 K, multiple sHHG spectra were taken at each temperature point around the Mott transition for different incident MIR field strengths. Following initial measurements of the damage threshold throughout the full temperature range, care was taken to stay below the lowest determined value of about 0.6 TW/cm2 for the data reported here.
III.2 Temperature Calibration Below the Mott Transition
Because the photon energy of the lasing mode that appears at higher MIR intensities above the Mott transition is not necessarily the same as the band gap energy, measurements of the temperature-dependent band gap needed to be collected below the Mott transition threshold. This low-intensity experiment enables us to use the PL feature, assigned to the combined free exciton (FX) and donor-bound exciton (D0X) feature, as a proxy for the band gap energy as previously utilized by Sentosa et al.Sentosa et al. 2011 Data corresponding to a MIR intensity below the Mott threshold ( TW/cm2) are shown in Fig. 4 with peak centers marked to illustrate shifting PL. The center photon energies of the PL peaks are marked in Fig. 4b by solid triangles. The corresponding photon energy of the PL emission peak below the Mott transition was determined with an accuracy equivalent to nm of the center wavelength and is plotted in Fig. 5. The data were fit to the Varshni model shown in Eq. (1), which is plotted together with three fits based on the Varshni equation from literature as a reference. Given the relative insensitivity of the fit to comparably large variations of the parameters and , they were chosen as meV/K and K, within the error range of the values reported by Rai et al.,Rai et al. 2012 since we are measuring the same combined exciton feature. The fit using those values delivered eV, and reproduces the dependence of the measured values very well. A comparison of the Varshni model fit parameters is shown in Table 1.


| (0 K) [eV] | [meV/K] | [K] | |
|---|---|---|---|
| D0X (Sentosa et al.Sentosa et al. 2011) | 3.36* | 0.28 | 339 |
| FX (Sentosa et al. Sentosa et al. 2011) | 3.375* | 0.51 | 682 |
| Absorption edge (Rai et al.Rai et al. 2012) | 3.35* | ||
| PL emission (this work) |
The experimental values measured in this work shown in Fig. 5 are in reasonable agreement with results reported previously in the literature,Rai et al. 2012; Sentosa et al. 2011 especially at lower temperatures. The fit parameters reported by Rai et al. were determined from fitting data corresponding to the absorption edge of the Urbach tail for an electron-beam deposited ZnO thin film on a sapphire substrate to the Varshni equation.Rai et al. 2012 The Urbach tail lies energetically below the FX absorption peak, which is consistent with the results reported by Sentosa et al.Sentosa et al. 2011 Comparing the experimental results shown above with Sentosa et al. reveals that both of their fits are vertically shifted to higher energies. The D0X trace agrees with our results at low temperatures but deviates significantly at K. Above K, the shape of their FX fit would better reproduce the results reported here if shifted to lower energies. This may be due to the D0X contributions being dominant in the PL below 60 K, the emergence of the FX contribution at K, and the subsequent vanishing of D0X PL contribution at K.Jen et al. 2005; Sentosa et al. 2011 Therefore, this suggests that our measurement of the combined D0X and FX PL can reproduce their individual contributions in their corresponding dominant temperature regimes.
One explanation of the observed shift in the results presented in this work to lower energies may pertain to sample preparation. Sentosa et al. used a ZnO thin film sample that was prepared by pulsed laser deposition on yttria-stabilized zirconia.Sentosa et al. 2011 The thin film studied here and the one reported by Rai et al.Rai et al. 2012 were deposited on sapphire, which has a larger lattice mismatch with ZnO. The larger lattice mismatch can induce strain that has been shown to modulate the band gap in ZnO nanostructuresLi, Jiang, and Yang 2010 and promotes defects in the thin films. Furthermore, the growth technique used by Rai et al. (reactive e-beam deposition) was not identical to the one used to prepare the ZnO thin film studied here. Due to previously reported importance of growth parameters for the resulting thin film quality and subsequent electrical and optical properties,Sentosa et al. 2011 using different deposition techniques is likely to impact the observed sample behavior. Therefore the deviations observed preclude the ability to use ZnO as a quantitative spectroscopic temperature calibration. This is mainly due to the uncertainty of the values we measured for the PL feature and the relatively small shift in energy of the emission feature with temperature. This might be improved by using a ZnO sample with a well-defined structure and fabrication process such as a single crystal, allowing more precise determination of the band gap energy.
III.3 Temperature Dependence of the Mott Threshold
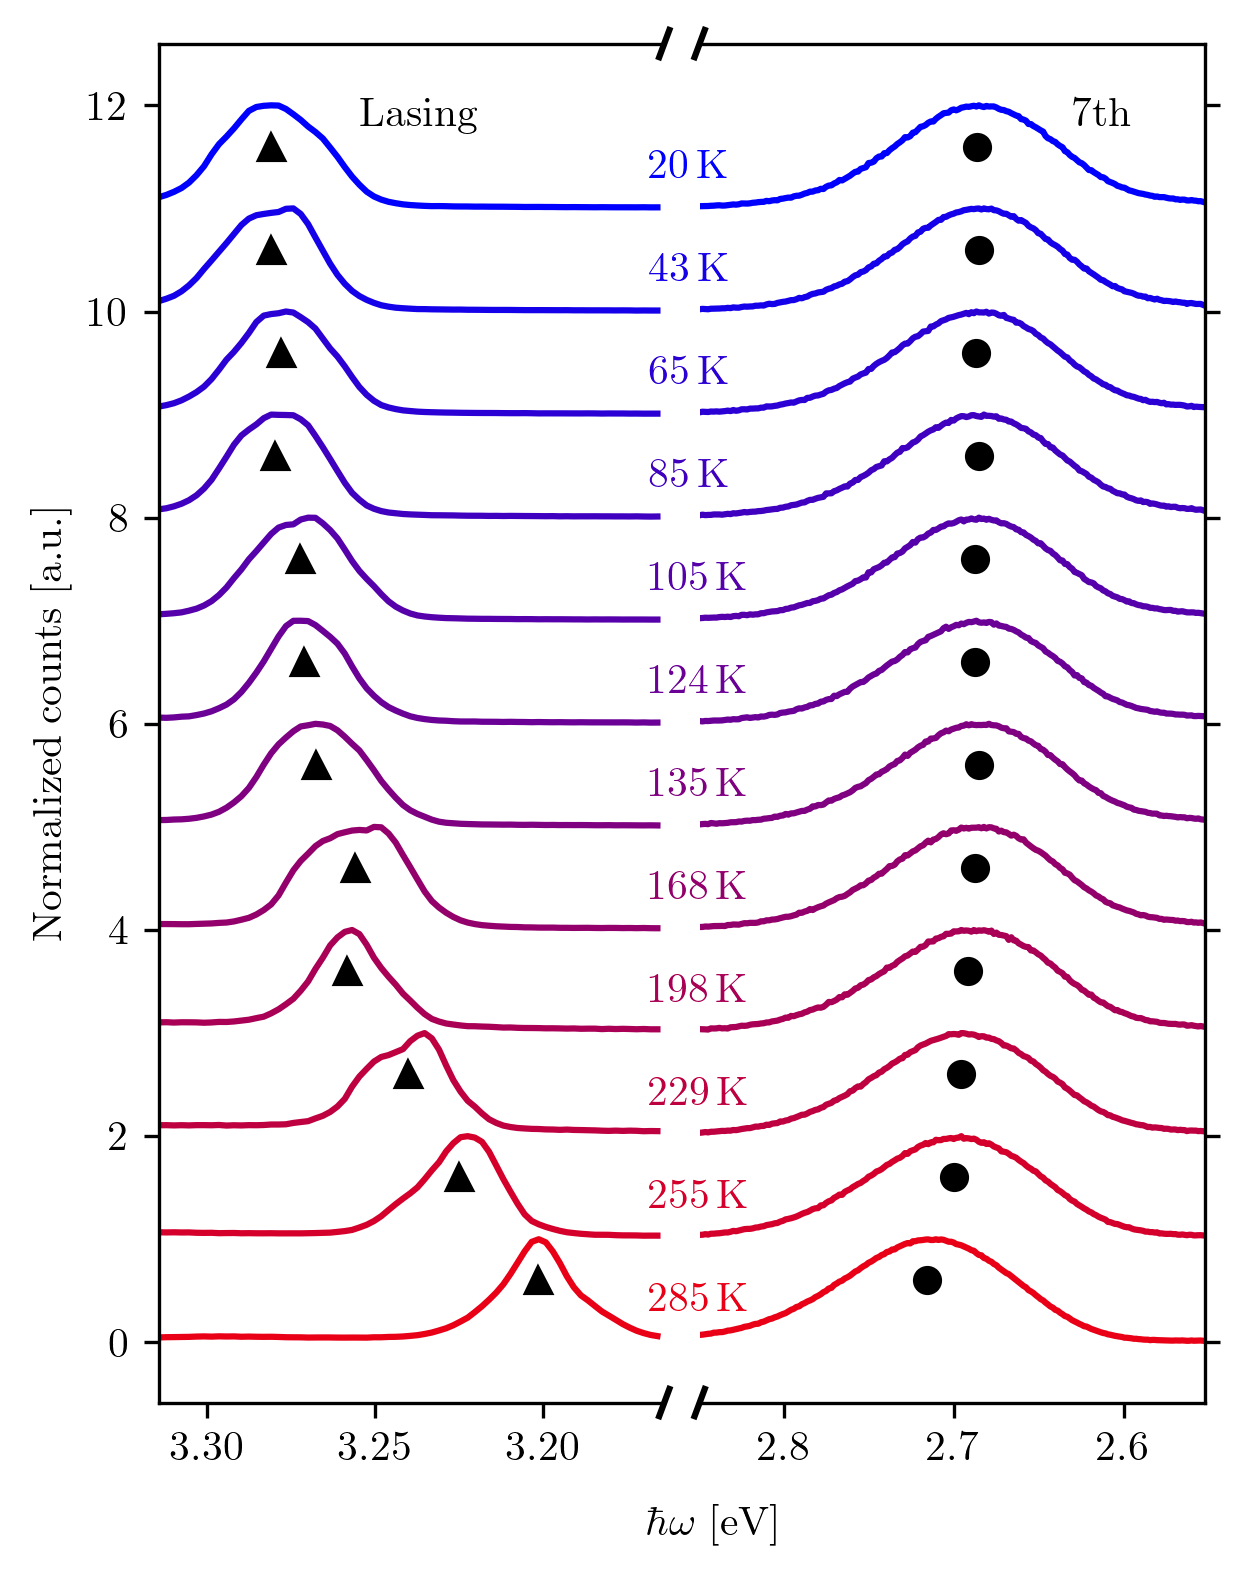
In addition to the aforementioned measurements collected below the Mott transition that were utilized to calibrate the ability of the instrument to perform in the cryogenic regime, temperature- and intensity-dependent measurements were performed to directly probe the temperature-dependence of the Mott threshold, illustrating the utility of the instrument in studying important phase transitions in solids. The spectra shown in Fig. 6 were collected analogously to the spectra shown in Fig. 4 at a MIR intensity above the Mott threshold ( TW/cm2). The lasing mode (solid triangles) clearly depicts an energy shift as a function of temperature, while the harmonics (solid circles) show little deviation as a function of temperature which we ascribe to slight thermal drifts of photon energy of the driver.
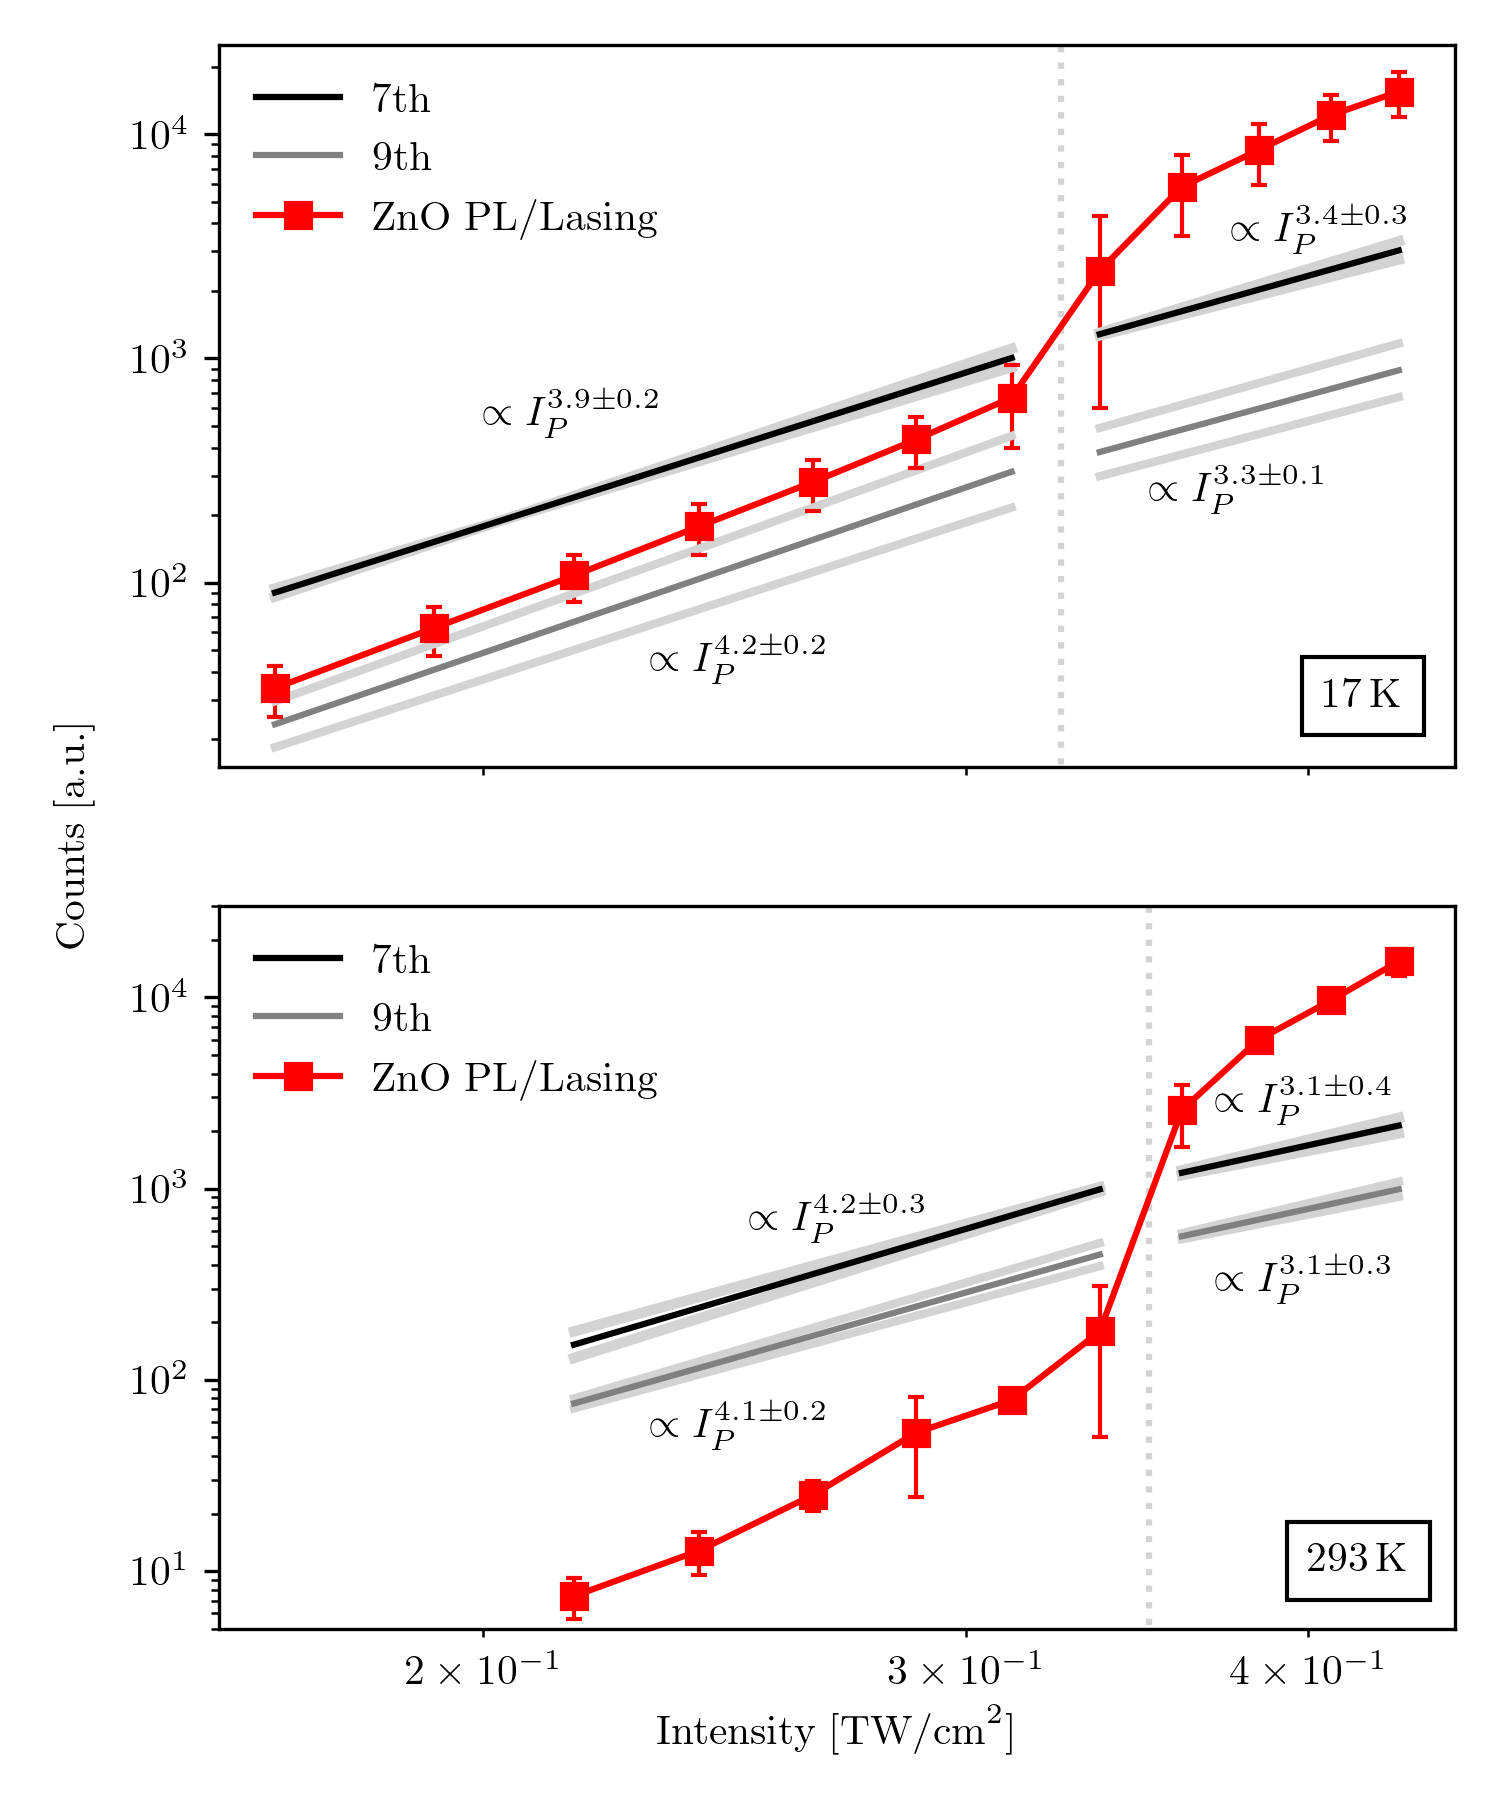
Measurements were also collected both as a function of MIR intensity and as a function of temperature to show how the instrument can be used to probe the Mott transition in materials such as ZnO. The intensity dependence of the 7th harmonic, 9th harmonic, and PL/lasing mode are shown below in Fig. 7, illustrating the temperature dependence of the Mott transition, which can be seen as a jump in the ZnO PL intensity, corresponding to the emergence of lasing. Notably, the transition between PL and lasing occurs at a slightly lower intensity at lower temperature. Due to the PL signal below the Mott transition being an order-of-magnitude higher at 17 K, the MIR intensity could be lowered further than at room temperature without the signal dropping below noise level. Overall, these measurements illustrate the utility of sHHG spectroscopy performed under cryogenic conditions to study phenomena such as Mott transitions.
IV Conclusion and Outlook
We report the development of a cryogenic sHHG spectrometer based on a closed-cycle helium cryostat. In its present form, the instrument is capable of performing measurements down to K, with the possibility to reach lower temperature through radiation shielding. In order to benchmark the performance of the instrument, the temperature-dependent shift of the band gap in ZnO was investigated by extracting the peak photon energy of the PL from below threshold-density spectra and fitting the peak photon energies as a function of temperature with the Varshni formula. While there remains uncertainty due to inconsistencies regarding the temperature-dependent gap in ZnO in the available literature references, our results indicate that it is possible to maintain cryogenic temperatures in the optical interaction region while illuminating the ZnO thin film with an intensity sufficient to reach the non-perturbative regime and generate strong sHHG signal. This indicates that sample heating under the ultrafast MIR driving field is not significant enough to preclude cryogenic measurements, resolving a debate in the community about the effective sample temperature under strong-field illumination by femtosecond pulses. This opens the door to investigate a broad range of material dynamics at low temperatures using the unique capabilities of sHHG spectroscopy.
Acknowledgements.
The authors would like to thank Alexander Koch and Prof. Carsten Ronning at the Friedrich Schiller University Jena for providing the ZnO thin film used in this work. F.K. acknowledges support from the Thesis Research Fellowship Program of the German Academic Exchange Service (DAAD). B.N. acknowledges funding by the National Science Foundation Graduate Research Fellowship Program. J.A.S. acknowledges support by the Arnold O. Beckman Postdoctoral Fellowship Program. A.Z. acknowledges support from the Miller Institute for Basic Research in Science. R.H. acknowledges support by the Alexander von Humboldt Foundation. M.Z. acknowledges funding by the W. M. Keck Foundation, funding from the UC Office of the President within the Multicampus Research Programs and Initiatives (M21PL3263), and funding from Laboratory Directed Research and Development Program at Berkeley Lab (107573 and 108232).Author Declarations
IV.1 Conflict of Interest
The authors have no conflicts to disclose.
IV.2 Author contributions
Finn Kohrell: Methodology (lead), Writing - original draft (lead), Data curation (lead), Visualization (lead), Formal Analysis (lead), Conceptualization (equal). Bailey Nebgen: Methodology (equal), Data Curation (equal), Formal Analysis (equal), Writing - review and editing (equal), Visualization (equal). Jacob Spies: Writing - review and editing (equal), Formal Analysis (equal), Visualization (equal). Richard Hollinger: Conceptualization (lead). Alfred Zong: Data Curation (equal), Conceptualization (equal), Writing - review and editing (equal), Visualization (supporting), Formal Analysis (supporting). Can Uzundal: Conceptualization (supporting), Methodology (supporting). Christian Spielmann: Supervision (supporting), Conceptualization (supporting), Writing - review and editing (supporting). Michael Zuerch: Supervision (lead), Funding acquisition (lead), Conceptualization (equal), Writing - original draft (equal), Writing - review and editing (equal).
Data Availability Statement
The data that support the findings of this study are available from the corresponding author upon reasonable request.
references
References
- Ghimire et al. (2011) S. Ghimire, A. D. DiChiara, E. Sistrunk, P. Agostini, L. F. DiMauro, and D. A. Reis, “Observation of high-order harmonic generation in a bulk crystal,” Nat. Phys. 7, 138–141 (2011).
- Teichmann et al. (2011) S. M. Teichmann, N. Bisht, M. Hidalgo, A. Honarfar, M. G. Mingolla, M. Turconi, M. Clerici, P. Di Trapani, and J. Biegert, “High field physics and extreme nonlinear optics,” Eur. Phys. J.: Spec. 199, 89–100 (2011).
- Ghimire and Reis (2019) S. Ghimire and D. A. Reis, “High-harmonic generation from solids,” Nat. Phys. 15, 7 (2019).
- Luu et al. (2015) T. T. Luu, M. Garg, S. Y. Kruchinin, A. Moulet, M. T. Hassan, and E. Goulielmakis, “Extreme ultraviolet high-harmonic spectroscopy of solids,” Nature 521, 498–502 (2015).
- Ndabashimiye et al. (2016) G. Ndabashimiye, S. Ghimire, M. Wu, D. A. Browne, K. J. Schafer, M. B. Gaarde, and D. A. Reis, “Solid-state harmonics beyond the atomic limit,” Nature 534, 520–523 (2016).
- Bowlan et al. (2014) P. Bowlan, E. Martinez-Moreno, K. Reimann, T. Elsaesser, and M. Woerner, “Ultrafast terahertz response of multilayer graphene in the nonperturbative regime,” Phys. Rev. B 89 (2014), 10.1103/PhysRevB.89.041408.
- Taucer et al. (2017) M. Taucer, T. J. Hammond, P. B. Corkum, G. Vampa, C. Couture, N. Thiré, B. E. Schmidt, F. Légaré, H. Selvi, N. Unsuree, B. Hamilton, T. J. Echtermeyer, and M. A. Denecke, “Nonperturbative harmonic generation in graphene from intense midinfrared pulsed light,” Phys. Rev. B 96, 195420 (2017).
- Yoshikawa, Tamaya, and Tanaka (2017) N. Yoshikawa, T. Tamaya, and K. Tanaka, “High-harmonic generation in graphene enhanced by elliptically polarized light excitation,” Science 356, 736–738 (2017).
- Baudisch et al. (2018) M. Baudisch, A. Marini, J. D. Cox, T. Zhu, F. Silva, S. Teichmann, M. Massicotte, F. Koppens, L. S. Levitov, F. J. García de Abajo, and J. Biegert, “Ultrafast nonlinear optical response of Dirac fermions in graphene,” Nat. Commun. 9, 1018 (2018).
- Liu et al. (2017) H. Liu, Y. Li, Y. S. You, S. Ghimire, T. F. Heinz, and D. A. Reis, “High-harmonic generation from an atomically thin semiconductor,” Nat. Phys. 13, 262–265 (2017).
- Lou et al. (2020) Z. Lou, Y. Zheng, C. Liu, L. Zhang, X. Ge, Y. Li, J. Wang, Z. Zeng, R. Li, and Z. Xu, “Ellipticity dependence of nonperturbative harmonic generation in few-layer MoS2,” Opt. Commun. 469, 125769 (2020).
- Yoshikawa et al. (2019) N. Yoshikawa, K. Nagai, K. Uchida, Y. Takaguchi, S. Sasaki, Y. Miyata, and K. Tanaka, “Interband resonant high-harmonic generation by valley polarized electron–hole pairs,” Nat. Commun. 10, 3709 (2019).
- Heide et al. (2022a) C. Heide, C. Heide, Y. Kobayashi, Y. Kobayashi, A. C. Johnson, F. Liu, F. Liu, T. F. Heinz, T. F. Heinz, D. A. Reis, D. A. Reis, and S. Ghimire, “Probing electron-hole coherence in strongly driven 2D materials using high-harmonic generation,” Optica 9, 512–516 (2022a).
- Yue et al. (2022) L. Yue, R. Hollinger, C. B. Uzundal, B. Nebgen, Z. Gan, E. Najafidehaghani, A. George, C. Spielmann, D. Kartashov, A. Turchanin, D. Y. Qiu, M. B. Gaarde, and M. Zuerch, “Signatures of multi-band effects in high-harmonic generation in monolayer MoS2,” Phys. Rev. Lett. (2022).
- Langer et al. (2016) F. Langer, M. Hohenleutner, C. P. Schmid, C. Poellmann, P. Nagler, T. Korn, C. Schüller, M. S. Sherwin, U. Huttner, J. T. Steiner, S. W. Koch, M. Kira, and R. Huber, “Lightwave-driven quasiparticle collisions on a subcycle timescale,” Nature 533, 225–229 (2016).
- Garg et al. (2016) M. Garg, M. Zhan, T. T. Luu, H. Lakhotia, T. Klostermann, A. Guggenmos, and E. Goulielmakis, “Multi-petahertz electronic metrology,” Nature 538, 359–363 (2016).
- Uzan et al. (2020) A. J. Uzan, G. Orenstein, Á. Jiménez-Galán, C. McDonald, R. E. F. Silva, B. D. Bruner, N. D. Klimkin, V. Blanchet, T. Arusi-Parpar, M. Krüger, A. N. Rubtsov, O. Smirnova, M. Ivanov, B. Yan, T. Brabec, and N. Dudovich, “Attosecond spectral singularities in solid-state high-harmonic generation,” Nat. Photon. 14, 183–187 (2020).
- Bionta et al. (2021) M. R. Bionta, E. Haddad, A. Leblanc, V. Gruson, P. Lassonde, H. Ibrahim, J. Chaillou, N. Émond, M. R. Otto, Á. Jiménez-Galán, R. E. Silva, M. Ivanov, B. J. Siwick, M. Chaker, and F. Légaré, “Tracking ultrafast solid-state dynamics using high harmonic spectroscopy,” Phys. Rev. Res. 3, 023250 (2021).
- Zong et al. (2023) A. Zong, B. R. Nebgen, S.-C. Lin, J. A. Spies, and M. Zuerch, “Emerging ultrafast techniques for studying quantum materials,” Nat. Rev. Mat 8, 224–240 (2023).
- Lv et al. (2021) Y. Y. Lv, J. Xu, S. Han, C. Zhang, Y. Han, J. Zhou, S. H. Yao, X. P. Liu, M. H. Lu, H. Weng, Z. Xie, Y. B. Chen, J. Hu, Y. F. Chen, and S. Zhu, “High-harmonic generation in Weyl semimetal -WP2 crystals,” Nat. Commun. 12, 6437 (2021).
- Baykusheva et al. (2021) D. Baykusheva, A. Chacón, J. Lu, T. P. Bailey, J. A. Sobota, H. Soifer, P. S. Kirchmann, C. Rotundu, C. Uher, T. F. Heinz, D. A. Reis, and S. Ghimire, “All-optical probe of three-dimensional topological insulators based on high-harmonic generation by circularly polarized laser fields,” Nano Lett. 21, 8970–8978 (2021).
- Schmid et al. (2021) C. P. Schmid, L. Weigl, P. Grössing, V. Junk, C. Gorini, S. Schlauderer, S. Ito, M. Meierhofer, N. Hofmann, D. Afanasiev, J. Crewse, K. A. Kokh, O. E. Tereshchenko, J. Güdde, F. Evers, J. Wilhelm, K. Richter, U. Höfer, and R. Huber, “Tunable non-integer high-harmonic generation in a topological insulator,” Nature 593, 385–390 (2021).
- Heide et al. (2022b) C. Heide, Y. Kobayashi, D. R. Baykusheva, D. Jain, J. A. Sobota, M. Hashimoto, P. S. Kirchmann, S. Oh, T. F. Heinz, D. A. Reis, and S. Ghimire, “Probing topological phase transitions using high-harmonic generation,” Nat. Photonics 16, 620–624 (2022b).
- Kivelson et al. (2020) S. A. Kivelson, A. C. Yuan, B. Ramshaw, and R. Thomale, “A proposal for reconciling diverse experiments on the superconducting state in Sr2RuO4,” npj Quantum Mater. 5, 43 (2020).
- Wille et al. (2016) M. Wille, C. Sturm, T. Michalsky, R. Röder, C. Ronning, R. Schmidt-Grund, and M. Grundmann, “Carrier density driven lasing dynamics in ZnO nanowires,” Nanotechnology 27, 225702 (2016).
- Look (2001) D. C. Look, “Recent advances in ZnO materials and devices,” Mat. Sci. Eng. B 80, 383–387 (2001).
- Pearton et al. (2003) S. J. Pearton, D. P. Norton, K. Ip, Y. W. Heo, and T. Steiner, “Recent progress in processing and properties of ZnO,” Superlattices Microstruct. 34, 3–32 (2003).
- Ozgur et al. (2005) U. Ozgur, Y. I. Alivov, C. Liu, A. Teke, M. A. Reshchikov, S. Dogan, V. Avrutin, S.-J. Cho, and H. Morkoc, “A comprehensive review of ZnO materials and devices,” J. Appl. Phys. 98, 041301 (2005).
- Golovanov et al. (2022) E. Golovanov, V. Kolesov, V. Anisimkin, V. Osipenko, and I. Kuznetsova, “ZnO Piezoelectric Films for Acoustoelectronic and Microenergetic Applications,” Coatings 12, 709 (2022), number: 5.
- Zhao et al. (2022) K. Zhao, J. Xie, Y. Zhao, D. Han, Y. Wang, B. Liu, and J. Dong, “Investigation on Transparent, Conductive ZnO:Al Films Deposited by Atomic Layer Deposition Process,” Nanomaterials 12, 172 (2022), number: 1.
- Rai et al. (2012) R. Rai, M. Guminiak, S. Wilser, B. Cai, and M. Nakarmi, “Elevated temperature dependence of energy band gap of ZnO thin films grown by e-beam deposition,” J. of Appl. Phys. 111 (2012), 10.1063/1.3699365.
- Dai et al. (2014) J. Dai, C. Xu, T. Nakamura, Y. Wang, J. Li, and Y. Lin, “Electron–hole plasma induced band gap renormalization in ZnO microlaser cavities,” Opt. Express 22, 28831–28837 (2014).
- Sentosa et al. (2011) D. Sentosa, B. Liu, L. Wong, Y. Lim, T. Wong, Y. Foo, H. Sun, and S. Wang, “Temperature dependent photoluminescence studies of ZnO thin film grown on (111) YSZ substrate,” J. Cryst. Growth 319, 8–12 (2011).
- Fan (1950) H. Y. Fan, “Temperature Dependence of the Energy Gap in Monatomic Semiconductors,” Phys. Rev. 78, 808–809 (1950).
- Muto and Oyama (1950) T. Muto and S. Oyama, “Theory of the Temperature Effect of Electronic Energy Bands in Crystals,” Prog. of Theor. Phys. 5, 833–843 (1950).
- Fan (1951) H. Y. Fan, “Temperature Dependence of the Energy Gap in Semiconductors,” Phys. Rev. 82, 900–905 (1951).
- Varshni (1967) Y. P. Varshni, “Temperature dependence of the energy gap in semiconductors,” Physica 34, 149–154 (1967).
- Hollinger et al. (2019) R. Hollinger, D. Gupta, M. Zapf, M. Karst, R. Röder, I. Uschmann, U. Reislöhner, D. Kartashov, C. Ronning, and C. Spielmann, “Polarization dependent multiphoton absorption in ZnO thin films,” J. Phys. D: Appl. Phys. 53, 055102 (2019).
- Jen et al. (2005) F.-Y. Jen, Y.-C. Lu, C.-Y. Chen, H.-C. Wang, C. C. Yang, B.-p. Zhang, and Y. Segawa, “Temperature-dependent exciton dynamics in a ZnO thin film,” Appl. Phys. Lett. 87, 252117 (2005).
- Li, Jiang, and Yang (2010) S. Li, Q. Jiang, and G. W. Yang, “Uniaxial strain modulated band gap of ZnO nanostructures,” Appl. Phys. Lett. 96, 213101 (2010).