Short-range magnetic correlations in quasicrystalline i-Tb-Cd
Abstract
We report on elastic and inelastic neutron scattering from single-grain isotopically-enriched samples to elucidate the local magnetic correlations between Tb3+ moments in quasicrystalline i-Tb-Cd. The inelastic neutron scattering measurements of the CEF excitations demonstrated that the Tb3+ moments are directed primarily along the local five-fold axes of the Tsai-type cluster as was found for the TbCd6 approximant phase. Based on the inelastic measurements, we consider of a simple Ising-type model for the moment configurations on a single Tb3+ icosahedron and enumerate the lowest energy moment configurations. We then calculate the diffuse scattering from these configurations and compare with the experimental magnetic diffuse scattering measurements to identify the most likely single cluster moment configurations and find reasonable agreement between the broad features observed in our scattering simulations. We further consider the role of higher-order (longer-range) intercluster correlations for the magnetic scattering.
I Introduction
Quasicrystals are metallic compounds that manifest aperiodic, rather than periodic, long-range positional order and rotational symmetries (e.g. 5-fold, 10-fold) forbidden for conventional periodic crystals.Shechtman_1984 Over the past 40 years, tremendous progress has been made in our understanding of the structure of quasicrystalline materials. In particular, the discovery of stable binary icosahedral quasicrystals Tsai_2000 and the elucidation of their structure via six-dimensional (6D) refinements have provided a detailed structural model of the icosahedral (i) phase.Takakura_2007; Yamada_2016 These studies have been greatly facilitated by the so-called crystalline approximants; large unit cell periodic crystals that feature local atomic motifs also found in the corresponding quasicrystalline phases.Goldman_1993
The i-R-Cd (R = Gd – Tm, Y) family of magnetic quasicrystalsGoldman_2013 and the closely related RCd6 cubic approximantsGomez_2003 comprise an ideal set of model systems for attaining a deeper understanding of magnetism in quasicrystals since binary quasicrystals provide the compositionally simplest systems for the study of magnetic interactions in aperiodic compounds. The RCd6 approximants may be described, at ambient temperature, as a body-centered cubic packing of interpenetrating rhombic triacontahedra, or the so-called Tsai-type clusters.Tsai_2000 These clusters are comprised of four successive shells surrounding a tetrahedron of four Cd atoms: a dodecahedron composed of 20 Cd atoms; an icosahedron of 12 R atoms, an icosidodecahedron of 30 Cd atoms; and an outermost shell described as a defect rhombic triacontahedron of 60 Cd atoms. These clusters are linked along the cubic axes by sharing a face and interpenetrating neighboring clusters along the body diagonal.Gomez_2003 Recent 6D structural refinementsYamada_2016 of i-R-Cd have shown that these Tsai-type clusters also form the backbone of the icosahedral phase, containing approximately 70% of the Tb atoms, with the remainder located within the Friauf polyhedra in the “glue” that fills the gaps between the clusters. These studies also suggest that up to 20% of the R ions on the icosahedron itself may be substituted by Cd, perhaps contributing to disorder related to magnetic frustration.
As the temperature is lowered, many RCd6 approximants undergo a structural transition that is triggered by the ordering of the Cd tetrahedra at the center of each cluster resulting in a monoclinic unit cell. For TbCd6, this phase transition occurs at K, and the monoclinic unit cell, with space-group C2/c, is described as a superstructure of the high-temperature body-centered cubic unit cell.Nishimoto_2013 As the temperature is further lowered, the RCd6 (R = Gd – Tm) magnetic approximants undergo a transition to an antiferromagnetic (AFM) ordered state at temperatures below TN, ranging from approximately 23 K for R = Tb to around 2 K for R = Tm.Tamura_2010; Kim_2012; Mori_2012 Preliminary analysis of neutron diffraction data from the TbCd6 approximant phase indicate that the antiferromagnetic ordering between the Tb3+ moments on each cluster follow the orientation of the inner Cd tetrahedra. However, details of the arrangement of the moments on each cluster are, as yet, unresolved.
In contrast to the magnetic order found for the some quasicrystal approximant phases, virtually all known magnetic quasicrystals manifest spin-glass-like behavior at low temperature.Hippert_2008; Sato_2005; Goldman_2014; Fisher_1999; Sebastian_2004 For the i-R-Cd icosahedral phases this occurs below the freezing temperature, TF, which varies from approximately 5.3 K for R = Tb down to 2 K for R = Tm.Kong_2014 Ferromagnetic order has been recently reported in icosahedral quasicrystals of i-Au-Ga-Gd and i-Au-Ga-Tb,Tamura_2021 and i-Au-Si-Tb.Hiroto_2020 However, the more complex case of long-range antiferromagnetic order has not been found for icosahedral quasicrystals even though many theoretical studies suggest the possibility.Godreche_1986; Okabe_1988; Lifshitz_1999; Lifshitz_2000; Wessel_2003; Vedmenko_2004; Matsuo_2004; Jagannathan_2004; Thiem_2015
Here, we describe elastic and inelastic neutron scattering measurements of the diffuse scattering from the icosahedral quasicrystal i-Tb-Cd. We present a model for the arrangement of Tb3+ moments on a single icosahedral cluster based on the analysis of the Crystalline Electric Field (CEF) level scheme determined from inelastic scattering measured using the Cold Neutron Chopper Spectrometer (CNCS) at the Spallation Neutron Source (SNS). Our calculation of the scattering from this model captures the broad features of the measured elastic diffuse scattering measured on CNCS and the Elastic Diffuse Scattering Spectrometer (CORELLI) at the SNS, and provides insight into the frustration that inhibits long-range magnetic order in the i-R-Cd quasicrystals. However, we also see finer-scale structure in the elastic diffuse scattering measurements that indicates that magnetic correlations extend beyond a single cluster in the i-phase. We attempt to gain some insight into the nature and role of these extended magnetic correlations through: (a) a simple model of packing icosahedral clusters (the ”icosahedral glass” modelStephens_1986) and (b) Monte Carlo simulations of spin correlations on and between neighboring icosahedra in the quasicrystalline structure obtained from the projection of the 6D structure of -Tb-Cd determined previously.Yamada_2016 Both approaches yield finer scale structure which more closely resembles the measured magnetic neutron scattering patterns, but clearly additional work is required. The Monte Carlo results provide further insight into the nature of magnetic frustration in these quasicrystalline systems.
II EXPERIMENTAL DETAILS
The i-Tb-Cd single-grain quasicrystals used for our neutron measurements were flux-grownCanfield_1992; Goldman_2013; Kong_2014; Canfield_2020 using isotopic 114Cd to minimize neutron absorption. The starting elements were packed in a frit-disc crucible set,Canfield_2020 with a molar ratio Tb:Cd = 0.8:99.2, which were then sealed in a silica tube under partial Ar atmosphere. The ampule was heated to 700∘C to realize a homogeneous liquid and slowly cooled to 330∘C. The remaining Cd solution was separated from the i-Tb-Cd single grains in a centrifuge. Given the cost of 114Cd as well as the exceptionally limited range of the liquidus line for i-R-Cd in the binary R-Cd phase diagrams, the nearly pure 114Cd decant was reused several times by adding in more Tb and regrowing i-Tb-Cd.Canfield_2016 After several regrowths, the remaining decanted liquid was used to grow large single crystals of the crystalline approximant TbCd6. Several of the larger single grains of the quasicrystal were co-oriented for the elastic and inelastic diffuse scattering measurements. A single crystal of the approximant was used for the inelastic scattering study.
All neutron scattering measurements were performed at the SNS and at the High Flux Isotope Reactor (HFIR), both situated at Oak Ridge National Laboratory. The polarized neutron scattering measurements were performed on the HB-1 triple-axis spectrometer at HFIR. A co-aligned set of seven quasicrystals with a combined mass of 1 g was placed in a He-cryostat to reach the temperature range, 1.8 K T 30 K. The samples were aligned such that the two-fold plane was coincident with the horizontal scattering plane. Measurements were taken in the P Q geometry (where P is the polarization vector and Q is the scattering vector), with an incident neutron energy of Ei = 13.5 meV and collimations of 48’ – 80’ – sample – 80’ – open. Pyrolytic graphite filters were placed both before and after the sample to reduce higher-order contamination. Heusler crystals were used as the monochromator and analyzer for the polarization setup with a flipping ratio of 10.
Elastic and inelastic neutron scattering measurements were performed at the CNCS at the SNS,Ehlers_2011; Ehlers_2016 with an incident energy of Ei = 10.04 meV using the same co-aligned set of samples. A background measurement taken at T = 30 K, above the spin-freezing temperature, was subtracted from the base temperature measurement at T = 2 K to extract the elastic magnetic diffuse scattering. The data were symmetrized and corrected for detector efficiency. A single crystal of mass 2.7 g was used for the TbCd6 measurement at CNCS using the same configuration as that for the quasicrystal.
Elastic diffuse scattering measurements were performed at CORELLIYe_2018 at SNS, which is a statistical chopper spectrometer with energy discrimination. A single quasicrystal of mass 200 mg, attached to the sample stick, was inserted in a He-cryostat for measurements at 2 K and 30 K. The sample was first aligned to have the horizontal scattering plane in the two-fold geometry, followed by remounting and realigning to measure the five-fold scattering plane.
III RESULTS AND DISCUSSION
III.1 Polarized neutron scattering measurements
Our measurements, detailed below, demonstrate the presence of significant magnetic diffuse scattering from i-Tb-Cd with overall icosahedral symmetry signaling the presence of strong short-range magnetic correlations at low temperature, similar to that found previously for R-based ternary quasicrystals such as i-R-Mg-Zn and i-R-Mg-Cd.Sato_2005 A small region of the unpolarized-beam elastic-diffuse neutron scattering, measured in the two-fold plane of i-Tb-Cd using CNCS, is shown in Fig. 1a.
The magnetic origin of the highly structured elastic diffuse scattering was confirmed by scans through the pattern using the polarized triple-axis spectrometer, HB-1, at the High Flux Isotope Reactor shown in Fig. 1b. Here, spin-flip scattering (SF) and non-spin-flip (NSF) scattering denote the magnetic and nuclear scattering contributions, respectively. The magnetic data taken at 1.8 K, below the spin-freezing temperature of 5 K, demonstrates the emergence of structure associated with short-range magnetic correlations, whereas the nuclear scattering is constant.

The temperature dependence of the magnetic and nuclear scattering is shown in Fig. 1c, where we see that the structured magnetic diffuse neutron scattering fades with increasing temperature and is all but absent above approximately 30 K. A rough estimate of the magnetic correlation length, made from the measured widths of the diffuse scattering features, is 10 – 20 Å, similar to what was previously found for i-Ho-Mg-Zn,Sato_1998 and consistent with the size of an icosahedron of Tb3+ moments (11 Å). This observation motivated further study of the possible magnetic correlations between the Tb3+ ions on a single icosahedron.
III.2 Inelastic magnetic neutron scattering and the Tb3+ single ion anistotropy
The number of possible magnetic configurations for 12 Tb3+ ions on a single icosahedron is essentially infinite. However, information regarding the single ion anisotropy, via inelastic neutron scattering, can provide important information that significantly limits the number of magnetic configurations to be considered. Previous inelastic neutron scattering measurements on the TbCd6 crystalline approximant found excitations below an energy transfer of 3 meV due to transitions among a manifold of crystalline electric field (CEF) levels.Das_2014 These excitations, and their evolution with temperature, were well characterized by considering only the leading term, B, of the CEF level scheme (Fig. 2b) for local pentagonal symmetry for the rare-earth ions (Fig. 2a), indicating that the Tb3+ moment is directed primarily along the unique local pseudo-five-fold axes of the Tsai-type clusters. We note here that this configuration corresponds to the magnetic texture, for = 0, considered by Watanabe.Watanabe_2021 Hiroto et al. have also considered the CEF scheme for Tb3+ in the quasicrystal approximant Au70Si17Tb13 and, for this alloy, found that the Tb3+ moments lie roughly in the plane perpendicular to the local pseudo-five-fold axes of the Tsai-type clusters.Hiroto_2020 The crystal field excitations in Au70Si17Tb13 are much broader than those we measured for TbCd6, attributed to the chemical disorder inherent to the ternary approximant, and peak at higher energy ( meV).
The inelastic neutron scattering measured on CNCS for single crystals of both the crystalline approximant (TbCd6) and the icosahedral phase (i-Tb-Cd) are shown in Figs. 2c and d. These data were taken at T = 30 K for the samples oriented with their respective two-fold planes coincident with the scattering plane, and averaged over a range of momentum transfers (Q) at low scattering angles to increase counting statistics. The lines through the data represent fits using the CEF level scheme of Reference Das_2014 allowing peak widths and energies to vary freely and the CEF parameters derived from the fits are given in Table 1.
The derived CEF parameters for the crystalline approximant are in good agreement with the previous powder measurement on the approximant phase, taken on IN4 at the Institut Laue-Langevin. For the icosahedral phase, the CEF parameters reflect small variations from the values for the approximant and additional peak broadening is in evidence, likely due to variations in the local environment of the Tb3+ ions. Nevertheless, the agreement of the spectra and fitting parameters indicate that the CEF level schemes are quite similar and, therefore, we take the Tb3+ moments to be directed primarily along the unique local five-fold axes of the Tsai-type clusters in the icosahedral phase as well.

| Sample | B | E(65) (meV) | FWHM (meV) |
| TbCd6 (IN4, ILL) | -0.073(1) | 2.41(4) | 1.0(2) |
| TbCd6 (CNCS, SNS) | -0.070(3) | 2.3(1) | 1.2(2) |
| i-Tb-Cd (CNCS, SNS) | -0.062(2) | 2.05(5) | 1.7(2) |
III.3 Modeling moment configurations on the Tb3+ icosahedral clusters
The inelastic neutron scattering results allow us to consider a simplified model for the spin configurations on a single icosahedron of Tb3+ moments for comparison with the results of our diffuse scattering measurements, detailed below. Specifically, we consider that each Tb3+ ion at the vertex of an icosahedron can assume only two directions; in, towards the center of the icosahedron along the local five-fold axis, or out. This constraint admits only 212 = 4096 spin arrangements, considerably simplifying calculations of the relative energy for each possible moment configuration. We calculated the energy of each Tb3+ icosahedron moment arrangement from a magnetic Hamiltonian for classical spins as:
| (1) |
where and are moment vectors that point in or out along the local five-fold axis at each vertex, i and j. We consider only nearest-neighbor () and next-nearest-neighbor () interactions, so that = or , with positive(negative) for ferromagnetic(antiferromagnetic) interactions.
The lowest energy configurations for ratios of are shown in Fig. 3 along with the point symmetries preserved by the resulting moment configuration. These configurations, of course, feature a high degeneracy. The degeneracy of the structures for each region, from A through F, is 2, 12, 60, 20, 60 and 12, respectively. The 60 clusters found in region C in Fig. 3 correspond to symmetry equivalent moment arrangements with a net cluster moment directed along one of the two-fold directions of the Tb3+ icosahedron. Similarly, the 12 degenerate moment configurations within region B correspond to symmetry equivalent moment arrangements with a net cluster moment directed along one of the five-fold directions of the Tb3+ icosahedron. For both regions, the the triangular faces features a (2 in/1 out) or (2 out/1 in) moment configuration. Interestingly, the exchange of only a single pair of Tb3+ moment directions on the icosahedron is required to change the moment configurations from region B to C or vice-versa (this is also true for regions E and F in Fig. 3). Region D corresponds to a net moment along one of the three-fold axes, and region A corresponds to a ”hedgehog” or ”unhappy-hedgehog” arrangement with no net moment for the cluster. The question remains as to which of these six lowest energy Tb3+ icosahedron moment arrangements most adequately describes the local magnetic correlations found in i-Tb-Cd.

III.4 Comparison of elastic diffuse scattering measurements with scattering simulations
We now turn to our measurements of the diffuse magnetic neutron scattering accomplished on the CNCS and CORELLI instruments at the SNS. In order to compare the measured patterns with the results of our analysis of moment configurations on a single icosahedron of Tb3+ moments, the scattering intensity was calculated for each ground-state moment configuration as:
| (2) |
where is the Tb3+ moment, is the position of the moment with respect to the center of the icosahedron, and is the magnetic form factor for Tb3+. The simulated scattering patterns were averaged over all symmetry equivalent moment arrangements within each region to yield the single-cluster diffuse scattering patterns for comparison with the measured data.
For comparison with the scattering calculations, the measured data taken at 30 K (where the structured diffuse scattering is absent) was subtracted from the data taken at 2 K (below the spin-freezing temperature) and the patterns were symmetrized. For example, two sets of the calculated diffuse scattering patterns are shown in Fig. 4, corresponding to averages over the 60 configurations found in regions C and the 60 configurations of Region E of Fig. 3. The scattering patterns for region C, corresponding to dominant AFM , produce features of the correct scale and placement relative to the measured pattern, whereas that for region E (dominant FM ) does not. Comparisons of the diffuse scattering patterns for all configurations within regions A - F are shown in the Appendix.
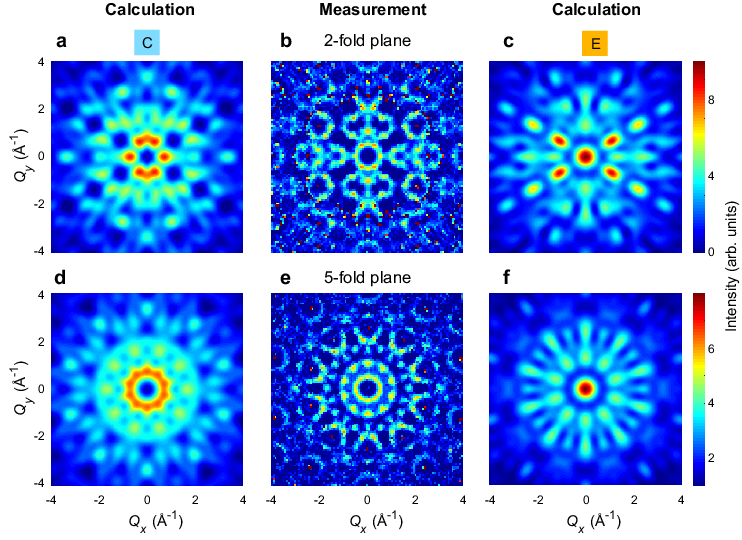
Figure 5 provides further detail, showing cuts through the calculated scattering patterns along the high-symmetry two-, three- and five-fold axes in the two-fold plane for regions C and E, and the elastic diffuse neutron scattering measured on CNCS. Again, the cuts through the calculated pattern for region C, multiplied by a single scale factor in Figs. 5b - d capture the overall scale and modulation of the scattering of the measured data, whereas the cuts extracted from region E (Figs 5e – g) are clearly at odds with the measurement. However, there is also additional fine-scale structure in the data shown in both Figs. 4 and 5 that is not well reproduced by the calculation. These differences most likely arise from intercluster magnetic correlations that are not captured by a single-cluster model as discussed below.
Inspection of all of the simulated elastic diffuse scattering patterns reveals that the closest agreement with the experimental data is found for the averaged moment arrangement in region C. However, as shown in the Appendix, the 12 moment arrangements within region B are also in reasonable agreement with the measured magnetic diffuse scattering along the two- and three-fold axes. Given the close similarity between the two arrangements (requiring the exchange of moment directions for only a single pair of Tb3+), the configurations within both regions B and C likely contribute to the scattering. Regardless, these comparisons demonstrate that the dominant magnetic interaction is antiferromagnetic between nearest-neighbor moments on the Tb3+ icosahedron, consistent with the negative Curie-Weiss temperature found in bulk measurements of the magnetic susceptibility for all i-R-Cd quasicrystals.Kong_2014 The antiferromagnetic interactions between moments arranged on the triangular faces of the icosahedron naturally give rise to geometrical frustration within the fundamental magnetic clusters of the icosahedral phase.

III.5 Heuristic modeling of intercluster correlations
Although the diffuse scattering for magnetic configuration in region C of Fig. 3 reproduces the broad-scale features of the measured magnetic diffuse scattering, there is additional finer-scale structure in Figures 4 and 5 that is not well reproduced by the single-icosahedron scattering calculation. Here, we present a very rudimentary model of inter-icosahedron correlations to illustrate one approach to incorporating longer length scale magnetic interactions. This approach is rooted in previous work employing the icosahedral glass modelStephens_1986 to describe nuclear diffuse scattering in some icosahedral alloys.Goldman_1988 It is also worth mentioning here that the -Tb-Cd quasicrystals do exhibit disorder characterized by a moderate degree of frozen-in phason straindeboissieu_2011, endemic to many icosahedral quasicrystals. This phason strain corresponds to errors or defects in the packing of structural subunits, similar to the more extreme case of an icosahedral glass. In both this section, and the next, we assume full occupancy of Tb3+ on the icosahedra.
Each icosahedral arrangement of Tb3+ moments features 20 triangular faces normal to the three-fold directions. If we connect two of these icosahedral with their faces rotated by 60 degrees, the Tb3+ ions on the boundaries of adjacent icosahedra form a nearly perfect octahedron since the inter-icosahedron Tb–Tb distance is nearly the same as the intra-icosahedron Tb–Tb separation, as shown in Fig. 6a. In TbCd6 each Tsai-type cluster is coordinated by eight other clusters joined in this manner along the three-fold directions of the body-centered cubic lattice. However, for the icosahedral phase, the coordination number is variable with the most frequently encountered coordination number of approximately 5.5.Takakura_2008; Takakura_2017

Our model considers that two icosahedra can be connected along any of the three-fold directions with equal probability (1/20) with the arrangement of neighboring icosahedra obeying steric constraints. That is, two icosahedra attached to a third do not interfere with each other. The diffuse scattering is calculated from an average over the scattering due to the 20 possible two-icosahedra configurations:
| (3) |
where the are the twenty inter-icosahedra vectors along three-fold axes and, as mentioned above, = . If we simply multiply the two-icosahedra structure factor by the single-icosahedron magnetic scattering for region C, shown in Figs. 4a and d, the scattering patterns in Figs. 6c and e result. These results are compared with the experimental data from CORELLI in Fig. 6b and d.
We find that even this simple model for FM inter-icosahedra magnetic correlations provides additional fine scale detail observed in the regions outlined by the white ovals in Figs. 6b and c and the circles in Figs. 6d and e. For example, in the fivefold pattern, the more intense scattering ring close to the center of the pattern in the single-cluster calculation is much reduced, and the 20 diffraction maxima in a corrugated ring near the boundary of the circle are now in evidence. In the two-fold pattern, the structure of the voids in the scattering are more closely modeled. However, the details of features in both the two-fold and five-fold planes are not fully captured in this simple treatment and, of course, a proper calculation of the “two-icosahedra structure factor” for the moment arrangements must take into account arrangements of moments from other regions in Fig. 3 (such as region B) which may come into play. Nevertheless, our inter-cluster modeling does point to a possible path forward in fully describing the diffuse magnetic neutron scattering for i-Tb-Cd and other magnetic icosahedral i-R-Cd quasicrystals.
Finally, we recall that only about 70% of the Tb3+ ions are associated with the icosahedron in the Tsai-type clusters of the quasicrystalline phase, with the balance located in the “glue” that fills the gaps between the clusters. Our modelling of the magnetic diffuse scattering assumes that these Tb3+ moments contribute only to the featureless paramagnetic background.
III.6 Monte-Carlo simulations of multi-cluster model
To further elucidate the role of inter-cluster correlations, we performed large-scale Monte Carlo (MC) simulations of a three-dimensional quasiperiodic spin system composed of connected icosahedral clusters. The spins are located on the vertices of the icosahedra such that the model contains spins in total. The real-space locations of the spins were obtained by projecting a higher-dimensional decorated model determined from single-grain diffraction measurements on -Tb-CdYamada_2016 onto three dimensions [see Fig. 7 (a)] and choosing 72 clusters from the interior of the projection.
Single-ion anisotropy forces each spin to point along a local five-fold axis and the spins can thus be modeled by Ising degrees of freedom . Based on our previous analysis of the single cluster model, we considered an antiferromagnetic (AFM) (Heisenberg) spin interaction between nearest-neighbor spin pairs, such that the Hamiltonian of Eqn. (1) reads
| (4) | |||
Here, we have defined an effective Ising interaction constant . Nearest-neighbor spins can be located on the same or different clusters. These situations are illustrated in the inset of Fig. 7(a). In both cases, the spins are separated by a real-space distance Å and they thus exhibit the same AFM interaction . The different geometry, however, affects the sign of the effective Ising interaction constant . Specifically, the scalar product of the two local five-fold axes has equal magnitude but opposite sign depending on whether the spins and are on the same or neighboring clusters. If they are located on the same cluster, we find , whereas if they reside on different clusters. As a result, Ising spins on the same cluster interact via an AFM effective Ising spin interaction , but spins on different clusters interact ferromagnetically with . In the following, we drop the tilde notation and use to refer to the Ising interaction strength in our effective Ising model.

To simulate the finite temperature behavior of the quasicrystal Ising model, we performed parallel-tempering MC simulations, where each MC step consists of a local Metropolis update followed by a parallel-tempering move Marinari_1992; Hukishima_1996. Our simulations used MC steps in total, the first half of which was discarded to allow for thermalization. After thermalization, the observables were measured every MC steps and we performed a total of measurements. Errors were calculated using the standard Jackknife method Efron_1982. We simulated logarithmically spaced temperatures between in parallel. In Fig. 7(b) we show the specific heat versus temperature, , exhibits a broad peak around , that is reminiscent of spin glass behavior across the freezing transition.
Next, we studied the local arrangement of spins on the fundamental triangular units of the system, which yields insight into the type of frustration in the model. The system has spin triangles in the system, which can be separated into three classes, shown in Fig. 7(c). There are triangles where all spins belong to the same icosahedron cluster, triangles where spins are shared between two clusters, and triangles where all three spins belong to different clusters. The effective Ising exchange interaction across intracluster bonds is antiferromagnetic, while it is ferromagnetic across intercluster bonds. Therefore, the triangle classes exhibit different energy spectra of the eight possible spin states with . Figure 7(c) shows a representative ground state configuration for the respective triangle classes and their degeneracy. Specifically, the lowest energy states on the triangles are the (2-in/1-out) and (2-out/1-in) states with energy , while the two excited states have energy . In contrast, the triangles connect two clusters. Taking the bonds between and between to be FM, the ground states are thus with energy , while the two excited states are with energy . Finally, the lowest energy states on the triangles, where all spins interact FM, are with energy . The remaining six excited states have energy .

In Fig. 8, we show the average number of triangles of type , , and , where the spins are in their lowest energy configuration. For the triangles that connect two clusters, we separate the four AFM ground state configurations from the two FM ones. We also graph the number of triangles with excited spin configurations. As the temperature is reduced, the number of triangles in a ground state configuration increases, and in Fig. 8(a), we observe that almost all () of the triangles reach their ground state. These correspond to the ground states of a single icosahedron in phase B and C (see Fig. 3). However, the situation is different on the triangles that connect different clusters. As shown in Fig. 8(b) and (c), about of the triangles and of the triangles remain in an excited state configuration at low temperatures. This is typical for glassy systems that host a complex energy landscape with an large number of local minima. In the quasicrystal Ising model, the behavior results from the strong magnetic frustration that leads to a large number of degenerate spin configurations on a single-cluster. As shown in the previous section, there are degenerate single cluster states counting both states in phase B (12 states) and C (60 states). While these states are degenerate on a single disconnected cluster, different cluster configurations cannot be connected in a way that satisfies every inter-cluster bond and a large fraction of triangles and remains in an excited state. The inter-cluster connections impose “longer-range” constraints that break the degeneracy between different (isolated) cluster configurations, which leads to a complex energy landscape.
We have also calculated the averaged structure factor at temperature using Eq. (2). We chose this temperature since it corresponds to the location of the broad peak in the specific heat [see Fig. 7(b)]. We obtained by averaging over statistically independent spin snapshot configurations obtained in the MC simulation. The snapshots were taken every MC steps after an initial period of thermalization steps. Fig. 9 shows results in the fivefold (a) and twofold (b) scattering plane, together with the experimental data from Fig. 4. One-dimensional cuts through the data along the twofold, threefold, and fivefold directions are shown in Fig. 10. Overall, we find reasonable agreement with the experimental result and can identify several common features. The simulation reproduces the characteristic ring of scattering and the regions of low intensity in the fivefold plane and the region of low scattering around the fivefold direction in the twofold plane. However, we can also identify features in the experimental data that are not captured in the model, such as the elongated regions of low intensity discussed in Fig. 6, which points towards the importance of further neighbor interactions and quenched disorder that is not included in the quasicrystalline model. The importance of disorder is further corroborated by the success of the heuristic quasicrystal glass model in capturing regions of low scattering intensity, as discussed in the previous section and Fig. 6.


In Fig. 10, we show one-dimensional cuts along high-symmetry directions in the twofold plane to make a more quantitative comparison to the experimental data and the single cluster model in phase C. Along the twofold direction [see Fig. 10(a)], we observe that each of the broad single-cluster peaks at Å-1 and Å-1 split into two peaks in the model. This peak splitting is an good agreement with the experimental data. The single cluster peak at Å-1 is shifted towards smaller momentum values in the model, and the shifted location coincides well with an experimental peak. However, in contrast to the single cluster model, the quasicrystal model does not capture the experimental peak at Å-1. Along the threefold direction [see Fig. 10(b)] we observe five peaks in the experimental data, but only four peaks in the simulation. The peaks in the quasicrystal model are slightly shifted compared to the experiment and the peak height found in the simulation also shows some disagreement with experiment. While the experiment shows a pronounced peak at Å-1 and a smaller one nearby at Å-1, the quasicrystal model exhibits a single peak at Å-1 with a peak maximum close to the smaller experimental peak height. Interestingly, the single cluster model exhibits a single peak at Å-1, whose height closely matches that of the dominant experimental one. While there exists a third experimental peak at Å-1, the model shows a peak at a slightly smaller wavevector Å-1. Finally, two experimental peaks at Å-1 and Å-1 are well captured by the quasicrystal model simulations. Along the fivefold direction [see Fig. 10(c)], the quasicrystal results more closely agree with the single cluster model in phase C. Both show a slightly lower intensity compared to the other high-symmetry directions, which is in agreement with experiment. The location of these peaks is in reasonable agreement with experiment, even though the peak heights in the simulation are smaller by a factor of two.
IV Summary
Summarizing, we have used elastic and inelastic neutron scattering from single-grain isotopically-enriched samples to elucidate the local magnetic correlations between Tb3+ moments in quasicrystalline i-Tb-Cd. The inelastic neutron scattering measurements of the CEF excitations demonstrated that the Tb3+ moments are directed primarily along the local five-fold axes of the Tsai-type cluster as was found for the TbCd6 approximant phase.Das_2014 This allowed the consideration of a simplified Ising-type model for the moment configurations, which we first examined for a single Tb3+ icosahedron. A survey of the lowest energy moment configurations on a single icosahedron, as a function of first and second neighbor couplings, and the comparison with the elastic diffuse neutron scattering measurements indicates that the spins on each triangular face of the cluster feature a (2 in/1 out) or (2 out/1 in) moment configuration. The antiferromagnetic interaction between moments arranged on the triangular faces of the icosahedron gives rise to geometrical frustration with a large ground state degeneracy. The best candidate spin structure(s) find reasonable agreement with the measured magnetic diffuse scattering although longer-range magnetic correlations are also evident.
In an attempt to elucidate the nature of these longer range correlations we investigated two models which assume full occupancy of the Tb icosahedra. The first makes use of the icosahedral glass model to extend the structure beyond a single cluster albeit with significant intrinsic disorder. Nevertheless, this approach yields diffuse scattering profiles in closer agreement with our measurements. We also employed MC simulations of a quasicrystal model obtained by a projection of the 6D atomic structure down to three dimensions. The clusters reproduces several general features of the experimental structure factor, which indicates a dominant, antiferromagnetic nearest-neighbor interaction in the material. On a single icosahedron, this leads to a large ground state degeneracy with degenerate spin configurations (phase B and C). Connecting clusters via nearest-neighbor bonds imposes additional constraints that cannot be simultaneously satisfied, leaving behind bonds, where spins remain in an excited state. This lifts the ground state degeneracy and leads to a complex energy landscape with a large number of local minima. We observe that of the triangles that connect two clusters and of those that connect three clusters, remain in an excited state at low temperatures. This is further corrobated by the behavior of the specific heat that exhibits a broad peak around , consistent with spin glass behavior. Finally, the fact that some features in the experimental data are not captured in the model simulations indicates the importance of further neighbor spin-spin interactions and quenched disorder in the material. Taking these effects into account in a theoretical model simulation is an interesting direction for future study.
Acknowledgements.
The authors would like to thank M. deBoissieu, T. J. Sato and R. Tamura for very useful discussions. P.P.O. thanks A. Vishwanath and Harvard University for hospitality during the final stages of this project. This research used resources at the High Flux Isotope Reactor and Spallation Neutron Source, a DOE Office of Science User Facility operated by the Oak Ridge National Laboratory. This work was supported by the U.S. Department of Energy, Office of Basic Energy Science, Division of Materials Sciences and Engineering. The research was performed at the Ames Laboratory. Ames Laboratory is operated for the U.S. Department of Energy by Iowa State University under Contract No. DE-AC02-07CH11358.APPENDIX
Figures 11 through 16 compare scans through the magnetic diffuse neutron scattering for Tb3+ icosahedron moment configurations corresponding to regions A through F, respectively. Panel a of each Figure shows the scattering pattern measured for the two-fold plane using the CNCS spectrometer at the Spallation Neutron Source. The white lines in panel a denote the high-symmetry two-fold (2f), three-fold (3f) and five-fold (5f) axes. Panels b through d show cuts through the diffuse magnetic neutron scattering along these high-symmetry directions. The points denote the measured data and the solid lines denote the calculated curves. Panel e shows the calculated magnetic diffuse neutron scattering pattern in the two-fold plane averaged over the magnetic configurations for each region in Figure 3 as described in the main text.


.


References
- (1) D. Shechtman, I. Blech, D. Gratias, and J. W. Cahn, Phys. Rev. Lett. 53, 1951 (1984).
- (2) A. P. Tsai, J. Q. Guo, E. Abe, H. Takakura and T. J. Sato, Nature 408, 537 (2000).
- (3) H. Takakura, C. Pay Gómez, A. Yamamoto, M. De Boissieu, and A. P. Tsai, Nature Mater. 6, 58 (2007).
- (4) T. Yamada, H. Takakura, T. Kong, P. Das, W. T. Jayasekara, A. Kreyssig, G. Beutier, P. C. Canfield, M. De Boissieu, and A. I. Goldman , Phys. Rev. B 94, 060103(R) (2016).
- (5) A. I. Goldman and K. F. Kelton, Rev. Mod. Phys. 65, 213 (1993).
- (6) A. I. Goldman, T. Kong, A. Kreyssig, A. Jesche, M. Ramazanoglu, K. W. Dennis, S. L. Bud’ko and P. C. Canfield, Nature Mater. 12, 714 (2013).
- (7) C. Pay Gómez and S. Lidin, Phys. Rev. B 68, 024203 (2003).
- (8) K. Nishimoto, T. Sato and R. Tamura, J. Phys.:Condens. Matter. 25, 235403 (2013).
- (9) P. W. Stephens and A. I. Goldman, Phys. Rev. Lett. 56, 1168 (1986).
- (10) R. Tamura, Y. Muro, T. Hiroto, K. Nishimoto, and T. Takabatake, Phys. Rev. B 82, 220201(R) (2010).
- (11) M. G. Kim, G. Beutier, A. Kreyssig, T. Hiroto, T. Yamada, J. W. Kim, M. De Boissieu, R. Tamura and A. I. Goldman, Phys. Rev. B 85, 134442 (2012).
- (12) A. Mori, H. Ota, S. Yoshiuchi, K. Iwakawa, Y. Taga, Y. Hirose, T. Takeuchi, E. Yamamoto, Y. Haga, F. Honda, R. Settai and Y. Ōnuki, J. Phys. Soc. Jpn. 81, 024720 (2012).
- (13) A. Kreyssig and J. -U. Hoffmann, private communication.
- (14) F. Hippert, and J. J. Prejean, Phil. Mag. 88, 2175 (2008).
- (15) T. J. Sato, Acta Cryst. A 61, 39 (2005).
- (16) A. I. Goldman, Sci. Technol. Adv. Mater. 15, 044801 (2014).
- (17) I. R. Fisher, K. O. Cheon, A. F. Panchula, P. C. Canfield, M. Chernikov, H. R. Ott, and K. Dennis, Phys. Rev. B 59, 308 (1999).
- (18) S. E. Sebastian, T. Huie, I. R. Fisher, K. W. Dennis, and M. J. Kramer, Phil. Mag. 84, 1029 (2004).
- (19) T. Kong, S. L. Bud’ko, A. Jesche, J. McArthur, A. Kreyssig, A. I. Goldman, and P. C. Canfield, Phys. Rev. B 90, 014424 (2014).
- (20) R. Tamura, A. Ishikawa, S. Suzuki, T. Kotajima, Y. Tanaka, T. Seki, N. Shibata, T. Yamada, T. Fuji, C. -W. Wang, M. Avdeev, K. Nawa, D. Okuyama and T. J. Sato, J. Am. Chem. Soc. 143, 19938 (2021).
- (21) T. Hiroto, T. J. Sato, H. Cao, T. Hawai, T. Yokoo, S. Itoh and R. Tamura, J. Phys.: Condens. Matter 32, 415802 (2020).
- (22) C. Godréche, J. M. Luck and H. Orland, J. Stat. Phys. 45, 777 (1986).
- (23) Y. Okabe and J. Niizeki, J. Phys. Soc. Jpn. 57, 16 (1988).
- (24) R. Lifshitz, Phys. Rev. Lett. 80, 2717 (1998).
- (25) R. Lifshitz, Mater. Sci. Eng. A 294, 508 (2000).
- (26) S. Wessel, A. Jangannathan and S. Haas, Phys. Rev. Lett. 90, 177205 (2003).
- (27) E. Y. Vedmedenko, U. Grimm and R. Wiesendanger, Phys. Rev. Lett. 93, 076407 (2004).
- (28) S. Matsuo, S. Fujiwara, H. Nakano and T. Ishimasa, J. Non-Cryst. Solids 334&335, 421 (2004).
- (29) A. Jagannathan, Phys. Rev. Lett. 92, 047202 (2004).
- (30) S. Thiem and J. T. Chalker, Phys. Rev. B 92, 224409 (2015).
- (31) P. C. Canfield and Z. Fisk, Philos. Mag. B 65, 1117 (1992).
- (32) P. C. Canfield Rep. Prog. Phys. 83, 016501 (2020).
- (33) P. C. Canfield, T. Kong, U. S. Kaluarachchi and N. H. Jo, Philos. Mag. 96, 84 (2016).
- (34) G. Ehlers, A. Podlesnyak, J. L. Niedziela, E. B. Iverson, and P. E. Sokol, Rev. Sci. Instrum. 82, 085108 (2011).
- (35) G. Ehlers, A. Podlesnyak, and A. I. Kolesnikov, Rev. Sci. Instrum. 87, 093902 (2016).
- (36) F. Ye, Y. Liu, R. Whitfield, R. Osborn and S. Rosenkranz, J. Appl. Cryst. 51, 315 (2018).
- (37) T. J. Sato, H. Takakura, A. P. Tsai and K. Shibata, Phys. Rev. Lett. 81, 2364 (1998).
- (38) P. Das, P. -F. Lory, R. Flint, T. Kong, T. Hiroto, S. L. Bud’ko, P. C. Canfield, M. De Boissieu, A. Kreyssig and A. I. Goldman, Phys. Rev. B 95, 054408 (2014).
- (39) S. Watanabe, Proc. Nat. Acad. Sci. 118, e2112202118 (2021)
- (40) A. I. Goldman, C. A. Guryan, P. W. Stephens, J. M. Parsey, Jr., G. Aeppli, H. S. Chen and F. W. Gayle, Phys. Rev. Lett. 61, 1962 (1988).
- (41) H. Takakura, Phil. Mag. 88, 1905 (2008).
- (42) H. Takakura and S. Radosław, J. of Phys.: Conference Series 809, 012002 (2017).
- (43) M. de Boissieu, Isr. J. Chem 51, 1292 (2011).
- (44) E. Marinari and G. Parisi, Europhys. Lett. 19, 451 (1992).
- (45) K. Hukushima and K. Nemoto, J. Phys. Soc. Jpn. 65, 1604 (1996).
- (46) B. Efron, The Jackknife, the Bootstrap, and Other Resampling Plans (Society for Industrial and Applied Mathematics, Philadelphia, USA, 1982), Vol. 38.