A Search for X-ray/UV Correlation in the Reflection-Dominated Seyfert 1 Galaxy Mrk 1044 Facilities: XMM-NewtonpyDCF (Edelson & Krolik 1988), ZDCF (Alexander 1997), JAVELIN (Zu et al. 2011)
Abstract
Correlated variability between coronal X-rays and disc optical/UV photons provides a very useful diagnostic of the interplay between the different regions around an active galactic nucleus (AGN) and how they interact. AGN that reveal strong X-ray reflection in their spectra should normally exhibit optical/UV to X-ray correlation consistent with reprocessing – where the optical/UV emission lag behind the X-rays. While such correlated delay has been seen in some sources, it has been absent in others. Mrk 1044 is one such source that has been known to reveal strong X-ray reflection in its spectra. In our analysis of three long XMM-Newton and several Swift observations of the source, we found no strong evidence for correlation between its UV and X-ray lightcurves both on short and long time scales. Among other plausible causes for the non-detection, we posit that higher X-ray variability than UV and strong general relativistic effects close to the black hole may also be responsible. We also present results from the spectral analysis based on XMM-Newton and NuSTAR observations, which show the strong soft X-ray excess and iron K line in the 0.3–50 keV spectrum that can be described by relativistic reflection.
Keywords:
Black hole physics (159) — Active galaxies (17) — Seyfert galaxies (1447) — High-energy astrophysics (739)I Introduction
Emission variability in active galactic nuclei (AGN) has been observed over the entire electromagnetic spectrum – from radio to gamma rays – and over an extensive range of timescales (McHardy et al. 1999; Uttley & Mchardy 2004; Breedt et al. 2010).
AGN host a supermassive black hole (SMBH) at their centres. Accretion of matter onto the black hole powers the AGN, turning gravitational energy into kinetic and viscous internal energy. As a result, the accretion disc emits thermal radiation, mostly seen in optical/UV energies (Koratkar & Blaes 1999). The X-ray emission from AGN has been interpreted as a consequence of inverse-Compton scattering of seed optical/UV photons from the accretion disc interacting with energetic electrons in a “corona” (Haardt & Maraschi 1993; Merloni & Fabian 2003; Fabian et al. 2015; Wilkins & Gallo 2015a; Adegoke et al. 2017; Barua et al. 2020).
It has been shown over the past few decades that emission in the different energy bands around AGN tend to correlate in their variability for many sources. Of particular interest is the correlation in variability between emission in the optical/UV – produced in the geometrically thin, optically thick disc (Shakura & Sunyaev 1973; Novikov & Thorne 1973) – and those in the X-rays. Published results from such emission variability studies have shown varying trends, which sometimes are also a function of the timescale considered. Some sources show correlated variability such that the X-ray photons lead the optical/UV photons and this is normally interpreted as indicative of reprocessing – where the X-rays have been reprocessed into the observed optical/UV photons after reflection in the disc (Uttley et al. 2003; Arévalo et al. 2009; Cameron et al. 2012; McHardy et al. 2014; Edelson et al. 2015a; Pal et al. 2017; Buisson et al. 2017; Lobban et al. 2018, see e.g.,). Systems that exhibit this sense of variability are additionally expected to show signatures consistent with a reflection-dominated spectrum, e.g. broad iron emission features seen at (Fabian et al. 2004), since strong X-ray reflection components naturally imply that the X-rays strongly illuminates the inner disc.
For a handful of sources, the optical/UV emission lead the X-rays in their variability and this has been argued to result from the inverse Compton scattering of disc optical/UV photons into X-rays (Arévalo et al. 2005; Adegoke et al. 2019) or the inward propagation of fluctuations through the accretion disc (Marshall et al. 2008; Gliozzi et al. 2013). Other sources either reveal a complex X-ray/UV correlated behaviour (Pawar et al. 2017; Pal et al. 2018; Kumari et al. 2021, e.g.,) or a correlation consistent with zero lag (Breedt et al. 2009, e.g.,).
A few other sources still, show no measurable correlation in their optical/UV and X-ray variabilities. For example, in the multi-epoch XMM-Newton observations of the narrow-line Seyfert 1 (NLS1) AGN 1H 0707-495, Robertson et al. 2015 found no correlation between the UV and the X-ray emission variability. Also, Buisson et al. 2018 detected no physically plausible correlation from the Swift and XMM-Newton observations of the highly variable NLS1 AGN IRAS 13224-3809. This is despite the fact that both systems have been known to show strong signatures of reflection in their X-ray spectra.
Mrk 1044 is a nearby highly accreting NLS1 AGN at a redshift of that has been known for its peculiar variability properties having been observed multiple times in different energy bands (Wang & Lu 2001; Dewangan et al. 2007; Du et al. 2015; Mallick et al. 2018; Gliozzi & Williams 2020, see e.g.,). Using a short XMM-Newton observation of Mrk 1044, Dewangan et al. 2007 found no evidence for a lag between the and the . X-ray bands on the basis of which they ruled out reprocessing as the plausible origin of its prominent soft X-ray excess. From the broadband 2013 XMM-Newton and 2016 NuSTAR observations of the source, Mallick et al. 2018 found prominent soft and hard X-ray excesses as well as iron line well described by the relativistic reflection model. The observations revealed that the X-ray continuum of Mrk 1044 can adequately be described by the relativistic reflection model similar to those of 1H 0707-495 and IRAS 13224-3809. The black hole mass of Mrk 1044 has been measured through reverberation mapping campaign to be (Wang & Lu 2001; Du et al. 2015). Couple of studies quantified the accretion rate () that is ranging over 1.2 (Husemann et al. 2022) to 16 (Du et al. 2015). Applying the bolometric correction term () for 2–10 keV X-ray luminosity, the accretion rate has also been found to (Laha et al. 2018).
| Observation ID | Name | X-ray/UV exposure (ks) | Estimations | UV | SX | HX | Total X-ray |
|---|---|---|---|---|---|---|---|
| 0695290101 | XMM13 | 133/80 | count rate (c/s) | 28.460.06 | 15.750.02 | 1.50.01 | 17.220.02 |
| 2.420.27 | 19.80.09 | 15.390.07 | 19.270.08 | ||||
| 0824080301 | XMM18 | 140/132 | count rate (c/s) | 45.250.24 | 37.100.02 | 2.670.06 | 39.130.50 |
| 8.000.02 | 20.400.10 | 20.930.09 | 21.310.05 | ||||
| 0841820201 | XMM19 | 130/130 | count rate (c/s) | 37.330.06 | 21.760.02 | 1.770.01 | 23.530.02 |
| 1.80.35 | 19.220.08 | 18.400.01 | 19.000.01 | ||||
| 00035760007-31 | Swift | 24.6/24.3 | count rate (c/s) | 60 2.01 | 1.660.15 | 0.450.03 | 2.110.18 |
| 17.30.005 | 460.01 | 360.02 | 43.30.01 | ||||
| 60401005002 | NuSTAR | 267 | count rate (c/s) | – | – | – | 0.70.0.01 |


.
Here, we investigate short-term and long-term correlated X-ray/UV variability in Mrk 1044 using three long XMM-Newton and numerous Swift observations. We further explore X-ray reflection dependency of the source via spectroscopic analysis with one of the XMM-Newton and longest NuSTAR observations.
This paper is organised as follows: In Section 2, we discuss the observation and data reduction procedure. Section 3 includes a detailed discussion on the correlation analysis, methods and the results. Section 4 presents the X-ray spectral analysis. In Section 5, we provide interpretation for our results and then conclude with section 6.
II Observations and Data Reduction
II.1 XMM-Newton
Mrk 1044 has been observed several times by XMM-Newon (Jansen et al. 2001). The observations of the source carried out in 2013, 2018 and 2019 (Observation IDs: 0695290101, 0824080301 and 0841820201 respectively) are particularly useful in studying X-ray/UV variability and their plausible correlations. This is because the observations made use of both the European Photon Imaging Cameras (EPIC) (Strüder et al. 2001) in the X-ray band and the Optical Monitor (OM) (Mason et al. 2001) observing in the optical/UV bands – with the OM observations carried out in the image+fast mode. Therefore, we have used these three observations in our analysis. Details of these observations are presented in Table 1 and are named XMM13 (0695290101), XMMM18 (0824080301) and XMM19 (0841820201). During all three observations, the EPIC-pn was operated in the small window mode using thin filter for XMM13 and medium filters for XMM18 and XMM19. For XMM13, the OM observation was carried out using the U, B, V, UVW1, UVW2, and UVM2 filters while only the UVW1 filter was used during XMM18 and XMM19. Here, we have used the UVW1 OM observations (with effective wavelength ) having total exposure times of from XMM13, for XMM18 and from XMM19 alongside the EPIC-pn X-ray observations of duration for XMM13, for XMM18 and for XMM19. The UVW1 observations comprise a collection of 20 short exposures for XMM13, 29 for XMM18 and 25 exposures for XMM19. Other XMM-Newton observations of Mrk 1044 were not usable either due to minimal exposure as in the 2002 observation, unphysical trend in the UV lightcurves or issue in X-ray detection as evident in the other 2018 observations.


The XMM-Newton data files were processed with the Science Analysis System (sas v.17.0.0) using updated Current Calibration Files (CCF). The event file lists were extracted using the evselect task. Afterwards, the data sets were screened and filtered for any high background flares, following which a good time interval (gti) file was created. Using this gti file with the event files, a clean event file was produced again with the evselect tool. With this clean event file, EPIC-pn image files were created from which circular source regions of 50 arcseconds and nearby background circular regions of 60 arcseconds were extracted from the same CCDs. Adopting these regions from the image files, spectra and lightcurve products were generated for both the sources and their respective backgrounds. We used a time bin size of s for creating the lightcurves. Background-subtracted lightcurves were then created using the epiclccorr task in three different X-ray energy bands, (soft band), (hard band) and (full band) respectively. Fig. 1 shows the representative lightcurevs for soft and hard X-ray bands. By applying the sas tasks rmfgen and arfgen respectively, we constructed rmf and arf files. The spectra were then grouped using the specgroup command to have at least 20 counts per spectral bin.
The SAS meta-task omfchain was used to extract the UVW1 event list and to generate the lightcurves using binning. For the respective observations, all the UVW1 lightcurve files from the individual exposures were combined to obtain net UVW1 lightcurves. The UVW1 lightcurves are displayed in the top panels of Fig. 1.

II.2 Swift
Swift (Gehrels et al. 2004) has multiple optical/UV and X-ray observations of Mrk 1044 spanning several years. In this work, we have used data from the monitoring campaign of 2018 when the source was observed for several days in August. Table 1 includes details about the observations used. For UVOT (Roming et al. 2005), the lightcurves were extracted from the image files generated as part of the level II data. We employed UVOTSOURCE to perform photometry on the image products using the UVW1 filter which has about the same effective wavelength as the OM-UVW1 filter in XMM-Newton. For the extraction of the lightcurve, a circular source region of radius 5 arcsec is chosen and a larger source free region of radius 15 arcsec is selected for the background. Following the procedure outlined in Edelson et al. 2015b, the UVOT data were filtered by eliminating the exposures in which the source region encounters certain areas of the detector that result in low counts. Finally, all the short exposures were summed to obtain the net lightcurve. UVW1 lightcurve from Swift is displayed in the top panel of Fig. 4.
Swift XRT (Burrows et al. 2005) lightcurves were generated in three different energy ranges; (soft X-ray), 1.5–10 keV (hard X-ray) and 0.3–10 keV (full X-ray). We show the soft/hard X-ray lightcurves in Fig. 4. The X-ray data were obtained in the photon counting (PC) mode. We used the publicly available Swift-XRT products11 1 https://www.swift.ac.uk/user_objects/ (Evans et al. 2007; Evans et al. 2009) to obtain these lightcurves. The selection criterion imposed for the extraction regions is that the source is of 1.2 arcmin, and an annulus background region of radii from 2.3 to 7 arcmin.
II.3 NuSTAR
Mrk 1044 has been observed by NuSTAR a number of times. We use the longest one obtained from 2018 (ObsID: 60401005002; see Table 1). This observation was carried out for a duration of . The data were reduced using the standard NuSTAR data analysis software nustardas v1.8.0 and caldb v20171002. While the nupipeline command was employed to generate the cleaned event files and images, the nuproducts meta-task was used to generate the final products including the lightcurves, source and background spectra as well as the associated response files. The source and background regions used with nuproducts were of 90 arcsec and 100 arcsec radii respectively. The spectra were then grouped using grppha to have a minimum of 50 counts per spectral bin.


III Lightcurves, Correlation Analysis and Results
III.1 Short time scale correlation
From visual inspection on the XMM-Newton lightcurves shown in Figure 1 it is clear that Mrk 1044 exhibits significant X-ray variability on short timescales for all three Epochs of observation. On the other hand, while the UV lightcurve from XMM18 also show significant variability, the UV lightcurves of XMM13 and XMM19 appear to have a long-term trend. It is worth to note the fact that the source was in the brightest state during the 2018 observation, both in the UV and X-rays. To quantify the variability exhibited by the source, we estimated the fractional variability amplitude (Vaughan et al. 2003) in each energy band. The estimated count rates averaged over the exposure time and the values are quoted in Table 1. The variability amplitudes of the X-ray variations are notably higher than those in the UV as is mostly the case for typical AGN. The UV variability are however still significant.
To investigate the X-ray/UV emission variability and their correlation, we employed three different widely-used cross-correlation analysis methods (Adegoke et al. 2019, see e.g.,), For XMM13, we considered the X-ray lightcurves of exposure (out of the total exposure) that was simultaneous with the UVW1 exposures. In the top plot of Fig. 1, the vertical dotted line marks the duration of the X-ray/UV simultaneous observations for XMM13. For XMM18, we considered lightcurves spanning the entire duration in both the UV and the X-rays (shown in the middle plot of Fig. 1). Similarly, for XMM19 we used UV/X-ray lightcurves covering the entire duration of the outburst (shown in the bottom plot of Fig. 1) for cross-correlation analysis.
We first employed the Discrete Correlation Function (DCF) method of Edelson & Krolik 1988. We used the python implementation of the code pyDCF22 2 https://github.com/astronomerdamo/pydcf which has been used widely on sampled or grouped data. In the runs, we imposed a lag bin width of . Determining the right lag bin with is always a compromise between statistical accuracy and resolution. A hard minimum for this value is typically set by the lightcurve time resolution. A careful look at Fig. 2 indicates multiple DCF peaks in all cases. For XMM13 and XMM19, the peaks lie below suggesting that there is no single peak that can be considered to be significant enough to indicate any time lag between the X-ray and the UV lightcurves. For XMM18 however, one of the DCF peaks extend up to , pointing to the possibility of a weak anti-correlation at ( confidence level). XMM19 also tends to reveal a weak anti-correlation between the X-ray and the UV bands around at the 95% confidence interval. Similarly weak X-ray/UV anti-correlation also appear to be present at in XMM13.
In order to provide explicit support to the DCF analysis for the lack of correlation, we quantified the significance of any lag detection. For doing this, we simulated 10,000 pairs of lightcurves employing the widely used technique of bootstrap (Peterson et al. 1998). From the discrete correlation functions of these bootstrap samples, the 95% and the 99% confidence intervals were estimated by taking the and the percentiles respectively. The resulting plots are shown in Figure 2, where the dashed blue and red lines represent confidence intervals at the 95% and 99%, respectively. Figure 2 clearly demonstrates that the DCF values against each time lag do not explicitly fall on the confidence intervals.
Further, we used another cross-correlation technique; the z - transformed discrete correlation function (ZDCF) (Alexander 1997; Alexander 2013) to check for any UV/X-ray correlations and any associated time delays. ZDCF uses equal population binning and Fisher’s z-transform. It is widely used to estimate the cross-correlation function of sparse, unevenly sampled lightcurves. In applying the ZDCF technique, we took the default minimum 11 data points per bin, and performed 1000 Markov Chain Monte Carlo (MCMC) simulations. As shown in Fig. 3, the overall pattern of the zdcf curves are generally similar to those from dcf, also showing multiple DCF peaks.
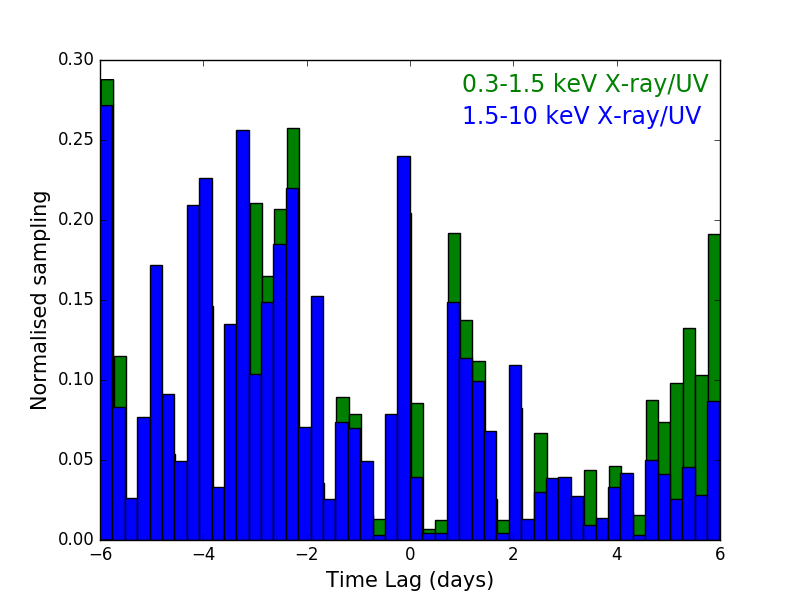
Lastly, we used the JAVELIN code (Zu et al. 2011) to also check for correlated variability in the X-ray/UV lightcurves of XMM13, XMM18 and XMM19. The code uses a damped random walk process to model AGN continuum emission. It compares model lightcurves with observed ones to estimate the best-fitting lag. JAVELIN has been used to study correlated variability with various covariance functions (Zu et al. 2013). JAVELIN employs interpolation method and runs MCMC for large number of times, which derives posterior distribution of lags with shape in the form of Gaussian, where the peak indicates lag. This requires a simultaneous coverage of the lightcurves. We allowed 5000 MCMC runs and found that the Gaussian behaviour is totally absent in Mrk 1044. Instead, multiple peaks appears as obtained from the lightcurves at different time intervals (see Figure 6), which can not account for any significant correlation between X-ray and UV.
III.2 Long time scale correlation
We use simultaneous Swift XRT and UVOT observations of Mrk 1044 to search for any long-term correlations between the disc optical/UV and the coronal X-ray emissions. We used the techniques described above to search for any correlated variability between the lightcurves from the UVW1 filter against the three X-ray bands. For the DCF analysis, we considered the lag range of -7 to 7 days with a time bin-size of 1 day. The result obtained from the implementation of the DCF are shown in Fig 5. The DCF plot again shows multiple peaks with no significant lag between the UV and any of the X-ray bands. Also, as shown in Fig. 5 (right plot), the ZDCF plot does not show any strong correlation between the UV and the X-ray bands. Application of the JAVELIN code (Fig. 7) also shows multiple peaks and no reliable correlations can be claimed for UV/X-ray variability. We went a step further to also check for any correlations between the other UVOT filters (UVM2, UVW2) against the combined X-ray band but no significant correlations were detected.


IV X-ray Spectral analysis
We used the latest XMM-Newton observation obtained in 2019 to probe whether the spectra, in particular the soft X-ray excess, is consistent with being reflection-dominated or an alternative explanation like thermal Comptonisation from a warm corona could equally be proffered.
The spectral analysis was carried out simultaneously for both the EPIC-pn spectra from XMM19 and FPMA/FPMB spectra from NuSTAR in the energy range of 0.3–50 keV. For the analysis we performed statistics using XSPEC version 12.11.1 (Arnaud 1996) and estimated parameter errors at 90% confidence interval. Neutral absorption along the line of sight was modelled with tbabs using abundances from Wilms et al. 2000 and cross-sections from Verner et al. 1996.
IV.1 Phenomenological model
We started by fitting a simple absorbed powerlaw model to the spectra in the and the ranges. This gives an acceptable fit with . When extrapolated over the complete energy range, however, prominent features, including the soft X-ray below , an absorption trough between and the broad component of the iron K line, are evident (shown in Fig. 8). The soft excess was modelled by using a bbody component which shows significant improvement in the fit. We then included the XSTAR-based model zxipcf, a model for partial absorption from partially ionised material, to fit for the absorption trough. Finally, a gauss model was required to fit for the residual between . This provided a reasonable fit to the complete 0.3–50 keV spectra with . The fitted spectra is produced in Fig. 9 which shows large residuals in the soft band, suggesting that the used model is not well favoured.
| Model | Parameter | XMM-Newton | NuSTAR | NuSTAR | |
|---|---|---|---|---|---|
| EPIC-pn | FPMA | FPMB | |||
| Galactic absorption (tbabs) | |||||
| Partial covering (zxipcf) | |||||
| log | |||||
| Relativistic reflection (relxillCp) | |||||
| – | – |
Here, unit of the ionisation parameter is . represents the covering fraction.
IV.2 Physically motivated model
We applied physically-motivated models to the spectra to better understand the nature of the spectral features – with particular focus on the soft X-ray excess exhibited by the source. The relativistically blurred reflection model was applied to understand the origin of this feature and to describe the entire X-ray band.
The widely used reflection model relxill (Dauser et al. 2014; García et al. 2014) posits that features seen in the spectra of AGN, including the soft excess and the broad iron K line arise from the relativistic blurring of ionised disc reflection due to the strong general relativistic effects close to the black hole. The model combines the capacity of the reflection code xillver and the relativistic ray-tracing code relline. For the disc material, the model assumes a powerlaw emissivity of the form , where and are the disc radius and the emissivity index respectively.
Here, we used the relxillCp flavour of the model to fit for the soft excess and the broad iron K line and zxipcf to model for the absorption feature between . relxillCp uses the primary continuum from the Comptonisation model nthcomp (Zdziarski et al. 1996; Życki et al. 1999) as opposed to the phenomenological powerlaw. The complete model combination is tbabs*zxipcf*(relxillCp). During the fit, the inner and the outer radii were left frozen at their default values, while the break radius, inner emissivity index and the spin parameter a* were left free to vary. The spin takes the maximum value of 0.998 and a very steep emissivity is observed up-to break radius of . The fit parameters are quoted in Table 2 and the spectra in Fig. 10. The modeled reflection fraction for XMM-Newton spectra high at compared to that from the NuSTAR spectra which is . This may not be unconnected to the fact that most of the reflection is contributed by photons at energies below , making up the soft excess. The reflection modelling provided a better fit to the data with /dof = 1260/1104 and improved residuals than the phenomenological one, implying that reflection is more acceptable than the Comptonisation. Contemporaneous fit by the warm Comptonisation and reflection models is also reported in the recent work of Yu et al. 2023, where six NLS1 AGNs are analysed. As the authors suggest, spectrum of a single source can be better described by the relativistic reflection, although the models give very similar fit-statistic, making difficult to determine which scenario should be more favourable for the origin of the soft excess.
V Discussion
To investigate X-ray/UV correlated variability in Mrk 1044, we carried out cross-correlation analysis using three long XMM-Newton and numerous Swift monitoring observations with simultaneous UV and X-ray data. Our analysis revealed that there is no significant correlation between emission in the UV and the X-ray energy bands on short as well as long time scales. Although there appears to be anti-correlation features in the CCFs, they are considered insignificant. Plots from the JAVELIN code (Fig. 6) show multiple correlation peaks which are also insignificant. In order to cross-check the results produced by each correlation technique and thereby to further validate that X-ray/UV correlation is nonexistent, we constructed plots for the X-ray count rates against the UV from the XMM-Newton lightcurves (see Fig. 11). Clearly, no trend appears between X-ray flux and UV flux.
Besides timing analysis, we conducted a broadband spectral analysis to search for X-ray reflection dependency of the source. Report appeared in Mallick et al. 2018 revealed the presence of strong soft excess based on reflection spectroscopy of the 0.3–50 keV spectra given by the 2013 XMM-Newton and 2016 NuSTAR observations. Further, our detailed analysis for the XMM-Newton along with one of the longest NuSTAR observation shows that including the soft excess the broadband spectra can be described by the relativistic reflections
Sources with evidence of strong reflection in their X-ray spectra should normally be expected to exhibit X-ray/UV CCF delay consistent with reprocessing – where emission in the UV lag behind those in the X-rays. This is because the same X-ray powerlaw emission illuminating the disc is not only responsible for the observed reflection features, but should also be responsible for the reprocessed lower energy UV photons in the accretion disc (Edelson et al. 2015a; Pal et al. 2017; Buisson et al. 2017; Lobban et al. 2018; Kammoun et al. 2019). Most AGNs are expected to have a standard accretion disc (Czerny & Naddaf 2018) and we assume that this is also true for Mrk 1044 which has an Eddington ratio of . Thus, following Adegoke et al. 2019, we can estimate the radius at which the UV radiation is emitted using the relation . In the reprocessing scenario, the light travel time – corresponding to the expected time delay – between the central illuminating X-rays and the disc UVW1 photons observed at should follow the relation (McHardy et al. 2016) and can be expressed as
| (1) |
We analysed the set of all three XMM-Newton observations to measure the accretion rate. The accretion rate () was calculated from the ratio of bolometric luminosity () to the Eddington luminosity (), where we obtained the by applying bolometric correction to the 2–10 keV luminosity following the prescription outlined in Duras et al. 2020. XMM13 yields the accretion rate at whereas erg/s and 2-10 keV luminosity erg/s. This becomes in XMM18, where erg/s and erg/s. Further, accretion rate of is obtained from XMM19, with erg/s and erg/s. Inserting these accretion rate values (= 0.25, 0.31 and 0.43) in equation 1, can be obtained to be at ks, ks and ks, respectively.
Further, we derived the soft X-ray strengths from the ratios of 0.3–1 keV luminosity of black body component to the Eddington luminosity () and 0.5–2 keV black body flux to the continuum flux (). While the strength takes the values at , , and , at , and against the accretion rates of , and corresponding to the 2–10 keV luminosity of erg/s, erg/s and erg/s, respectively. This, however, indicates that the soft X-ray strength does not vary significantly, and we do not see any strong correlation or anti-correlation with and . It may be pointed up that more number of observations spanning a wide range of luminosity would be required if one performs a robust analysis to search for any correlation and/or anti-correlation.
If the observed UV emission is due to reprocessing of X-rays in the disc, then the UV lightcurves should show variability associated with the X-ray lightcurves. In the case where reprocessing of X-rays in the disc is significant, such a disc will be hotter than when heated solely by accretion. Supposing that Mrk 1044 was illuminated by a compact X-ray source located above the disc at a height of , then additional UVW1 flux () will be generated (Robertson et al. 2015, e.g.,). The observed UVW1 variability measured for Mrk 1044 is 2% from the XMM-Newton and % from the Swift which are much less than the variability in X-rays, implying that the disc in this source may be illuminated anisotropically by the X-ray source consequently giving rise to the lack of correlation in the variability seen in both bands. Variability in the geometry and structure of the corona may also introduce additional complexity to the X-ray/UV lightcurve variability (Wilkins & Gallo 2015b, e.g.,)


Depending on how high the compact X-ray source is above the disc, gravitational light-bending would make the amount of radiation from the isotropic emitting source as seen by the disc to look different than that seen by a distant observer (Miniutti & Fabian 2004, e.g.,). Alternatively, if the X-ray source were the base of a jet moving at a significant fraction of the speed of light, then beaming effects would make emission from the isotropic X-ray source as seen by the disc appear to be anisotropic (Reynolds & Fabian 1997, e.g.,)
Timing analysis of a number of other Seyfert 1 AGN have showed no X-ray/UV correlations on a similar timescale as considered for Mrk 1044. A few of them exhibit similar spectral properties to Mrk 1044. One such source is 1H 0707-495 having a mass of , also known to possess a reflection-dominated X-ray spectra. For this AGN, 54 argued that strong GR effects and significant light-bending in the innermost regions of the accretion disc could prevent substantial X-ray photons from reaching far out into the disc leading to the non-detection of X-ray/UV correlation. Another X-ray bright NLS1 AGN IRAS 13224-3809 has similar spectral properties to Mrk 1044, showing that X-ray is highly variable than UV (13). As the authors suggest, any possible X-ray/UV correlation may be blocked from detection due to higher X-ray variability.
It is possible that scattering and/or absorption between the corona and the disc or changes in the coronal geometry brings about a difference between the X-ray variability viewed by the disc and that along our line of sight. The underlined change in the coronal geometry is typical when it moves closer to the black hole as seen in the reflection dominated NLS1 galaxy Mkn 478 (Barua et al. 2022), or due to the corona collapsing down onto the black hole. This is akin to the coronal emissions in a larger fraction to focus on the innermost disc, while only a small fraction is to be received by the outer disc, probably causing the enhanced complexity in the X-ray variability and thereby leading to the non-detection of the correlation. Future X-ray instruments with larger collecting area may help to map the corona and would allow a better measurement of the X-ray irradiation of the disc in addition to the X-ray flux along our line of sight.
VI conclusion
Our analysis for NLS1 AGN Mrk 1044 based on three long XMM-Newton observations does not reveal any significant correlation on short timescales between the X-ray and UV variability in their lightcurves. Similarly, the Swift monitoring observations reveal that correlation lacks on longer timescale. This non-detection is not usual, but not even unpredictable as consistent findings have been reported for NLS1 AGNs 1H 0707-495 and IRAS 13224-3809 which show similar spectral properties to Mrk 1044. One plausible cause for this lack of correlation is attributed to the light bending effect – mostly seen in reflection dominated sources. Else, expected to be due to higher X-ray variability over UV, blocking the detection of the correlation.
References
- Adegoke et al. (2019) Adegoke, O., Dewangan, G. C., Pawar, P., & Pal, M. 2019, ApJ, 870, L13, doi: 10.3847/2041-8213/aaf8ab
- Adegoke et al. (2017) Adegoke, O., Rakshit, S., & Mukhopadhyay, B. 2017, MNRAS, 466, 3951, doi: 10.1093/mnras/stw3320
- Alexander (1997) Alexander, T. 1997, in Astronomical Time Series, ed. D. Maoz, A. Sternberg, & E. M. Leibowitz (Dordrecht: Springer Netherlands), 163–166
- Alexander (2013) Alexander, T. 2013, arXiv e-prints, arXiv:1302.1508. https://arxiv.org/abs/1302.1508
- Arévalo et al. (2005) Arévalo, P., Papadakis, I., Kuhlbrodt, B., & Brinkmann, W. 2005, A&A, 430, 435, doi: 10.1051/0004-6361:20041801
- Arévalo et al. (2009) Arévalo, P., Uttley, P., Lira, P., et al. 2009, MNRAS, 397, 2004, doi: 10.1111/j.1365-2966.2009.15110.x
- Arnaud (1996) Arnaud, K. A. 1996, in Astronomical Society of the Pacific Conference Series, Vol. 101, Astronomical Data Analysis Software and Systems V, ed. G. H. Jacoby & J. Barnes, 17
- Barua et al. (2020) Barua, S., Jithesh, V., Misra, R., et al. 2020, MNRAS, 492, 3041, doi: 10.1093/mnras/staa067
- Barua et al. (2022) Barua, S., Jithesh, V., Misra, R., Medhi, B. J., & Adegoke, O. 2022, arXiv e-prints, arXiv:2209.08969. https://arxiv.org/abs/2209.08969
- Breedt et al. (2009) Breedt, E., Arévalo, P., McHardy, I. M., et al. 2009, MNRAS, 394, 427, doi: 10.1111/j.1365-2966.2008.14302.x
- Breedt et al. (2010) Breedt, E., McHardy, I. M., Arévalo, P., et al. 2010, MNRAS, 403, 605, doi: 10.1111/j.1365-2966.2009.16146.x
- Buisson et al. (2017) Buisson, D. J. K., Lohfink, A. M., Alston, W. N., & Fabian, A. C. 2017, MNRAS, 464, 3194, doi: 10.1093/mnras/stw2486
- Buisson et al. (2018) Buisson, D. J. K., Lohfink, A. M., Alston, W. N., et al. 2018, MNRAS, 475, 2306, doi: 10.1093/mnras/sty008
- Burrows et al. (2005) Burrows, D. N., Hill, J. E., Nousek, J. A., et al. 2005, Space Sci. Rev., 120, 165, doi: 10.1007/s11214-005-5097-2
- Cameron et al. (2012) Cameron, D. T., McHardy, I., Dwelly, T., et al. 2012, MNRAS, 422, 902, doi: 10.1111/j.1365-2966.2012.20677.x
- Czerny & Naddaf (2018) Czerny, B., & Naddaf, M. H. 2018, in Accretion Processes in Cosmic Sources - II, 6, doi: 10.22323/1.342.0006
- Dauser et al. (2014) Dauser, T., Garcia, J., Parker, M. L., Fabian, A. C., & Wilms, J. 2014, MNRAS, 444, L100, doi: 10.1093/mnrasl/slu125
- Dewangan et al. (2007) Dewangan, G. C., Griffiths, R. E., Dasgupta, S., & Rao, A. R. 2007, ApJ, 671, 1284, doi: 10.1086/523683
- Du et al. (2015) Du, P., Hu, C., Lu, K.-X., et al. 2015, ApJ, 806, 22, doi: 10.1088/0004-637X/806/1/22
- Duras et al. (2020) Duras, F., Bongiorno, A., Ricci, F., et al. 2020, A&A, 636, A73, doi: 10.1051/0004-6361/201936817
- Edelson et al. (2015a) Edelson, R., Gelbord, J. M., Horne, K., et al. 2015a, ApJ, 806, 129, doi: 10.1088/0004-637X/806/1/129
- Edelson et al. (2015b) —. 2015b, ApJ, 806, 129, doi: 10.1088/0004-637X/806/1/129
- Edelson & Krolik (1988) Edelson, R. A., & Krolik, J. H. 1988, ApJ, 333, 646, doi: 10.1086/166773
- Evans et al. (2007) Evans, P. A., Beardmore, A. P., Page, K. L., et al. 2007, A&A, 469, 379, doi: 10.1051/0004-6361:20077530
- Evans et al. (2009) —. 2009, MNRAS, 397, 1177, doi: 10.1111/j.1365-2966.2009.14913.x
- Fabian et al. (2015) Fabian, A. C., Lohfink, A., Kara, E., et al. 2015, MNRAS, 451, 4375, doi: 10.1093/mnras/stv1218
- Fabian et al. (2004) Fabian, A. C., Miniutti, G., Gallo, L., et al. 2004, MNRAS, 353, 1071, doi: 10.1111/j.1365-2966.2004.08036.x
- García et al. (2014) García, J., Dauser, T., Lohfink, A., et al. 2014, ApJ, 782, 76, doi: 10.1088/0004-637X/782/2/76
- Gehrels et al. (2004) Gehrels, N., Chincarini, G., Giommi, P., et al. 2004, ApJ, 611, 1005, doi: 10.1086/422091
- Gliozzi et al. (2013) Gliozzi, M., Papadakis, I. E., Grupe, D., Brinkmann, W. P., & Räth, C. 2013, MNRAS, 433, 1709, doi: 10.1093/mnras/stt848
- Gliozzi & Williams (2020) Gliozzi, M., & Williams, J. K. 2020, MNRAS, 491, 532, doi: 10.1093/mnras/stz3005
- Haardt & Maraschi (1993) Haardt, F., & Maraschi, L. 1993, ApJ, 413, 507, doi: 10.1086/173020
- Husemann et al. (2022) Husemann, B., Singha, M., Scharwächter, J., et al. 2022, A&A, 659, A124, doi: 10.1051/0004-6361/202141312
- Jansen et al. (2001) Jansen, F., Lumb, D., Altieri, B., et al. 2001, A&A, 365, L1, doi: 10.1051/0004-6361:20000036
- Kammoun et al. (2019) Kammoun, E. S., Papadakis, I. E., & Dovčiak, M. 2019, ApJ, 879, L24, doi: 10.3847/2041-8213/ab2a72
- Koratkar & Blaes (1999) Koratkar, A., & Blaes, O. 1999, PASP, 111, 1, doi: 10.1086/316294
- Kumari et al. (2021) Kumari, N., Pal, M., Naik, S., et al. 2021, PASA, 38, e042, doi: 10.1017/pasa.2021.41
- Laha et al. (2018) Laha, S., Ghosh, R., Guainazzi, M., & Markowitz, A. G. 2018, MNRAS, 480, 1522, doi: 10.1093/mnras/sty1919
- Lobban et al. (2018) Lobban, A. P., Porquet, D., Reeves, J. N., et al. 2018, MNRAS, 474, 3237, doi: 10.1093/mnras/stx2889
- Mallick et al. (2018) Mallick, L., Alston, W. N., Parker, M. L., et al. 2018, MNRAS, 479, 615, doi: 10.1093/mnras/sty1487
- Marshall et al. (2008) Marshall, K., Ryle, W. T., & Miller, H. R. 2008, ApJ, 677, 880, doi: 10.1086/525845
- Mason et al. (2001) Mason, K. O., Breeveld, A., Much, R., et al. 2001, A&A, 365, L36, doi: 10.1051/0004-6361:20000044
- McHardy et al. (1999) McHardy, I., Lawson, A., Newsam, A., et al. 1999, MNRAS, 310, 571, doi: 10.1046/j.1365-8711.1999.02959.x
- McHardy et al. (2014) McHardy, I. M., Cameron, D. T., Dwelly, T., et al. 2014, MNRAS, 444, 1469, doi: 10.1093/mnras/stu1636
- McHardy et al. (2016) McHardy, I. M., Connolly, S. D., Peterson, B. M., et al. 2016, Astronomische Nachrichten, 337, 500, doi: 10.1002/asna.201612337
- Merloni & Fabian (2003) Merloni, A., & Fabian, A. C. 2003, MNRAS, 342, 951, doi: 10.1046/j.1365-8711.2003.06600.x
- Miniutti & Fabian (2004) Miniutti, G., & Fabian, A. C. 2004, MNRAS, 349, 1435, doi: 10.1111/j.1365-2966.2004.07611.x
- Novikov & Thorne (1973) Novikov, I. D., & Thorne, K. S. 1973, in Black Holes (Les Astres Occlus), 343–450
- Pal et al. (2017) Pal, M., Dewangan, G. C., Connolly, S. D., & Misra, R. 2017, MNRAS, 466, 1777, doi: 10.1093/mnras/stw3173
- Pal et al. (2018) Pal, M., Dewangan, G. C., Kembhavi, A. K., Misra, R., & Naik, S. 2018, MNRAS, 473, 3584, doi: 10.1093/mnras/stx2608
- Pawar et al. (2017) Pawar, P. K., Dewangan, G. C., Papadakis, I. E., et al. 2017, MNRAS, 472, 2823, doi: 10.1093/mnras/stx2163
- Peterson et al. (1998) Peterson, B. M., Wanders, I., Horne, K., et al. 1998, PASP, 110, 660, doi: 10.1086/316177
- Reynolds & Fabian (1997) Reynolds, C. S., & Fabian, A. C. 1997, MNRAS, 290, L1, doi: 10.1093/mnras/290.1.L1
- Robertson et al. (2015) Robertson, D. R. S., Gallo, L. C., Zoghbi, A., & Fabian, A. C. 2015, MNRAS, 453, 3455, doi: 10.1093/mnras/stv1575
- Roming et al. (2005) Roming, P. W. A., Kennedy, T. E., Mason, K. O., et al. 2005, Space Sci. Rev., 120, 95, doi: 10.1007/s11214-005-5095-4
- Shakura & Sunyaev (1973) Shakura, N. I., & Sunyaev, R. A. 1973, A&A, 500, 33
- Strüder et al. (2001) Strüder, L., Briel, U., Dennerl, K., et al. 2001, A&A, 365, L18, doi: 10.1051/0004-6361:20000066
- Uttley et al. (2003) Uttley, P., Edelson, R., McHardy, I. M., Peterson, B. M., & Markowitz, A. 2003, ApJ, 584, L53, doi: 10.1086/373887
- Uttley & Mchardy (2004) Uttley, P., & Mchardy, I. M. 2004, Progress of Theoretical Physics Supplement, 155, 170, doi: 10.1143/PTPS.155.170
- Vaughan et al. (2003) Vaughan, S., Edelson, R., Warwick, R. S., & Uttley, P. 2003, MNRAS, 345, 1271, doi: 10.1046/j.1365-2966.2003.07042.x
- Verner et al. (1996) Verner, D. A., Ferland, G. J., Korista, K. T., & Yakovlev, D. G. 1996, ApJ, 465, 487, doi: 10.1086/177435
- Wang & Lu (2001) Wang, T., & Lu, Y. 2001, A&A, 377, 52, doi: 10.1051/0004-6361:20011071
- Wilkins & Gallo (2015a) Wilkins, D. R., & Gallo, L. C. 2015a, MNRAS, 448, 703, doi: 10.1093/mnras/stu2524
- Wilkins & Gallo (2015b) —. 2015b, MNRAS, 449, 129, doi: 10.1093/mnras/stv162
- Wilms et al. (2000) Wilms, J., Allen, A., & McCray, R. 2000, ApJ, 542, 914, doi: 10.1086/317016
- Yu et al. (2023) Yu, Z., Jiang, J., Bambi, C., et al. 2023, MNRAS, 522, 5456, doi: 10.1093/mnras/stad1327
- Zdziarski et al. (1996) Zdziarski, A. A., Johnson, W. N., & Magdziarz, P. 1996, MNRAS, 283, 193, doi: 10.1093/mnras/283.1.193
- Zu et al. (2013) Zu, Y., Kochanek, C. S., Kozłowski, S., & Udalski, A. 2013, ApJ, 765, 106, doi: 10.1088/0004-637X/765/2/106
- Zu et al. (2011) Zu, Y., Kochanek, C. S., & Peterson, B. M. 2011, ApJ, 735, 80, doi: 10.1088/0004-637X/735/2/80
- Życki et al. (1999) Życki, P. T., Done, C., & Smith, D. A. 1999, MNRAS, 309, 561, doi: 10.1046/j.1365-8711.1999.02885.x