Magnetic Reconnection as the Key Mechanism in Sunspot Rotation Leading to Solar Eruption
Abstract
The rotation of sunspots around their umbral center has long been considered as an important process in leading to solar eruptions, but the underlying mechanism remains unclear. A prevailing physical picture on how sunspot rotation leads to eruption is that, by twisting the coronal magnetic field lines from their footpoints, the rotation can build up a magnetic flux rope and drive it into some kinds of ideal magnetohydrodynamics (MHD) instabilities which initiate eruptions. Here with a data-inspired MHD simulation we studied the rotation of a large sunspot in solar active region NOAA 12158 leading to a major eruption, and found that it is distinct from prevailing theories based on ideal instabilities of twisted flux rope. The simulation suggests that, through successive rotation of the sunspot, the coronal magnetic field is sheared with a central current sheet created progressively within the sheared arcade before the eruption, but without forming a flux rope. Then the eruption is instantly triggered once fast reconnection sets in at the current sheet, while a highly twisted flux rope is created during the eruption. Furthermore, the simulation reveals an intermediate evolution stage between the quasi-static energy-storage phase and the impulsive eruption-acceleration phase. This stage may correspond to the slow-rise phase in observation and it enhances building up of the current sheet.
Keywords:
Sun: Magnetic fields; Sun: Flares; Sun: corona; Sun: Coronal mass ejectionsI Introduction
Magnetic fields play a defining role for solar activities, especially, solar eruptions such as solar flares and coronal mass ejections (CMEs). The most visible manifestation of solar magnetic field are sunspots as seen on the solar surface (namely, the photosphere), which represent regions where the strongest magnetic field protrudes from the solar interior into the atmosphere. When rotating along with the solar surface, sunspots are also commonly observed to be rotating around their umbral center (Brown et al. 2003; Zhang et al. 2007; Yan et al. 2008; Min & Chae 2009; James et al. 2020), which has been discovered a century ago (Evershed. 1910; St. John 1913). Such rotational motion of sunspots has long been considered as an important process in association with generation of solar eruptions, because it is an efficient mechanism for transporting free magnetic energy and helicity from below the photosphere into the corona (Stenflo 1969; Barnes & Sturrock 1972). Indeed, almost all the flare-productive solar active regions (ARs) have been reported with significant sunspot rotations (Yan et al. 2008), for example, in the extensively studied ARs including NOAA 10930 (Min & Chae 2009; Zhang et al. 2007), 11158 (Jiang et al. 2012; Vemareddy et al. 2012), 11429 (Zheng et al. 2017), 12158 (Bi et al. 2016; Vemareddy et al. 2016), and 12673 (Yan et al. 2018b; Yan et al. 2018a), etc.
A widely-believed physical picture on how sunspot rotation leads to eruption is that, by twisting the coronal magnetic field lines at their footpoints, the rotation can build up a magnetic flux rope (MFR, which is a bundle of magnetic flux possessing a significant amount of twist, typically characterized by a field-line twist number above unity (Chen 2017; Cheng et al. 2017; Liu 2020)), and drive it into some kinds of ideal magnetohydrodynamics (MHD) instabilities (Kliem & Török 2006; Török & Kliem 2005; Fan & Gibson 2007; Aulanier et al. 2010, for example, the kink instability and torus instability,) or catastrophic loss of equilibrium (Forbes & Isenberg 1991; Lin & Forbes 2000; Kliem et al. 2014). For example, in the comprehensive review book “New Millennium Solar Physics” (Aschwanden 2019), a section is devoted to the studies of rotating sunspots and it is written that “The relationship between rotating sunspots and the triggering of a flare accompanied by a sigmoid eruption, most likely driven by a kink instability, is overwhelming.”
It seems evident that the rotational motion of magnetic field line footpoints (around the rotating center) can increase magnetic twist degree of the flux rope (around the rope axis that roots at the rotating center), until it reaches a critical value for kink instability (Hood & Priest 1979; Mikic et al. 1990; Galsgaard & Nordlund 1997). Or, the flux rope will expand upward owing to the increase of magnetic pressure as driven by the rotation (Aulanier et al. 2005), and reaches a critical height at which the torus instability (Kliem & Török 2006) (or equivalently, the catastrophic loss of equilibrium (Kliem et al. 2014)) sets in. However, none of these scenarios has been proven in MHD simulations that start from a magnetic arcade and are driven by solely line-tied surface rotation motion without other requirements (for example, flux cancellation (Amari et al. 2003; Aulanier et al. 2010)). For example, all previous attempts of such type of simulations (Amari et al. 1996; Török & Kliem 2003; Aulanier et al. 2005) show that the continuous twisting of the core field in a bipolar potential field can lead to a strong expansion (or “fast opening”) of the field, but such expansion cannot be taken as solar eruption since there is no impulsive release (increase) of magnetic (kinetic) energy, and the expansion process can always relax smoothly to an equilibrium if the driving velocities are suppressed, therefore not associated with an instability or a loss of equilibrium (Aulanier et al. 2005). There is only one simulation (Török et al. 2013) designed to show that sunspot rotation can cause the arcade overlying a pre-existing flux rope to inflate, thus weakening the confining effect on the flux rope and letting it to ascend slowly until reaching the torus instability. But such a simulation does not show how the flux rope forms, and moreover the rotating sunspot does not energize the key structure of eruption (i.e., the flux rope, which is not rooted in the rotating sunspot in their simulation), therefore not playing a direct role in triggering the eruption.
In a previous work (Jiang et al. 2023, hereafter referred to as Paper I), with a data-driven MHD simulation, we have modelled the generation of a major eruption (an X-class eruptive flare) in solar AR NOAA 12158, which contains a continuously rotating sunspot. In that simulation, the photospheric velocity as recovered from the time sequence of vector magnetograms are input directly as the driving flow at the bottom boundary of the model. The simulation successfully reproduced a transition from the quasi-static state to an eruptive phase with onset time matching rather well with observation. It further showed that the mechanism leading to eruption is different from the aforementioned ones, but follows the one as recently established for an idealized bipolar magnetic configuration (Jiang et al. 2021b; Bian et al. 2022a; Bian et al. 2022b), in which a current sheet is formed by quasi-statically shearing the bipolar arcade until fast reconnection at the current sheet triggers an eruption.
Although the data-driven simulation is more realistic than other types of simulation, it cannot clearly pin down which photospheric motion plays the key role in driving the field to its eruption. That is, it remains unclear what is the role played by the rotation of sunspot in the process of leading to the eruption. To this end, in this paper we performed a data-inspired simulation for which the driving flow at the photosphere is specified as a rigid rotation profile of the sunspot. Such conceptual simulation is not aimed to realistically reproduce the observation but can provide important clues on which effect (here, the sunspot rotation) is important in leading to eruption. We have also proposed a new way to estimate the degree of sunspot rotation from observations, which is used for guiding the data-inspired simulation. Essentially the data-inspired simulation confirms the same initiation mechanism as revealed in Paper I. Moreover, attention is also paid to an intermediate evolution stage that transforms the quasi-static phase to the impulsive eruption-acceleration phase. This stage may correspond to the slow-rise phase in observation and it enhances building up of the current sheet. In the following, we first give an observational analysis of the studied event in Section II, then briefly describe the numerical modeling in Section III and show the simulation results in Section IV. Finally we conclude and give discussions in Section V.
II Observations
When first appearing on the solar disk on 5 September 2014, AR NOAA 12158 was already in its decaying phase, while its leading sunspot witnessed with continuous counter-clockwise rotation from 6–11 September 2014 during its passage on the solar disk. As a result, the core field of the AR forms a prominent sigmoid in the corona (Figure 1). The AR produced a major flare of Geostationary-Operational-Environmental-Satellite (GOES) X1.6 at around 17:00 UT on 10 September. It is a global eruption of the AR resulting in a halo CME (Vemareddy et al. 2016).

II.1 Observation of the eruption
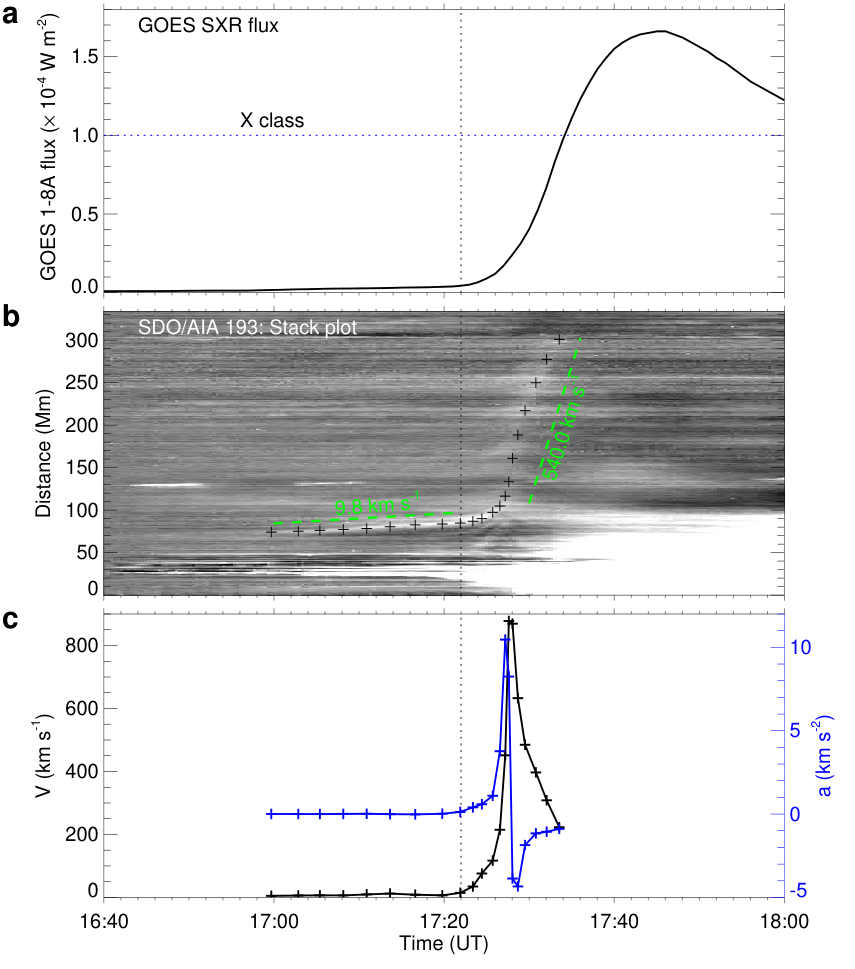
Figure 1 (and its animation) shows the eruption process imaged in three AIA channels. With about 20 min before the flare onset, a precursor is observed; in the hot channel of AIA 131 Å, a few loops in the core of the sigmoid became more and more prominent, while the transverse width of this brightening structure became progressively thinner, which possibly hints that a pre-flare current sheet was forming gradually there. Meanwhile, a set of coronal loops, likely overlying the middle part of the sigmoid, expanded outward slowly, which looks rather faint but still detectable in different AIA channels and can be clearly seen in the base difference images of AIA 193 Å (Figure 1c). The speed in the direction from the flare core to the southwest is estimated to be around 10 km s-1 (Figure 2), which is at least an order of magnitude larger than a quasi-static evolutionary speed that is driven by the photospheric motions (note that the actual expansion speed of these loops is underestimated due to the projection effect). At 17:21 UT, the soft X-ray flux increased impulsively (Figure 2a), which indicates the onset of fast reconnection. Instantly, the slow-expanding loops were accelerated impulsively within about 3 min, reaching a speed of km s-1 at 17:26 UT (Figure 2b and c). The peak value of acceleration reaches above km s-2, which is on the same order of magnitude of acceleration as observed in the most impulsive eruption events. Such strong acceleration is not likely driven by an ideal MHD instability of MFR, according to a study by Vršnak 2008, who used a analytic model of flux rope to study the acceleration of eruption as driven by ideal evolution and resistive evolution. They concluded that “The purely ideal MHD process cannot account for highest observed accelerations which can attain values up to km s-2. Such accelerations can be achieved if the process of reconnection beneath the erupting flux-rope is included into the model.” (Green et al. 2018, see also).
With start of the impulsive phase of the flare, the flare ribbons and post-flare loops were seen with slipping-like motions, which are interpreted to be a manifestation of 3D slipping reconnection that forms an MFR during flare (Li & Zhang 2015; Dudík et al. 2016; Gou et al. 2023), and a twin set of coronal dimmings were observed in both AIA 171 and 193 Å channels along with the eruption, which should map the feet of the erupting MFR. Although some lowing-lying filaments were observed at the flare site (Dudík et al. 2016), they did not erupt with the flare. Previous studies of the same event using coronal nonlinear force-free field extrapolation also suggest that only a sheared arcade rather than a well-defined MFR existed prior to this eruption (Duan et al. 2017; Shen et al. 2022).

II.2 Estimation of sunspot rotation
To guide the simulation, we first estimate the degree of the sunspot rotation in the three days of 8–10 September 2014, as our simulation will be started with initial conditions representing the MHD equilibrium at the time of 00:00 UT on 8 September 2014. To estimate the degree of its rotation with respect to the sunspot center, we calculate the surface velocity at the photosphere based on a time sequence of vector magnetograms, and further extract the velocity components that are directly associated with the rotational motion from the surface flow. Then, by integration of the rotational speed with time, it provides an alternative way of estimating the rotational degree to the traditional method based on direct inspection of the white-light continuum images (Brown & Walker 2021; Vemareddy et al. 2016).
The surface velocity at the photosphere is derived using the DAVE4VM code (Schuck 2008), which is also used in Paper I where more details can be found. Based on the photospheric surface velocity as derived, the rotational speed is estimated in the following way. We first extract the velocity components relevant only to the rotational motion from the surface horizontal velocity by decomposing it as
| (1) |
where is a arbitrary vector and a arbitrary scalar. The curl-free part is obtained by solving a Poisson equation , and then the divergence-free part is . The rotational flow of the sunspot is contained only in the divergence-free field . Then we estimated the time average of the rotational flow of three days by simply averaging the field in each pixel using the three-day data of 8–10 September 2014. Figure 3a gives the distribution of the averaged , and Figure 3b shows the averaged . As can be seen, the rotating center is close to the location with the maximum magnetic flux density in the sunspot (also on time average). The curl-free part shows clearly a diverging flow from approximately the center of the sunspot. With this averaged flow field, we further calculated the rotational rate, i.e., the angular speed of the sunspot with respect to the rotating center. As shown in Figure 3c, we sampled 10 radial lines with different azimuthal angle (evenly distributed from to ) from the center of rotation, and got the rotational velocity on these radial lines. The average angular speed is given by
| (2) |
The angular speed as averaged over three days of 8–10 September 2014 shows that the rotation is the fastest near the center of the sunspot umbra, reaching around h-1, and it decreases gradually to zero outside of the penumbra at a radial distance of Mm (Figure 3c). When averaged for the whole sunspot, the rotation speed is about h-1, and thus in the three days the sunspot has rotated with a total degree of . Our result of the total rotation degree for the three days from 8–10 September 2014 agrees well with the value obtained from other independent methods for the same sunspot (Brown & Walker 2021; Vemareddy et al. 2016).
III Numerical model
Since a detailed description of the numerical model has been provided in Paper I, including the controlling MHD equation, the grid setting, the initial and the boundary conditions, we will not repeat them here. Same as Paper I, our simulation is started from an MHD equilibrium constructed for 00:00 UT on 8 September 2014, a time over 65 hours before onset of the X1.6 flare. The simulation aims to follow a long-period of slow coronal magnetic evolution until the major eruption. The key difference in the current simulation with Paper I is that here the simulation is driven by surface motions specified at the bottom boundary by assuming that the major sunspot rotates like a rigid body (namely with a constant angular speed within the sunspot, which is the simplest case) while all other regions are fixed. Therefore, as compared with the data-driven simulation in Paper I, such a data-inspired simulation can emphasize the effect of sunspot rotation in leading to the eruption.
Specifically, the sunspot is rotated rigidly with respect to its surrounding field by applying a velocity profile at the bottom boundary defined as
| (3) |
where the rotating center is defined to be the point in the sunspot with the largest , and the angular speed is a constant (positive, thus rotating counter-clockwise) within a radius of arcsec from the rotating center, and then decreases linearly to zero at a radius of arcsec. The value of is chosen such that the maximum value of the surface speed is km s-1. On the bottom boundary, we solved the magnetic induction equation to update all the three components of magnetic field with the flow field prescribed by those defined in Equation (3), while the plasma density and temperature are simply fixed.


IV Simulation results
The simulation demonstrates an evolution from an initially quasi-static stage to finally a fast eruption. The evolutions of 3D structure of magnetic field and electric current before the eruption are shown in Figures 4 and 5, while their evolutions during eruption are given in Figure 6, and the time profiles of the magnetic and kinetic energies in the whole process, along with the kinematic behaviour of the erupting features, are plotted in Figure 7. Below we describe the different stages and the key processes in the simulated MHD evolution.
IV.1 The pre-eruption stage
The magnetic configuration at the initial time is a sheared arcade core enveloped by an overlying, nearly current-free field. As the main sunspot rotates counterclockwise, the coronal magnetic configuration expands slowly and the degree of magnetic shear increases, i.e., with the field lines in the core part becoming more and more aligned with the bottom PIL as viewed from above (Figure 4a and its animation). Progressively, these field lines, as a whole, form a prominent reverse S shape. As shown in Figure 4c, a sigmoid structure is also seen in the synthetic images of coronal emission from current density, which are obtained by vertical integration of the square of current density averaged along each field line (see also Paper I). It resembles the observed coronal sigmoid structure, for example, comparing the last image of Figure 4c with the EUV sigmoid as shown in Figure 1b. In the pre-flare phase from to (where s is the time unit used in the numerical model), the magnetic energy increases monotonically with a nearly constant rate (Figure 7a), because the sunspot rotates with a constant speed. While the magnetic energy rises significantly, the kinetic energy keeps a small value of around (where is the potential field energy at the initial time), and thus most of the injected energy from the bottom boundary through the surface driving motion (which is indicated by the red dashed line in Figure 7a) is stored as coronal magnetic energy. Moreover, since the rotation motion introduces very limited variation to the magnetic flux distribution at the bottom surface and thus the corresponding potential-field energy changes only slightly during the whole evolution process (the black dashed line in Figure 7a), most of the injected energy is stored as free magnetic energy in the corona. A total amount of free energy of has been stored until the eruption onset at , and thus the non-potentiality, as measured by the ratio of the total magnetic energy to the potential field energy, reaches . Meanwhile, the sunspot has rotated by about , which is almost identical to that derived from observations (), i.e., an average rotational rate of h-1 multiplied by a time of 65 h before the X1.6 flare. If not interrupted by the eruption, it seems that with another of rotation the non-potentiality can approach an upper limit of approximately as determined by the fully open field (Aly 1991; Sturrock 1991). But such ideal evolution is not possible because a central current sheet unavoidably forms and triggers reconnection, which results in the eruption.
IV.2 Formation of a current sheet
A clear signature of current sheet formation can be seen in the evolution of current density in cross sections of the volume (Figure 5 and the animation of Figure 4). Note that the current density is normalized by the magnetic field strength (i.e., ) to emphasize thin layers with strong current. Initially the current density is volumetric, and gradually a narrow layer with enhanced density emerges, becomes progressively thinner. To characterize this evolution of the current layer, we have measured its thickness, which is defined at the location where it is thinnest. As can be seen in the variation of the current layer thickness with time in Figure 7b, the thickness of the current layer decreases all the way until the onset of the eruption. At the time of , the thin current layer extends from the bottom to a height of Mm with a thickness of around (here Mm is the finest grid resolution). This is the critical time point when the current sheet reaches beyond the grid resolution and the numerical resistivity arises to trigger fast reconnection in the current sheet, which initiates the eruption. The current sheet formation is accompanied with the formation of a quasi-separatrix layer (QSL (Démoulin et al. 1996)) as seen in the distribution of the magnetic squashing degree (i.e., factor, see Figure 5b and d). The factor quantifies the gradient of magnetic field-line mapping with respect to their footpoints, and it is helpful for searching topological interface or QSLs of magnetic flux connections using extremely large values of factor () (Titov et al. 2002; Liu et al. 2016). Initially the factor distributes smoothly with mostly small values. Along with narrowing of the central current layer, there is an evident increase of in the central thin layer. Immediately prior to the eruption, it has reaching and an extremely small thickness, thus being identified as QSL, at the same location with the enhanced values of .

IV.3 The eruption and reconnection
With onset of the eruption, the kinetic energy increases impulsively and reaches finally about , while the total magnetic energy experiences a fast decrease, even though the boundary driving still injects magnetic energy into the volume. The total released magnetic energy amounts to or erg if scaled to the realistic value of the magnetic field, which is sufficient to power a typical X-class flare (Emslie et al. 2012). The eruption of the magnetic field creates a large-scale MFR through the continuous magnetic reconnection in the current sheet (Figure 6 and its animation). The existence of such an MFR in this event has been confirmed by in-situ observation in the interplanetary space of the CME from this AR (Kilpua et al. 2021). Ahead of the MFR, the eruption drives a fast magnetosonic shock, which is shown by the thin arc of the current density on the top of the MFR. During the eruption, the reconnecting current sheet extends in both transverse size and height, but is kept in the same thickness that is allowed by the given grid resolution (Figure 6b and Figure 7b). When using an sufficiently high resolution such that the Lundquist number of the current sheet can reach the order of , the reconnecting current sheet would run into plasmoid instability and could then trigger turbulence, which help to achieve a fast reconnection rate (Bhattacharjee et al. 2009; Daughton et al. 2011; Jiang et al. 2021b). For the current simulation, we have also carried out an experiment with much higher resolution of km, and indeed the plasmoid instability is triggered as shown in Figure 8. Since the high-resolution run requires an extremely long computational time, it is performed for only a short period during the eruption from to .
Connecting to the bottom of the current sheet is a cusp structure, below which is the post-flare arcade, i.e., the short field lines formed after the reconnection. The post-flare arcade and the MFR are separated, initially partially but later fully, by the QSL that originates from the current sheet and forms the topological surface of the MFR (Jiang et al. 2021a). The QSL exhibits two J-shaped footprints at the bottom surface (Figure 6c), and these footprints consists of the limits of the MFR (i.e., the hook parts of the QSL footprints) and the footpoints of the field lines that are undergoing reconnection in the current sheet (mainly the leg parts), and the latter are believed to correspond to the location of flare ribbons. Indeed, the shape and evolution of the QSL footprints are in reasonable consistence with that of the observed flare ribbons in SDO/AIA 1600 Å, by taking into consideration of the systematic difference of the photospheric magnetic field between the simulation and observation. By tracing the movement of the QSL footprints, one can compute the evolution of the reconnection flux, which is the magnetic flux as swept by the moving QSL footprints. Figure 9 shows that the results, in both the reconnection flux and the reconnection rate, are comparable to those derived from evolution of the observed flare ribbons (He et al. 2022). Note that there are also reconnection within the MFR (Jiang et al. 2021a), and this reconnection creates field lines with higher twist number than that created by the initial tether-cutting reconnection. As a result, these field lines are separated with others by the newly-formed embedded QSLs in each hook, which are similar to the ones described in an analytic study (Démoulin et al. 1996).
IV.4 The pre-eruption slow rise phase
Although Figure 7 shows a typical slow storage of magnetic free energy to its fast release in eruption, the evolution can actually be divided into three different stages, that is, a quasi-static phase, an impulsive rise phase, and a slow rise phase in between, which is likely to correspond to the observed short period of coronal loop slow expansion immediately before the eruption. The first phase from the beginning to around is truly quasi-static because, on the one hand, the core field expands with a speed close to that of the bottom driving speed (Figure 7c), and on the other hand, at any instant in this phase, if we stop the bottom driving (i.e., by turning off the rotation of the sunspot), the system can relax smoothly to an equilibrium with gradual decline of the kinetic energy. For instance, the kinetic energy keeps decreasing once the rotation is switched off at . In the quasi-static phase, almost all the magnetic energy injected from the bottom boundary is stored in the coronal volume, as shown by the close match of the energy injection line (the gray curve in Figure 7a) and the evolution profile of the total magnetic energy. Clearly, the time scale of the quasi-static evolution depends on that of the bottom driving. Since we used a surface speed (of about km s-1) larger than the actual photospheric motion speed, the quasi-static phase in our simulation (with a duration of hours) is much shorter than the realistic one (nearly hours). It can be scaled approximately to the realistic one if we use the realistic speed (for example, on the order of km s-1) of the photospheric motion, but that demands too much computing time.
The second phase from around to the onset time of eruption (i.e., ) is a slow rise phase, in which the kinetic energy slowly rises and the magnetic energy evolution begins to deviate evidently from the magnetic energy injection curve. This phase is also featured by a relatively large speed of km s-1 as shown in the expansion rate of the core field. A more important reason why this phase is different from the first phase in nature is that, if the bottom driving is turned off at any moment in this phase, the system will not relax to a static equilibrium (for example, see the evolution of the kinetic energy when the surface driving is turned off at in Figure 7a). Rather, the kinetic energy keeps an approximately constant value without decay, and meanwhile the magnetic energy decreases slowly. Moreover, no matter at which moment the boundary driving is switched off, the system will always reach an eruption phase after a short interval of evolution (for instance, see the case with sunspot rotation stopped at , for which the magnetic field and current density evolution are shown in the animation attached for Figure 7). These experiments show that the bottom driving is not necessary in maintaining the slow rise phase (once it begins), although it can slightly speed up this process. The time duration of slow rise phase is around , which is on the same order of that of the observed slow rise phase (around min).
Why the slow rise phase must proceed for a short interval before the eruption, regardless of the bottom boundary driving? This is because only when the current sheet reaches the critical thickness can the eruption be triggered by reconnection. In Figure 7b, we also show evolution of the thickness of the current sheet in the different runs. As can be seen, the current layer is continually thinned and once its thickness is below the resolvable limit of the grid resolution (about 3 grid sizes), the impulsive acceleration of the fast eruption phase begins. When turning off the bottom driving at , the current layer is still thinned although the rate is slightly slower, and the eruption is initiated in the same way when the current sheet reaches the critical thickness. In contrast, when the boundary driving is stopped at before the slow-rise phase begins, the system will relax to an equilibrium without changing the thickness of the current layer, and thus cannot develop the current sheet as required for reconnection.
Although our simulations suggest a slow rise phase analogous to the observed one, the duration of this phase should be sensitive to the magnitudes of the resistivity and the bottom boundary driving. If the resistivity is smaller, the eruption is expected to be delayed since a thinner current sheet would form and needs more time, thus this phase would be longer. With a slower driving speed at the bottom boundary, this phase is also expected to be longer. In our simulations, both the resistivity and the driving speed are much larger than the real values, for which it is formidable to realize at present in numerical simulations.
V Conclusions and discussion
In this paper, based on observation and MHD simulations, we have studied the process of a rotating sunspot in AR 12158 causing a major solar eruption. Our simulations demonstrated that the continuous rotation of a major sunspot of the AR leads to an eruption in a way distinct from the conventional view based on ideal MHD instabilities of twisted flux rope. It is found that through the successive rotation of the sunspot the coronal field is sheared with a vertical current sheet created progressively, and once fast reconnection sets in at the current sheet, the eruption is instantly triggered, and a highly twisted flux rope originates from the eruption, forming a CME. Therefore, in the two independent simulations, i.e., a data-driven one in Paper I and a data-inspired one here, we found that their eruptions are initiated by essentially the same way: the coronal field is stressed until a central current sheet forms with fast reconnection which triggers and results in eruption.
The simulation here also revealed explicitly a slow-rise evolution phase between the quasi-static phase of non-potential magnetic energy storage and the impulsive acceleration phase of eruption. Such a slow-rise phase is commonly observed in many eruption events (including the studied one) for either erupting filaments or coronal loops but still lacks a physical explanation. Our analysis suggests that the slow-rise phase is inherent to the coronal dynamics when close to eruption rather than controlled by the photospheric driving motions as considered before (Vršnak 2019). Once it begins the slow-rise phase develops for a short time interval (often with a few tens of minutes), even if the boundary driving is turned off, and eventually transforms into an eruption. This short phase plays an important role in building up of the current sheet, since it accelerates the thinning of the current layer that is built up in the quasi-static phase until the reconnection sets in.
Why do our simulations support such a scenario rather than that based on MHD instabilities of pre-eruption MFRs? There are two reasons. Firstly, the rotation of sunspot is too slow to form a well-defined MFR in a few days. Observations show that the angular rotational speed for many sunspots is on average a few degrees per hour and the total rotation degree is mostly between 40–200∘ over periods of 3–5 days (Brown et al. 2003). Thus, the resulted magnetic twist by such rotation is far lower than that necessary to form a well-defined MFR (which needs field lines winding around an axis with at least one turn, or twist of ) and further to trigger the ideal kink instability (which needs winding number of more than turns (Hood & Priest 1979) or twist of more than ). Even though the sunspot in the well known AR 10930 is reported to rotate by a very large amount of about over five days (Min & Chae 2009), there were many eruptions in that duration (AR 10930 produced 4 homologous X-class eruptive flares and a few smaller ones) and thus these eruptions should release substantially the built-up twist repeatedly, preventing the continuous formation of a well-defined twisted rope. Indeed, this is supported by a previous study of AR 10930 (Wang et al. 2022), in which a MHD simulation was carried out using a similar approach in this paper. In that work, the simulation started with a potential magnetic field reconstructed from the observed magnetogram and then rotational motion is applied to the positive sunspot of the AR to mimic the observed rotation. That simulation successfully showed that the sunspot rotation produced homologous eruptions having reasonable consistency with observations in relative strength, energy release, spatial features (such as pre-eruption sigmoid and flare ribbons), and time intervals of eruptions. In addition, in the simulation the total angle of rotation of the sunspot until the eruption onset is also very close to the observed value. The key finding is also similar to this paper: as driven by the sunspot rotation, current sheet is formed above the main PIL between the two major magnetic polarities of the AR, and the eruptions are triggered by fast reconnection in the pre-eruption formed current sheet.
Secondly, sunspot rotation, although slow, is a very efficient way of injecting magnetic free energy. For example, by modelling of a solar flare from 13 May 2005, it has been shown that the sunspot rotation of the source AR dominates the energy accumulation for the flare event (Kazachenko et al. 2009). In fact, such sunspot rotation alone can store sufficient energy to power a very large flare. Our simulation demonstrated this point more clearly as shown in Figure 7a; by a rotation of (on average for the whole sunspot), the free energy has been increased by over 50% of the potential field energy. As the open field energy is an upper limiter, which is around times of the potential field energy, this made it very easy for the field to reach the open field energy, if the rotation is as large as . The open field is closely related to the building up of the current sheet, since a current sheet must be built up before the field becoming fully open, as consistent with our previous high-resolution simulation based on a simple bipolar field (Jiang et al. 2021b). Thus, to build up a current sheet needs much less degree of rotation than that for building up an unstable MFR, as the former is more consistent with the observation of the rotation degrees.
Nevertheless, there is also a possibility in some events that the rotation of sunspot drives the formation of the current sheet, but a confined flare is resulted if the overlying field is strong enough (or decay slowly enough) to constrain the newly-formed, erupting flux rope. With continuous rotation, such confined flares might occur multiple times and jointly build up an ideal unstable MFR that eventually erupts, as suggested by recent observations (James et al. 2020). Another possibility is that during the sunspot rotation, continuous slow reconnection might occur at near the photosphere, which is often associated with the observed flux cancellation, can also help to build up unstable MFR before eruption. This will need further investigations with more events and simulations.
References
- Aly (1991) Aly, J. J. 1991, The Astrophysical Journal, 375, L61, doi: 10.1086/186088
- Amari et al. (2003) Amari, T., Luciani, J. F., Aly, J. J., Mikic, Z., & Linker, J. 2003, The Astrophysical Journal, 595, 1231, doi: 10.1086/377444
- Amari et al. (1996) Amari, T., Luciani, J. F., Aly, J. J., & Tagger, M. 1996, The Astrophysical Journal, 466, L39, doi: 10.1086/310158
- Aschwanden (2019) Aschwanden, M. J. 2019, Astrophysics and Space Science Library, Vol. 458, New Millennium Solar Physics (Cham: Springer International Publishing), doi: 10.1007/978-3-030-13956-8
- Aulanier et al. (2005) Aulanier, G., Démoulin, P., & Grappin, R. 2005, Astronomy & Astrophysics, 430, 1067, doi: 10.1051/0004-6361:20041519
- Aulanier et al. (2010) Aulanier, G., Török, T., Démoulin, P., & DeLuca, E. E. 2010, The Astrophysical Journal, 708, 314, doi: 10.1088/0004-637X/708/1/314
- Barnes & Sturrock (1972) Barnes, C. W., & Sturrock, P. A. 1972, The Astrophysical Journal, 174, 659, doi: 10.1086/151527
- Bhattacharjee et al. (2009) Bhattacharjee, A., Huang, Y.-M., Yang, H., & Rogers, B. 2009, Physics of Plasmas, 16, 112102, doi: 10.1063/1.3264103
- Bi et al. (2016) Bi, Y., Jiang, Y., Yang, J., et al. 2016, Nature Communications, 7, 13798, doi: 10.1038/ncomms13798
- Bian et al. (2022a) Bian, X., Jiang, C., Feng, X., Zuo, P., & Wang, Y. 2022a, The Astrophysical Journal Letters, 925, L7, doi: 10.3847/2041-8213/ac4980
- Bian et al. (2022b) Bian, X., Jiang, C., Feng, X., et al. 2022b, Astronomy & Astrophysics, 658, A174, doi: 10.1051/0004-6361/202141996
- Brown et al. (2003) Brown, D., Nightingale, R., Alexander, D., et al. 2003, Solar Physics, 216, 79, doi: 10.1023/A:1026138413791
- Brown & Walker (2021) Brown, D., & Walker, A. 2021, Solar Physics, 296, 48, doi: 10.1007/s11207-021-01787-4
- Chen (2017) Chen, J. 2017, Physics of Plasmas, 24, 090501, doi: 10.1063/1.4993929
- Cheng et al. (2017) Cheng, X., Guo, Y., & Ding, M. 2017, Science China Earth Sciences, 60, 1383, doi: 10.1007/s11430-017-9074-6
- Cheung & DeRosa (2012) Cheung, M. C. M., & DeRosa, M. L. 2012, The Astrophysical Journal, 757, 147, doi: 10.1088/0004-637X/757/2/147
- Daughton et al. (2011) Daughton, W., Roytershteyn, V., Karimabadi, H., et al. 2011, Nature Physics, 7, 539, doi: 10.1038/nphys1965
- Démoulin et al. (1996) Démoulin, P., Priest, E. R., & Lonie, D. P. 1996, Journal of Geophysical Research: Space Physics, 101, 7631, doi: 10.1029/95JA03558
- Duan et al. (2017) Duan, A., Jiang, C., Hu, Q., et al. 2017, The Astrophysical Journal, 842, 119, doi: 10.3847/1538-4357/aa76e1
- Dudík et al. (2016) Dudík, J., Polito, V., Janvier, M., et al. 2016, The Astrophysical Journal, 823, 41, doi: 10.3847/0004-637X/823/1/41
- Emslie et al. (2012) Emslie, A. G., Dennis, B. R., Shih, A. Y., et al. 2012, The Astrophysical Journal, 759, 71, doi: 10.1088/0004-637X/759/1/71
- Evershed. (1910) Evershed., J. 1910, Monthly Notices of the Royal Astronomical Society, 70, 217, doi: 10.1093/mnras/70.3.217
- Fan & Gibson (2007) Fan, Y., & Gibson, S. E. 2007, The Astrophysical Journal, 668, 1232, doi: 10.1086/521335
- Forbes & Isenberg (1991) Forbes, T. G., & Isenberg, P. A. 1991, The Astrophysical Journal, 373, 294, doi: 10.1086/170051
- Galsgaard & Nordlund (1997) Galsgaard, K., & Nordlund, Å. 1997, Journal of Geophysical Research: Space Physics, 102, 219, doi: 10.1029/96JA01462
- Gou et al. (2023) Gou, T., Liu, R., Veronig, A. M., et al. 2023, Nature Astronomy, doi: 10.1038/s41550-023-01966-2
- Green et al. (2018) Green, L. M., Török, T., Vršnak, B., Manchester, W., & Veronig, A. 2018, Space Science Reviews, 214, 46, doi: 10.1007/s11214-017-0462-5
- He et al. (2022) He, W., Hu, Q., Jiang, C., Qiu, J., & Prasad, A. 2022, The Astrophysical Journal, 934, 103, doi: 10.3847/1538-4357/ac78df
- Hood & Priest (1979) Hood, A. W., & Priest, E. R. 1979, Solar Physics, 64, 303, doi: 10.1007/BF00151441
- James et al. (2020) James, A. W., Green, L. M., van Driel-Gesztelyi, L., & Valori, G. 2020, Astronomy & Astrophysics, doi: 10.1051/0004-6361/202038781
- Jiang et al. (2021a) Jiang, C., Chen, J., Duan, A., et al. 2021a, Frontiers in Physics, 9, 746576, doi: 10.3389/fphy.2021.746576
- Jiang et al. (2022) Jiang, C., Feng, X., Guo, Y., & Hu, Q. 2022, The Innovation, 3, 100236, doi: 10.1016/j.xinn.2022.100236
- Jiang et al. (2021b) Jiang, C., Feng, X., Liu, R., et al. 2021b, Nature Astronomy, 5, 1126, doi: 10.1038/s41550-021-01414-z
- Jiang et al. (2023) Jiang, C., Feng, X., Bian, X., et al. 2023, arXiv e-prints, arXiv:2308.06977, doi: 10.48550/arXiv.2308.06977
- Jiang et al. (2012) Jiang, Y., Zheng, R., Yang, J., et al. 2012, The Astrophysical Journal, 744, 50, doi: 10.1088/0004-637X/744/1/50
- Kazachenko et al. (2009) Kazachenko, M. D., Canfield, R. C., Longcope, D. W., et al. 2009, The Astrophysical Journal, 704, 1146, doi: 10.1088/0004-637X/704/2/1146
- Kilpua et al. (2021) Kilpua, E. K. J., Pomoell, J., Price, D., Sarkar, R., & Asvestari, E. 2021, Frontiers in Astronomy and Space Sciences, 8, 631582, doi: 10.3389/fspas.2021.631582
- Kliem et al. (2014) Kliem, B., Lin, J., Forbes, T. G., Priest, E. R., & Török, T. 2014, The Astrophysical Journal, 789, 46, doi: 10.1088/0004-637X/789/1/46
- Kliem & Török (2006) Kliem, B., & Török, T. 2006, Physical Review Letters, 96, 255002, doi: 10.1103/PhysRevLett.96.255002
- Li & Zhang (2015) Li, T., & Zhang, J. 2015, The Astrophysical Journal, 804, L8, doi: 10.1088/2041-8205/804/1/L8
- Lin & Forbes (2000) Lin, J., & Forbes, T. G. 2000, Journal of Geophysical Research: Space Physics, 105, 2375, doi: 10.1029/1999JA900477
- Liu (2020) Liu, R. 2020, Research in Astronomy and Astrophysics, 20, 165, doi: 10.1088/1674-4527/20/10/165
- Liu et al. (2016) Liu, R., Kliem, B., Titov, V. S., et al. 2016, The Astrophysical Journal, 818, 148, doi: 10.3847/0004-637X/818/2/148
- Mikic et al. (1990) Mikic, Z., Schnack, D. D., & van Hoven, G. 1990, The Astrophysical Journal, 361, 690, doi: 10.1086/169232
- Min & Chae (2009) Min, S., & Chae, J. 2009, Solar Physics, 258, 203, doi: 10.1007/s11207-009-9425-7
- Schuck (2008) Schuck, P. W. 2008, The Astrophysical Journal, 683, 1134, doi: 10.1086/589434
- Shen et al. (2022) Shen, J., Ji, H., & Su, Y. 2022, Research in Astronomy and Astrophysics, 22, 015019, doi: 10.1088/1674-4527/ac389b
- St. John (1913) St. John, C. E. 1913, The Astrophysical Journal, 37, 322, doi: 10.1086/142002
- Stenflo (1969) Stenflo, J. O. 1969, Solar Physics, 8, 115, doi: 10.1007/BF00150662
- Sturrock (1991) Sturrock, P. A. 1991, The Astrophysical Journal, 380, 655, doi: 10.1086/170620
- Titov et al. (2002) Titov, V. S., Hornig, G., & Démoulin, P. 2002, Journal of Geophysical Research: Space Physics, 107, SSH 3, doi: 10.1029/2001JA000278
- Török & Kliem (2003) Török, T., & Kliem, B. 2003, Astronomy & Astrophysics, 406, 1043, doi: 10.1051/0004-6361:20030692
- Török & Kliem (2005) —. 2005, The Astrophysical Journal, 630, L97, doi: 10.1086/462412
- Török et al. (2013) Török, T., Temmer, M., Valori, G., et al. 2013, Solar Physics, 286, 453, doi: 10.1007/s11207-013-0269-9
- Vemareddy et al. (2012) Vemareddy, P., Ambastha, A., & Maurya, R. A. 2012, The Astrophysical Journal, 761, 60, doi: 10.1088/0004-637X/761/1/60
- Vemareddy et al. (2016) Vemareddy, P., Cheng, X., & Ravindra, B. 2016, The Astrophysical Journal, 829, 24, doi: 10.3847/0004-637X/829/1/24
- Vršnak (2008) Vršnak, B. 2008, Annales Geophysicae, 26, 3089, doi: 10.5194/angeo-26-3089-2008
- Vršnak (2019) —. 2019, Frontiers in Astronomy and Space Sciences, 6, 28, doi: 10.3389/fspas.2019.00028
- Wang et al. (2022) Wang, X., Jiang, C., Feng, X., Duan, A., & Bian, X. 2022, The Astrophysical Journal, 938, 61, doi: 10.3847/1538-4357/ac8d0e
- Yan et al. (2008) Yan, X.-L., Qu, Z.-Q., & Kong, D.-F. 2008, Monthly Notices of the Royal Astronomical Society, 391, 1887, doi: 10.1111/j.1365-2966.2008.14002.x
- Yan et al. (2018a) Yan, X. L., Wang, J. C., Pan, G. M., et al. 2018a, The Astrophysical Journal, 856, 79, doi: 10.3847/1538-4357/aab153
- Yan et al. (2018b) Yan, X. L., Yang, L. H., Xue, Z. K., et al. 2018b, The Astrophysical Journal, 853, L18, doi: 10.3847/2041-8213/aaa6c2
- Zhang et al. (2007) Zhang, J., Li, L., & Song, Q. 2007, The Astrophysical Journal, 662, L35, doi: 10.1086/519280
- Zheng et al. (2017) Zheng, J., Yang, Z., Guo, J., et al. 2017, Research in Astronomy and Astrophysics, 17, 081, doi: 10.1088/1674-4527/17/8/81