CHERI Performance Enhancement for a Bytecode InterpreterPrice: 15.00DOI: 10.1145/3623507.3623552splashws23vmilmain-p65-pISBN: 979-8-4007-0401-7/23/10Conference: Proceedings of the 15th ACM SIGPLAN International Workshop on Virtual Machines and Intermediate Languages; October 23, 2023; Cascais, PortugalProceedings of the 15th ACM SIGPLAN International Workshop on Virtual Machines and Intermediate Languages (VMIL ’23), October 23, 2023, Cascais, PortugalCCS: Software and its engineering InterpretersCCS: Software and its engineering Software performanceCCS: Security and privacy Virtualization and security
Abstract.
During our port of the MicroPython bytecode interpreter to the CHERI-based Arm Morello platform, we encountered a number of serious performance degradations. This paper explores several of these performance issues in detail, in each case we characterize the cause of the problem, the fix, and the corresponding interpreter performance improvement over a set of standard Python benchmarks.
While we recognize that Morello is a prototypical physical instantiation of the CHERI concept, we show that it is possible to eliminate certain kinds of software-induced runtime overhead that occur due to the larger size of CHERI capabilities (128 bits) relative to native pointers (generally 64 bits). In our case, we reduce a geometric mean benchmark slowdown from 5x (before optimization) to 1.7x (after optimization) relative to AArch64, non-capability, execution. The worst-case slowdowns are greatly improved, from 100x (before optimization) to 2x (after optimization).
The key insight is that implicit pointer size presuppositions pervade systems code; whereas previous CHERI porting projects highlighted compile-time and execution-time errors exposed by pointer size assumptions, we instead focus on the performance implications of such assumptions.
Keywords:
Capabilities, Morello, Python, software implementation1. Introduction
The CHERI concept of microarchitectural capabilities involves processor support for fat pointers and hardware checks on memory accesses. This radical, perhaps invasive, approach to improve dynamic memory safety is massively challenging for programming language runtimes. In previous work (Singer 2023; Lowther et al. 2023), we described our strategy for adapting the MicroPython runtime to run on a CHERI platform. In this earlier work, we tackled two key families of bugs:
- (1)
CHERI-induced compiler errors, caused by pointer size assumptions in the code base, or legacy C style pointer abuse; and,
- (2)
CHERI-induced runtime errors, due to capability violations in memory accesses—either out-of-bounds accesses or invalid capabilities.
Fixing these classes of bugs enabled us to get MicroPython up-and-running on CHERI; however the initial performance is poor. There appear to be significant runtime overheads and inefficiencies associated with CHERI.
In this work, we look at a further crucial stage in porting existing virtual machines to CHERI: i.e. performance optimization. Suppose we can get something running on a CHERI platform, how do we ensure it runs at an acceptable speed?
This paper starts with a working, but highly inefficient, port of MicroPython to CHERI; this version has a geometric mean slowdown of 5x (relative to equivalent non-CHERI execution) for a set of standard Python benchmarks. We follow a performance debugging strategy to identify and eliminate runtime overheads, noting these are mainly associated with dynamic memory management. After three rounds of software performance optimization, our CHERI MicroPython has a geometric mean slowdown of 1.7x (relative to non-CHERI). We expect there are further performance gains to be made, but this work clearly demonstrates that careful performance profiling and debugging is essential if CHERI is to be adopted by the language runtime community.
2. Background
2.1. CHERI and Morello
A Capability Hardware Enhanced RISC Instructions (CHERI) system (Woodruff et al. 2014; Watson et al. 2020) is a collection of instruction set extensions and processor logic for modern micro-architectures, providing direct support for embedding metadata into ‘fat’ pointers to enable runtime checks on the use of these values (which are known as capabilities). Key properties enforced by CHERI include the following:
- (1)
Capabilities cannot be forged and have to be derived from an existing capability enforced by a validity tag (so, no casting from int to void *).
- (2)
Capability spatial bounds are tightly enforced, and bounds cannot be ‘grown’, only monotonically reduced.
- (3)
Capabilities have permissions, similar to page-table permissions (r/w/x) but they enable fine-grained control – effectively capabilities provide per-pointer permissions.
The CHERI concept has been instantiated by Arm in the Morello prototype architecture (Arm 2021). Morello is a quad-core 64-bit Arm processor (ISA v8.2-A) based on the commercially available Neoverse N1 system. While we recognize there may be minor performance anomalies and inconsistencies in this prototype implementation (Watson et al. 2023), it is a fully-functional platform and can provide useful performance forecasts for CHERI adopters. Whereas in conventional AArch64 processors, a pointer is simply a 64-bit machine word, on Morello an architectural capability is a 128-bit value that includes an address, bounds, and associated metadata (Woodruff et al. 2019). Further, the validity ‘tag’ bit is stored out-of-band and cannot be manipulated directly by user code.
2.2. CHERI Porting
A great deal of open-source software has been ported to CHERI and Morello (Watson et al. 2015; Davis et al. 2019). In particular, the FreeBSD OS has a port named CheriBSD. Many user-space applications have been adapted for CHERI, often with minimal source code changes. A port of the KDE desktop framework reportedly incurred only 0.026% lines of altered code (Watson et al. 2021).
However, systems level code is more likely to feature pointer-intensive operations and unusual interactions with memory. These are the areas where adaptation for CHERI is more complicated. One study of CHERI memory allocators (Bramley et al. 2023) reveals that, for some real-world C library malloc implementations, up to 10% of the code base requires modification. Further, performance of memory allocators on Morello is inconsistent and the performance profiling tools are not sufficiently mature to diagnose the root causes of problems.
There are a few VM ports to CHERI at least partially underway. Of these, the most complete appears to be a JavaScriptCore port (Gutstein 2022). However so far, no meaningful performance results are publicly available for this or any other VM on Morello.
2.3. MicroPython
MicroPython (George 2013) is a small-scale Python interpreter, largely written in C, explicitly targeting microcontroller scale devices. It is a straightforward bytecode interpreter with a fixed size heap, implementing a non-moving mark/sweep garbage collector. MicroPython features a set of libraries, some of which are specific for the embedded systems domain, others are general purpose. The interpreter can be compiled and executed as a standalone, user-space process VM on a POSIX host environment. We have adapted MicroPython for CHERI, based on this process VM model, running on CheriBSD. A work-in-progress report describes our initial work (Singer 2023) and a follow-on paper describes the complete port (Lowther et al. 2023). Since then, we have been looking at performance optimization, particularly focusing on high-overhead memory management aspects of the VM.
MicroPython comes with a set of benchmarks, some of which are intended for performance measurements. These are based in part on the Programming Language Shootout benchmarks (Marr et al. 2016), which are familiar to VM developers across multiple languages. In our performance optimization work, as in other assessments of CHERI performance, we compare AArch64 code running on Morello (known as hybrid mode) with capability-enhanced code running on the same platform (known as purecap mode). We measure and report the performance of the purecap code for each benchmark, relative to the equivalent execution of hybrid code. In our case, these are identical bytecode benchmarks running on distinct MicroPython interpreter instances (an AArch64 executable versus a CHERI executable).
Subsequent sections in this paper explore the software performance optimizations we applied for MicroPython on the Morello platform.
3. Heap Block Size

When we first evaluated the performance of our purecap build of the MicroPython interpreter, we saw highly concerning runtime overheads on four of the benchmarks Figure 1. On two of the benchmarks, the purecap execution time exceeded 100x that of the hybrid version (fannkuch at 135.7 and nqueens at 100.0); two more had overheads above 10x (pystone at 21.3 and pydigits at 15.2).
We began by tackling the 100x overheads. One thing that fannkuch and nqueens had in common was repetitive list-slicing operations, and a further list-slicing microbenchmark confirmed that the overhead was caused by those operations. It is also useful to note that the normalised instruction-retired counts were elevated at similar levels to the normalised execution time.
To build a more detailed execution profile, the pmcstat utility (a FreeBSD profiling tool) was used
to sample the callchain of the fannkuch benchmark at every 65536 instructions retired. The current version of pmcstat on CheriBSD had issues resolving the symbols of the purecap binary
By creating a simple program to read the pmcstat dump, print out raw memory addresses and performing a manual lookup,
we concluded that 99.3% (1820989/1833685) of the samples occured in the gc_alloc() function in the top stack frame.
The gc_alloc() function is an API-level entry point of the heap allocator in MicroPython.
Figure 2 is a histogram of the sampled PC values within the gc_alloc() function. The samples are very clearly concentrated in the interval between 0x1602d0 and 0x160338. By debugging (using gdb) and mapping these addresses to symbols in the MicroPython binary pointed to a for-loop in the allocator, used to search for a contiguous run of free blocks of the appropriate length. From this, we conjectured that the issue was due to increased memory fragmentation, likely caused by the width of a CHERI capability being double the width of a AArch64 pointer
MicroPython’s in-built GC statistics functionality shows a large number of 1-block allocations when executing the interpreter compiled in hybrid mode. There were no statistically significant 1-block allocations during execution of the purecap interpreter. MicroPython’s default blocksize is 4*sizeof(mp_uint_t), i.e. four times the platform word size. As both hybrid and purecap use 64-bit integers, they used the same block size, despite purecap objects being larger due to the 128-bit size of capabilities. Changing the block size to 4*sizeof(mp_obj_t) (i.e., scaling based on pointer size rather than integer size) restored the expected frequency of 1-block allocations and fixed the overhead issue, as shown in Figure 3.
The frequency of 1-block allocations is important, because MicroPython’s allocator only advances its ‘last-free index’ (the point at which a new call to gc_alloc() begins searching for free blocks) when a 1-block allocation is made. This guarantees that there are no free blocks in the ‘skipped’ region, but also means that the index lags significantly behind the actual first free block when most allocations are two or more blocks long. A more sophisticated allocator could update the index more often, but this paper focuses on the removal of purecap-introduced overhead and such changes, being shared with the reference implementation, would be out of scope.
4. Stack Frame Size


After changing the block-size to a multiple of capability-width,
the purecap version displayed a execution time, relative to the hybrid version,
of 1.5 to 2.1 times on all benchmarks except pystone. Pystone executed by
the purecap interpreter showed a normalised slowdown of around 3.7x.
We thus turned our attention to diagnosing the performance issues in this particular benchmark.
The custom program that was used to read pmcstat dumps to look up addresses in this table was augmented
with the symbol-table extracted from the binary. This is done using the llvm-objdump-morello tool.
We also modified it to output the samples in a format readable by Brendan Gregg’s(Gregg 2016a; Gregg 2016b)
Flame Graph scripts.
A flame graph shows aggregated stack traces over the full execution of a program,
so the width of each function bar on the graph indicates the amount of time
spent executing that function.
Figures 4 and 5 show the flame graphs
of the execution of the pystone benchmark, sampled every 65536 instructions.
From these graphs, it was clear that gc_alloc() was again a significant source of overhead.
The gc_alloc() allocator function accounted
for approximately a quarter of the overall instruction count
on the purecap version while being statistically insignificant for the hybrid execution run.
Looking at the program counter samples within gc_alloc() again showed a concentration in the search-for-free-blocks loop. Instrumenting the allocator showed that this loop ran over 200 times as many iterations on the purecap version as the hybrid version. Further, there were thousands of 3- and 4- block allocation calls on the purecap version that did not occur on the hybrid version.
Unlike in Section 3, where a similar symptom was due to the purecap allocations taking up more blocks than their hybrid equivalents, in this case, these were in addition to a comparable number of 1- and 2-block allocations.
Referring back to Figure 5 we see that the most expensive gc_alloc() calls are coming from fun_bc_call() (through the wrapper m_malloc_maybe()). Tracing these calls, we found that they occured when allocating space for the call frame of a Python function.
The interpreter places smaller stack frames on the C stack and larger stack frames in the heap and is controlled by the configurable compile-time constant value VM_MAX_STATE_ON_STACK.
This constant, like the block size, is calculated based on the integer word size – a frame of up to 16 words will be allocated on the stack.
On purecap, frames are generally twice as large as hybrid, and so were being
heap-allocated more frequently. 16 words occupy 128 bytes on a 64-bit system, or 2 ‘new’ heap blocks on purecap. Frames that would, on hybrid, fit within this limit may be up to 256 bytes on purecap, or 4 ‘new’ heap blocks. Thus, the frames spilled because of the change to purecap were all 3 or 4 blocks long, resulting in the anomalous increase in allocation calls noted earlier.

We introduced a change, to redefine the compile-time constant VM_MAX_STATE_ON_STACK based on the size of a pointer rather than the size of an integer.
This ensures that call stacks are not spilled where they would be stack-allocated in the reference implementation. Following this adjustment, the purecap interpreter displayed a significant performance improvement, as shown in Figure 6. The normalised execution time on the pystone benchmark dropped from 3.7 to 2.8, with all other benchmarks under 2.0. The new flame graph (Figure 7) shows that gc_alloc() is no longer a significant overhead.
5. Compilation Inefficiency
Following the fixes in the previous two sections, the performance on the pystone benchmark, while much improved, was still noticably worse than the other benchmarks. As can be seen in Figure 6, while normalised instructions-retired no longer tightly tracks normalised execution time, it is still (at 1.8) a significant contributor to the overhead. We thus once more examine why so many more instructions are being executed by the purecap version.
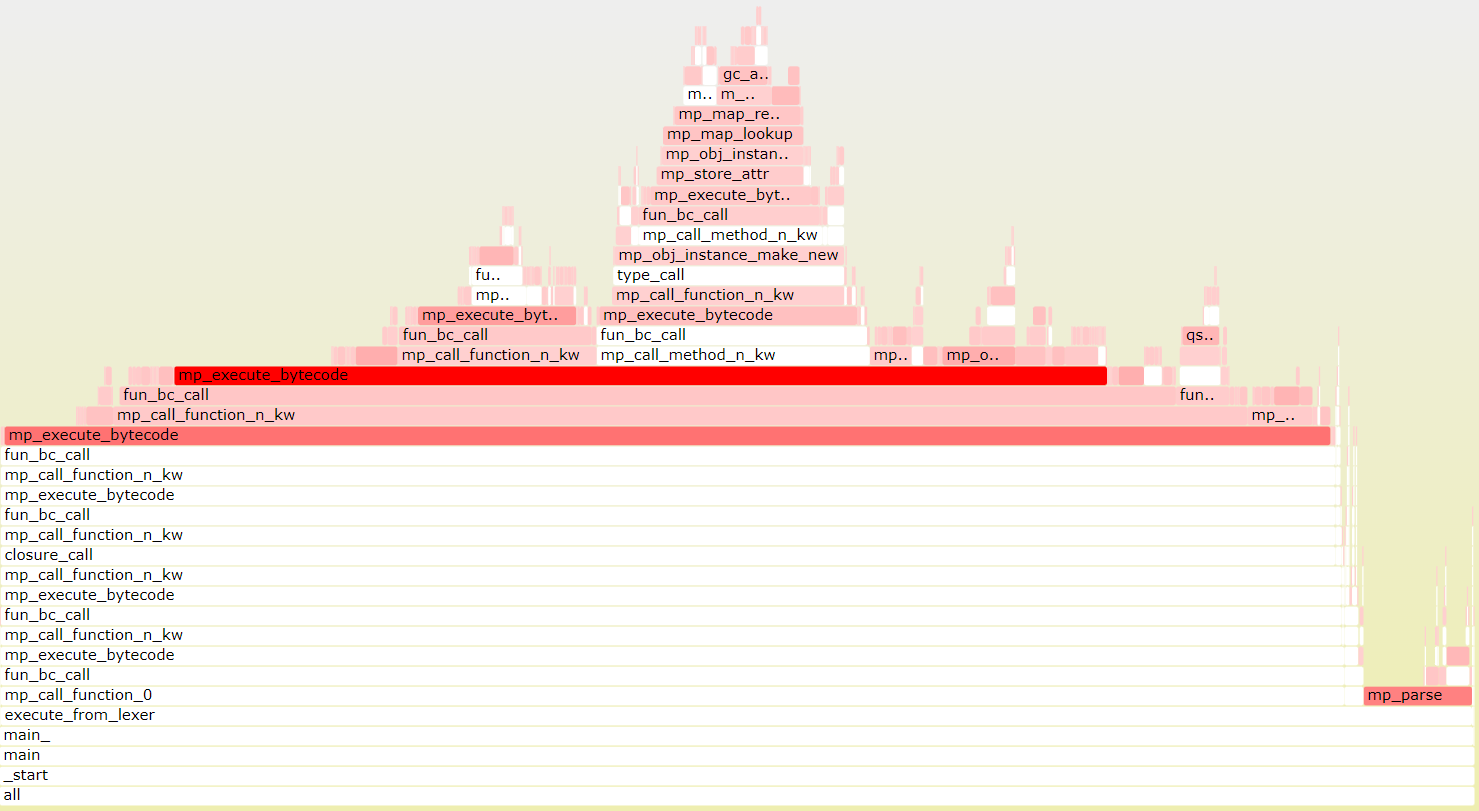
As the individual flame graphs in Figures 4 and 7 are now similar enough to be difficult to distinguish by eye, Figure 8 shows the differential flame graph, where the difference in sample counts within a given function is indicated by the colour of that function’s box. Red indicates an overhead (purecap hybrid) while blue indicates a saving (purecap hybrid); the saturation in either case indicates the magnitude of the difference.
From this graph we can see that the main remaining overhead (in instructions retired, at least) is localised in the function mp_execute_bytecode(). This is the function that implements the MicroPython VM, interpreting the MPY bytecode for a given function by means of a computed-goto statement utilising a branch table, with each branch handling a particular bytecode instruction and then (unless execution halts due to a return or exception) performing another computed-goto to process the next instruction.
This is functionally a very tight loop – the DISPATCH sequence (saving the instruction pointer for exception-handling purposes and then performing the computed-goto) takes seven machine instructions (as shown in Listing 1). For the simpler bytecode instructions, the actual execution only takes one to four machine instructions, for a total of eight to eleven machine instructions per bytecode instruction.
While the DISPATCH sequence is compiled to the same number of machine instructions on both hybrid and purecap builds (seven), the same is not true for the other statements in the loop: there are several places where the purecap build uses more machine instructions to execute a given bytecode instruction than the hybrid build. As several of the bytecode instructions with a high ratio of capability instructions (known as C64) to generic Arm instructions (known as A64) were used far more frequently in pystone than other benchmarks, we conjectured that this was the cause of the overhead we saw.
While some of these extra machine instructions are unavoidable (for example, ‘tagging’ the low bits of a hybrid pointer requires a single ORR instruction while the same operation on a capability requires ORR followed by SCVALUE), a significant number of these are due to what appear to be odd choices by the compiler code generator. Listing 2 shows some of the more obvious cases of inefficiency. In the first two cases, the compiler generates extra instructions seemingly to ensure the upper bits of the capability are cleared. However, since writing to the 32- or 64-bit view of a capability register is defined to clear the capability metadata and tag,(Arm 2021) these ‘cast’ instructions are unnecessary. The third case takes this even further, with the compiler generating a ‘cast’ of the constant to a capability before performing an X-register
(i.e. non-capability) compare. In the fourth case, extra instructions are used to derive a new capability with a bit-masked value when the bit mask was only needed to test whether a particular bit was set. The final case involves breaking LDP/STP instructions into pairs of single-register loads and stores. This notably did not happen everywhere: in many places the purecap binary did contain LDP/STP instructions.
While these inefficiencies may seem insignificant at first glance, in a ‘hot’ loop of often fewer than 20 instructions in length they quickly add up. Unfortunately, these issues cannot be cleanly fixed in the MicroPython source but rather require changes to the C compiler. In order to determine the actual impact of these inefficiencies (and as a change to the C compiler was out of scope for the project), we patched the binary by hand to fix several of these inefficiencies, saving a total of 19 machine instructions across the various branches. The normalised performance of the purecap build after this patch is shown in Figure 9. The normalised execution time of pystone has fallen from 2.8 to 1.9, and the normalised instructions-retired count has fallen to a similar range as the other benchmarks. It should be stressed that we have by no means eliminated all of the compiler-introduced inefficiencies, and as the llvm-morello toolchain and other CHERI-aware compilers improve, we are likely to see significantly better performance from purecap software.
6. Conclusion
When porting systems software to Morello or other CHERI platforms, the focus is often on the correctness of the port. The issues identified in Sections 3 and 4 show that this is not sufficient: where parameters have been tuned in the original code based on an expectation of equal integer and pointer size, a CHERI port which does not adjust these parameters accordingly may exhibit unacceptable performance overheads despite being functionally correct.
After implementing the performance fixes described in this paper, all of our benchmarks showed between 1.4x and 2.0x execution time overhead on purecap, while overheads in terms of instructions retired ranged between 6.6% and 32% (Table 1). The results in Section 5 suggest that a significant amount of this overhead is due to inefficiencies in the compiler. The performance results here are also likely to be further mitigated as the new hardware is released that is better tuned for CHERI operations than the current Morello (Watson et al. [n. d.]).
| Metric | Best | Worst | Geometric mean |
|---|---|---|---|
| CPU cycles | 45.4% | 87.0% | 64.8% |
| Instructions retired | 6.6% | 32.1% | 16.4% |
| Cycles/instruction | 17.8% | 71.4% | 41.7% |
| L1-D-cache | 37.5% | 57.3% | 46.3% |
| L1-I-cache | -4.3% | 25.7% | 8.0% |
| L2-D-cache | 32.6% | 76.1% | 46.4% |
| Total time | 46.3% | 99.6% | 73.1% |
Acknowledgements.
This work was funded by the Digital Security by Design (DSbD) programme delivered by UKRI (including grants EP/V000349/1 and EP/X015831/1), also by the UK Defence and Security Accelerator contract ACC6037520.References
- (1)
- Arm (2021) Arm. 2021. Arm Architecture Reference Manual Supplement — Morello for A-profile Architecture. https://developer.arm.com/documentation/ddi0606/.
- Bramley et al. (2023) Jacob Bramley, Dejice Jacob, Andrei Lascu, Jeremy Singer, and Laurence Tratt. 2023. Picking a CHERI Allocator: Security and Performance Considerations. In Proceedings of the 2023 ACM SIGPLAN International Symposium on Memory Management. 111–123. https://doi.org/10.1145/3591195.3595278
- Davis et al. (2019) Brooks Davis, Robert N. M. Watson, Alexander Richardson, Peter G. Neumann, Simon W. Moore, John Baldwin, David Chisnall, Jessica Clarke, Nathaniel Wesley Filardo, Khilan Gudka, Alexandre Joannou, Ben Laurie, A. Theodore Markettos, J. Edward Maste, Alfredo Mazzinghi, Edward Tomasz Napierala, Robert M. Norton, Michael Roe, Peter Sewell, Stacey Son, and Jonathan Woodruff. 2019. CheriABI: Enforcing Valid Pointer Provenance and Minimizing Pointer Privilege in the POSIX C Run-Time Environment. In Proceedings of the Twenty-Fourth International Conference on Architectural Support for Programming Languages and Operating Systems. 379–393. https://doi.org/10.1145/3297858.3304042
- George (2013) Damien P. George. 2013. MicroPython. https://micropython.org.
- Gregg (2016a) Brendan Gregg. 2016a. The Flame Graph. Commun. ACM 59, 6 (may 2016), 48–57. https://doi.org/10.1145/2909476
- Gregg (2016b) Brendan Gregg. 2016b. The Flame Graph: This Visualization of Software Execution is a New Necessity for Performance Profiling and Debugging. Queue 14, 2 (mar 2016), 91–110. https://doi.org/10.1145/2927299.2927301
- Gutstein (2022) Brett Gutstein. 2022. Memory safety with CHERI capabilities: security analysis, language interpreters, and heap temporal safety. Technical Report UCAM-CL-TR-975. University of Cambridge, Computer Laboratory. https://doi.org/10.48456/tr-975
- Lowther et al. (2023) Duncan Lowther, Dejice Jacob, and Jeremy Singer. 2023. Morello MicroPython: A Python Interpreter for CHERI. In Proceedings of the 20th ACM SIGPLAN International Conference on Managed Programming Languages and Runtimes. https://doi.org/10.1145/3617651.3622991
- Marr et al. (2016) Stefan Marr, Benoit Daloze, and Hanspeter Mössenböck. 2016. Cross-Language Compiler Benchmarking: Are We Fast Yet?. In Proceedings of the 12th Symposium on Dynamic Languages. 120–131. https://doi.org/10.1145/2989225.2989232
- Singer (2023) Jeremy Singer. 2023. Towards Secure MicroPython on Morello (WIP). In Proceedings of the 24th ACM SIGPLAN/SIGBED International Conference on Languages, Compilers, and Tools for Embedded Systems. 134–137. https://doi.org/10.1145/3589610.3596272
- Watson et al. (2015) Robert NM Watson, Jonathan Woodruff, Peter G Neumann, Simon W Moore, Jonathan Anderson, David Chisnall, Nirav Dave, Brooks Davis, Khilan Gudka, Ben Laurie, et al. 2015. CHERI: A hybrid capability-system architecture for scalable software compartmentalization. In IEEE Symposium on Security and Privacy. 20–37.
- Watson et al. (2023) Robert N. M. Watson, Graeme Barnes, Jessica Clarke, Richard Grisenthwaite, Peter Sewell, Simon W. Moore, and Jonathan Woodruff. 2023. Arm Morello Programme: Architectural security goals and known limitations. Technical Report UCAM-CL-TR-982. University of Cambridge, Computer Laboratory. https://doi.org/10.48456/tr-982
- Watson et al. ([n. d.]) Robert N. M. Watson, Jessica Clarke, Peter Sewell, Jonathan Woodruff, Simon W. Moore, Graeme Barnes, Richard Grisenthwaite, Kathryn Stacer, Silviu Baranga, and Alexander Richardson. [n. d.]. Early performance results from the prototype Morello microarchitecture. Technical Report UCAM-CL-TR-986. University of Cambridge, Computer Laboratory, 15 JJ Thomson Avenue, Cambridge CB3 0FD, United Kingdom, phone +44 1223 763500.
- Watson et al. (2021) Robert N. M. Watson, Ben Laurie, and Alex Richardson. 2021. Assessing the Viability of an Open-Source CHERI Desktop Software. https://www.capabilitieslimited.co.uk/_files/ugd/f4d681_e0f23245dace466297f20a0dbd22d371.pdf
- Watson et al. (2020) Robert N. M. Watson, Peter G. Neumann, Jonathan Woodruff, Michael Roe, Hesham Almatary, Jonathan Anderson, John Baldwin, Graeme Barnes, David Chisnall, Jessica Clarke, Brooks Davis, Lee Eisen, Nathaniel Wesley Filardo, Richard Grisenthwaite, Alexandre Joannou, Ben Laurie, A. Theodore Markettos, Simon W. Moore, Steven J. Murdoch, Kyndylan Nienhuis, Robert Norton, Alexander Richardson, Peter Rugg, Peter Sewell, Stacey Son, and Hongyan Xia. 2020. Capability Hardware Enhanced RISC Instructions: CHERI Instruction-Set Architecture (Version 8). Technical Report UCAM-CL-TR-951. University of Cambridge, Computer Laboratory. https://doi.org/10.48456/tr-951
- Woodruff et al. (2019) Jonathan Woodruff, Alexandre Joannou, Hongyan Xia, Anthony Fox, Robert M. Norton, David Chisnall, Brooks Davis, Khilan Gudka, Nathaniel W. Filardo, A. Theodore Markettos, Michael Roe, Peter G. Neumann, Robert N. M. Watson, and Simon W. Moore. 2019. CHERI Concentrate: Practical Compressed Capabilities. IEEE Trans. Comput. 68, 10 (April 2019), 1455–1469. https://doi.org/10.1109/TC.2019.2914037
- Woodruff et al. (2014) Jonathan Woodruff, Robert N.M. Watson, David Chisnall, Simon W. Moore, Jonathan Anderson, Brooks Davis, Ben Laurie, Peter G. Neumann, Robert Norton, and Michael Roe. 2014. The CHERI Capability Model: Revisiting RISC in an Age of Risk. In Proceeding of the 41st Annual International Symposium on Computer Architecuture. 457–468. https://doi.org/10.1145/2678373.2665740