Effect of coat-protein concentration on the
self-assembly of bacteriophage MS2 capsids around RNA
LaNell A. Williams,a
Andreas Neophytou,b
Rees F. Garmann,c,d,e
Dwaipayan Chakrabarti,b
Vinothan N. Manoharan,∗c,a
Self-assembly is a vital part of the life cycle of certain icosahedral RNA viruses. Furthermore, the assembly process can be harnessed to make icosahedral virus-like particles (VLPs) from coat protein and RNA in vitro. Although much previous work has explored the effects of RNA-protein interactions on the assembly products, relatively little research has explored the effects of coat-protein concentration. We mix coat protein and RNA from bacteriophage MS2, and we use a combination of gel electrophoresis, dynamic light scattering, and transmission electron microscopy to investigate the assembly products. We show that with increasing coat-protein concentration, the products transition from well-formed MS2 VLPs to “monster” particles consisting of multiple partial capsids to RNA-protein condensates consisting of large networks of RNA and partially assembled capsids. We argue that the transition from well-formed to monster particles arises because the assembly follows a nucleation-and-growth pathway in which the nucleation rate depends sensitively on the coat-protein concentration, such that at high protein concentrations, multiple nuclei can form on each RNA strand. To understand the formation of the condensates, which occurs at even higher coat-protein concentrations, we use Monte Carlo simulations with coarse-grained models of capsomers and RNA. These simulations suggest that the the formation of condensates occurs by the adsorption of protein to the RNA followed by the assembly of capsids. Multiple RNA molecules can become trapped when a capsid grows from capsomers attached to two different RNA molecules or when excess protein bridges together growing capsids on different RNA molecules. Our results provide insight into an important biophysical process and could inform design rules for making VLPs for various applications.
1 Introduction
For positive-strand RNA viruses to replicate, coat proteins must assemble around the viral RNA to form new virus particles. 1 Certain features of this assembly process can be replicated in vitro, in the absence of host-cell factors. 2, 3, 4 For example, virus-like particles (VLPs) can be assembled from solutions of the coat protein and RNA of bacteriophage MS2. Wild-type MS2 particles have an icosahedral capsid (triangulation number , diameter about 30 nm) containing one maturation protein and 178 coat proteins surrounding an RNA strand with approximately 3600 nucleotides. By contrast, MS2 VLPs that assemble in vitro lack the maturation protein required for infectivity. Nonetheless, they can adopt the same structure and size as wild-type MS2 virus particles. 5 This result supports the premise that RNA virus assembly is driven by free-energy minimization.

However, the assembly process itself and the conditions under which it leads to well-formed structures are not yet well understood. In MS2, most previous work on this question has focused on the role of specific interactions between coat protein and the viral RNA. Studies 6, 7 on R17, a virus closely related to MS2, have shown that the the overall yield of assembled VLPs decreases if the RNA does not contain a sequence called the translational operator that has a strong and specific affinity for coat protein. 8 Nonetheless, assembly proceeds in the absence of the operator, perhaps due to non-specific interactions between the coat protein with the RNA 6. Therefore, specific RNA-protein interactions might affect the assembly rate and yield but do not seem to be essential to the assembly process.
While these studies have established the relevance of RNA-protein interactions to the assembly process, they did not directly reveal the assembly pathway itself. More recent work involving interferometric scattering microscopy, a technique that can image individual VLPs as they form, shows that MS2 VLPs assemble by a nucleation-and-growth pathway 9 at near-neutral pH, salt concentrations on the order of 100 mM, and micromolar coat-protein concentrations. In this pathway, a critical nucleus of proteins must form on the RNA before the capsid can grow to completion. The size of the critical nucleus, estimated to be less than six coat-protein dimers, is associated with a free-energy barrier. Taken together with the previous experiments on the role of the RNA sequence 6, 7, these results show that MS2 assembly is a heterogeneous nucleation process, in which the nucleation rate is likely controlled by two factors: RNA-protein interactions and the coat-protein concentration.
The role of the protein concentration has been less well investigated than the role of the RNA-protein interactions. The interferometric scattering microscopy experiments 9 showed that very few VLPs are formed at low (1 M) concentration of MS2 coat-protein dimers, while well-formed capsids form at higher concentrations, and so-called “monster” particles, consisting of multiple partially formed capsids on a single strand of RNA, form at an even higher concentrations (several M). These results suggest that the nucleation barrier, which controls the nucleation rate, depends sensitively on the coat-protein concentration. At low concentration, the nucleation rate is too small for capsids to form within the experimental time frame; at high concentration, the nucleation rate is so high that multiple nuclei can form on a single RNA strand, resulting in monster particles. However, this study examined only a few protein concentrations, and the experiments were performed at low RNA concentration relative to protein.
Here we use bulk assembly experiments to determine the assembly products of MS2 coat protein and MS2 RNA as a function of coat-protein concentration. We characterize the assembly products using three techniques: gel electrophoresis, dynamic light scattering (DLS), and transmission electron microscopy (TEM). In comparison to the previous study,9 in which protein was in large excess relative to RNA, our study examines a much wider range of coat-protein concentrations, including ones near the stochiometric ratio of coat protein to RNA. Furthermore, the three-pronged experimental approach allows us to corroborate results and test hypotheses about how the assembly products form. Gel electrophoresis and TEM provide qualitative data that we use to determine the size and structure of the assembly products, and DLS provides quantitative information about their size distributions. With these methods, we show that as the coat-protein concentration increases, the morphologies transition from well-formed VLPs to monster particles to RNA-protein condensates consisting of large networks of RNA and protein. These results are summarized in Fig. 1 and discussed in more detail in Section 2. We explain these results with the aid of simulations of coarse-grained models of capsomers and RNA.
2 Results and Discussion

2.1 Overview of experimental approach
Briefly, our experimental procedure consists of combining 50 nM MS2 RNA with purified MS2 coat-protein dimers at concentrations ranging from 2.5 to 30 M (see Section 4 for full details). For reference, a full VLP has an icosahedral capsid with a triangulation number of 3 (), corresponding to 180 coat proteins or 90 coat-protein dimers. At 50 nM RNA concentration, a coat-protein dimer concentration of 5 M therefore corresponds approximately to the stoichiometric ratio of coat proteins to RNA in a full VLP. We work with dimer concentrations instead of monomer concentrations because MS2 coat proteins are thought to be dimerized in solution. 10 After mixing the RNA and coat protein, we then wait 10 min to allow assembly to occur. We chose this time scale to be much larger than the assembly time observed in previous experiments9 at low protein concentration. These experiments showed that at 2 M protein dimer concentration (lower than the lowest concentration in the current study, 2.5 M), capsids assembled in about 1–2 min. After 10 min, we add RNase to digest any excess MS2 RNA that is not encapsidated. We then characterize the resulting assembly products with gel electrophoresis, DLS, and TEM (see Section 4).
2.2 Results from gel electrophoresis
We first qualitatively characterize the size and composition of the assembly products using agarose gel electrophoresis. We use both ethidium stain to detect RNA and Coomassie stain to detect coat protein in our samples. For comparison, we also characterize wild-type MS2, MS2 RNA, and digested MS2 RNA (see Section 4).
The most striking feature of the gel is a band that runs at the same position as wild-type MS2 but with a brightness that increases from 2.5 to 7.5 M coat-protein dimers and then suddenly decreases at 8.7 M (see highlighted region in Fig. 2). We interpret this increase and sudden decrease as follows. Near the stoichiometric ratio (approximately 5 M dimers to 50 nM RNA), well-formed VLPs assemble, with more VLPs forming at higher protein concentration. Above 7.5 M, the sharp decrease in brightness indicates that far fewer well-formed MS2 VLPs assemble. Instead, as indicated by the spreading of the band toward to the upper part of the gel, the assembly products at dimer concentrations greater than 7.5 M are larger than the wild-type particles. These assembly products appear in both gels in Fig. 2, indicating that they contain both RNA and protein.
We also see that at coat-protein dimer concentrations higher than 7.5 M, the intensity of the diffuse band increases with increasing concentration (Fig. 2). The increase in brightness and change in the center position of this band suggest that the amount of large assembly products increases at the expense of the wild-type-sized products. At 15 M, the diffuse band no longer overlaps with the band corresponding to wild-type-size VLPs. For dimer concentrations beyond 15 M, some of the assembly products are so large that they are trapped near the top of the agarose gel.
The transition from a bright to a diffuse band might represent a transition from well-formed VLPs to either malformed structures or aggregates of capsids. The gels by themselves cannot confirm either hypothesis, since they reveal only that the assembly products all contain RNA and that they increase in size with increasing coat-protein concentration. We therefore turn to dynamic light scattering and transmission electron microscopy experiments, as described below.
2.3 Results from dynamic light scattering
To quantify the sizes of the assembly products, we use DLS with numerical inversion methods. These methods yield the size distributions of assembly products in both number and volume bases (see Section 4).
At coat-protein dimer concentrations 7.5 M and below, we observe in both the number and volume distribution a peak at or near the size of wild-type MS2 particles (see shaded bands in Fig. 3; we expect some variation in the location of this peak because the inversion of the autocorrelation function is sensitive to noise). This peak is accompanied by peaks at larger sizes, unlike the size distribution for wild-type MS2, which consists of only one peak. At coat-protein dimer concentrations above 7.5 M, the peak corresponding to the size of wild-type MS2 particles decreases until it disappears (in the volume-basis distributions) at 12.5 M. At concentrations of 15 and 20 M, we observe a single peak corresponding to much larger assembly products. Overall, we observe that the average size of the assembly products increases with increasing protein concentration (Fig. 3).
The DLS data support our interpretation of the gel-electrophoresis data. Specifically, both the DLS and gel data show that the proportion of VLPs with sizes corresponding to the wild-type size decreases with concentration above 7.5 M, whereas only larger products form at high concentration. The DLS data additionally show that the size of these larger products is on the order of several hundred nanometers.
However, the DLS data also show peaks corresponding to particles larger than wild-type at concentrations less than 10 M. We do not see evidence of such particles in the gel data. These peaks may correspond to weakly-bound clusters of well-formed MS2 VLPs that are observable in the DLS experiments but fall apart during gel electrophoresis (see Fig. 2). Because DLS does not provide any structural information, we turn to TEM to characterize the structures of the assembly products.
2.4 Transmission electron microscopy (TEM) experiments

TEM images of negatively stained samples show that most of the assembly products at dimer concentrations 7.5 M and below are well-formed MS2 VLPs (Figs. 4 and S1), with some malformed VLPs and clusters of MS2 VLPs, consistent with the larger sizes present in the DLS-derived size distributions. At a concentration of 10 M, we observe malformed particles that consist of partially formed capsids. These structures are similar to the so-called “monster” particles observed in turnip-crinkle-virus assemblies 11 and, more recently, in MS2 assembly experiments. 9 At concentrations above 15 M we observe what appear to be large aggregates of partially formed capsids (Figs. 4 and S1). These structures are micrometer-sized, comparable to the sizes seen in the DLS distributions (Fig. 3).
2.5 Discussion of experimental results
Our measurements show that coat-protein concentration plays an important role in the morphology of the assembly products of MS2 RNA and coat protein. At low coat-protein dimer concentrations (less than 7.5 M), gel electrophoresis, DLS, and TEM all point to the formation of MS2 VLPs that are of the same size as wild-type MS2. These structures appear to be well-formed, consistent with previous studies. 5 At higher concentrations (between 7.5 and 10 M), we observe monster particles consisting of a few partial capsids and RNA. While we cannot determine from the data whether the monster particles form around a single or multiple strand of RNA, the monster particles have been observed in previous experiments on MS2 assembly,9 and interferometric scattering measurements indirectly show that they can grow around a single RNA strand. At an even higher concentration (12.5 M), results from gel electrophoresis, DLS, and TEM point to the formation of large structures several hundred nanometers in size and containing many partial capsids and RNA.
Whereas the observation of well-formed VLPs and even monsters is consistent with previous studies on MS2, the observation of large structures at high protein concentrations has not, to our knowledge, been studied in detail. Large structures have been observed in the assembly of viral coat proteins around functionalized gold nanoparticles, but these structures are found at low protein concentrations. 12 In other viruses, large aggregates have been observed under conditions of strong interactions. 13, 14 Here, however, the formation of the large structures occurs at the same buffer conditions (apart from coat-protein concentration) as those used to assemble well-formed VLPs.
The large structures are interesting not only because they contain many partially formed capsids, but also because they contain RNA, as shown by our gel electrophoresis measurements. We term these structures “condensates” because, like other biological structures that bear this name,15, 16 they are self-organized and contain both RNA and protein.
The formation of the condensates points to a more complex pathway than the one that appears to be operative at lower protein concentrations. The well-formed VLPs at low concentrations and monster particles at intermediate concentrations can be explained in terms of a nucleated pathway 9 in which the nucleation rate increases with protein concentration. The monster particles, which consist of multiple partial capsids, can form when more than one nucleation event happens on a single RNA strand; indeed, we expect that the probability of multiple nucleation events should increase with the protein concentration. However, the size of the condensates (and their fluorescence in the gel assays under RNA staining) suggests that they contain multiple RNA molecules. It is not immediately obvious how a high nucleation rate could lead to multiple RNA molecules becoming trapped between partial capsids.
One hypothesis is that condensate formation is driven primarily by aggregation of coat proteins. If the aggregation of the coat proteins were rapid, it is possible that the RNA molecules could be trapped inside the aggregate. However, gel electrophoresis, DLS, and TEM experiments show no evidence of coat-protein aggregation in the absence of RNA, even at 15 M dimer concentration.

2.6 Coarse-grained modeling
We turn to coarse-grained modeling to gain insight into the potential pathways. In the simulations, we model the capsomers as patchy hard disks and the RNA as a polymer with a length of approximately 14 times the diameter of a fully formed capsid (see Fig. 5 and Section 4), such that each polymer can be encapsidated by 12 capsomers. In contrast to previous coarse-grained simulations that focused on capsomer assembly around a single polymer17, 18, 19 – or, at most, a few polymers20 – our simulations include larger numbers of polymers (10 to 30 within the volume of the simulated system) and therefore allow for the possibility of condensate formation. Nonetheless, the simulated system is simplified from the experimental system in several ways: whereas an MS2 VLP consists of 90 coat-protein dimers, yielding a structure, a complete capsid in the simulation consists of 12 pentamers; whereas MS2 can adopt intricate secondary and tertiary structures, the simulated polymer does not; whereas the MS2 protein subunits are not rigid bodies but instead can stretch, which may help promote assembly,21, 22 we ignore this elastic-energy contribution in our simulation. We choose to simplify these features so that the simulation can give insight into the simplest potential pathways leading to condensate-like structures.
We perform two sets of initial simulations in which the strength of capsomer-polymer interactions is tuned so that, in one set, capsids nucleate and grow at low capsomer concentrations, and, in the other set, capsids assemble “en masse.”17 In the en-masse pathway, many capsomers first bind to the polymer in a disordered arrangement and then form a capsid. In both cases, the simulated system contains 10 polymers. At low capsomer concentrations, both sets of simulations show the assembly of well-formed capsids containing the polymer, as expected (Fig. 5A and B). But at high capsomer concentrations, we observe differences. Whereas the system that follows an en-masse pathway at low concentrations still forms capsids at higher concentrations (Fig. 5C), the system that follows nucleation and growth at low concentrations assembles into large networks of polymers and partial capsids (Fig. 5D), resembling the condensates seen in the experiments. To ensure that the formation of the condensates is not an artifact of the finite size of the system, we perform additional simulations in the nucleated regime with 30 polymers and find the same result. These simulations show that the formation of condensate-like structures does not require strong protein-RNA interactions; that is, condensate-like structures can occur under interactions that, at lower protein concentrations, lead to the nucleation and growth of full capsids.
To support these visual observations, we calculate the distribution of the average size of the clusters containing both polymers and capsomers over a fixed number of configurations in each of the simulations (Fig. S3). These distributions qualitatively resemble those obtained by DLS (Fig. 3). Specifically, we find that both sets of simulations have a single peak centered at a cluster size of 12 for low capsomer:polymer ratios, corresponding to the formation of complete and dispersed capsids. Both sets of simulations also show a peak centered at a cluster size of 20–30, corresponding to the formation of monster particles. However, at high capsomer:polymer ratios we see that the average cluster size is approximately 20 for the system that followed an en-masse pathway at lower concentrations, reflecting the formation of only dispersed capsids and monsters, with no condensate-like structures. By contrast, we observe a broad peak representing cluster sizes of hundreds for the system that followed nucleation-and-growth at lower concentrations, reflecting the formation of polymer-capsomer condensates.
To obtain insights into the formation of condensates, we perform additional simulations with polymer chains that are 33% shorter. We work with the same system that shows nucleation and growth at low concentrations and condensate formation at higher concentrations with the standard-length polymer. With the shorter polymer, we find that the condensates no longer form. Instead, discrete capsids and monsters now assemble instead (Fig. S4). However, for both polymer lengths, we observe that the capsomers first bind to the RNA, and then form partial or full capsids (see shaded subpanels in Figs. 5 and S4). The observed assembly trajectories appear to follow an en-masse pathway – and indeed, with short polymers, we directly see an en-masse-type assembly (blue subpanel in Fig. S4). In contrast to an en-masse pathway that occurs at low capsomer concentrations, here the adsorption of the capsomers to the polymer is not driven by strong capsomer-polymer interactions but instead by the abundance of capsomers. For the standard-length polymers, however, this assembly pathway leads to condensate-like structures, whereas for shorter polymers it leads to dispersed capsids or monsters.
The simulations show that the large networks observed for the standard-length polymers consist of multiple polymer strands (see bottom shaded subpanel in Fig. 5). There are several ways in which multiple polymers can become trapped in the same large structure: a capsid might assemble around two polymer strands, or capsomers might connect together or bridge partial capsids on two separate polymers, for example. We expect the chances of both of these events occuring to increase with the size of the polymer, since the distance between segments on two different polymer chains should decrease with the polymer size. These and similar mechanisms may explain why we observe the condensate-like structures form for the standard-length polymers but not the shortened ones.
We note also that although we expect the nucleation barrier to become smaller as the capsomer concentration increases, the formation of capsids still occurs heterogeneously; that is, we do not observe the formation of empty capsids. In a typical phase separation, the disappearance of the nucleation barrier is associated with spinodal decomposition, which can also lead to the formation of extended structures23. Here, however, the heterogeneous nature of condensate formation suggests a pathway different from spinodal decomposition, since capsomers must first adsorb to the polymer before capsids can form. The absence of condensates from simulations for shorter polymers also points to the importance of capsomer-polymer associations in the pathway.
3 Conclusions
Our experiments and simulations show that when a nucleation-and-growth pathway for capsid assembly is operative at low protein concentrations, monster particles and RNA-protein condensates can form at higher concentrations. The formation of the monster particles can be explained by the increase in nucleation rate with increasing protein concentration. When the timescale of nucleation is short compared to the time for a nucleus to grow into a full capsid, multiple nuclei can form on the same RNA strand. When these nuclei grow, they tend to form partial capsids because other partial capsids on the same RNA can block their growth.
The condensates, however, appear to arise from a more complex pathway. The pathway suggested by simulations involves proteins first attaching to the RNA, then starting to assemble. At the high protein concentrations that lead to condensate formation, proteins can bridge together capsids that are growing on different RNA strands; also, capsids may assemble around portions of two different RNA molecules. These and related mechanisms would explain how, as seen in our experimental results, the condensates grow so large and why they contain multiple RNA strands and many partial capsids. Other hypotheses, such as coat-protein aggregation or spinodal decomposition, do not account for all of our results.
There remain a few questions to be resolved in future studies. One question is how the RNA is spatially distributed in the condensates, and whether the mechanisms by which multiple RNA strands become trapped in the condensate, as observed in the simulations, are operative in the experiments. Another question is what happens at concentrations between those at which well-formed capsids form and monster particles form. At these concentrations, DLS measurements show evidence for some structures that are larger than single capsids. Because TEM data show that most structures at these concentrations are not malformed, one possibility is that the DLS measurements are detecting small clusters of well-formed capsids. The driving force for the formation of these clusters is not clear, but they might arise when a single RNA molecule spawns multiple nuclei that each form a full (or nearly full) capsid. In this situation, the RNA would connect the capsids into a “multiplet” structure. 13 It is still not clear why the gel measurements do not show evidence for such structures, however. Fluorescent microscopy experiments could help resolve this question and the aforementioned ones as well.
Our work might also inform models of the assembly pathway, particularly those based on the law of mass action, 24, 25, 26, 27, 28 in which the concentration of coat proteins plays a critical role. Further experiments that quantify how the nucleation rate depends on the coat-protein concentration would help connect these models to the morphological observations we present here. From a more practical perspective, our work helps establish constraints on concentration for the production of MS2 VLPs. Such VLPs are used to encapsulate materials for drug delivery 29, 30, 31 and to display epitopes for vaccines. 32, 33
4 Methods and Materials
All materials were used as received. Buffers were prepared as follows:
- •
Assembly buffer: 42 mM Tris, pH 7.5; 84 mM NaCl; 3 mM acetic acid, 1 mM EDTA
- •
TNE buffer: 50 mM Tris, pH 7.5; 100 mM NaCl, 1 mM EDTA
- •
TE buffer: 10 mM Tris, pH 7.5; 1 mM EDTA
- •
TAE buffer: 40 mM Tris-acetic acid, pH 8.3; 1 mM EDTA
4.1 Virus growth, cultivation, and storage
We purify wild-type bacteriophage MS2 as described by Strauss and Sinsheimer. 34 In brief, we grow MS2 virus particles by infecting E. coli strain C3000 in minimal LB Buffer, and we remove E. coli cell debris by centrifugation at 16700 for 30 min. We then use chloroform (warning: hazardous; use in fume hood) extraction to purify the solute containing the virus. We extract the purified virus particles by density gradient centrifugation in a cesium chloride gradient. We store the purified virus at 4 °C at a concentration of 1011 plaque-forming units (pfu) in Tris-NaCL-EDTA or TNE buffer (50 mM Tris, 100 mM NaCL, 5 mM EDTA) at pH 7.5. We determine the concentration of virus by UV-spectrophotometry (NanoDrop 1000, Thermo Scientific) using an extinction coefficient of 8.03 mL/mg at 260 nm.
4.2 Coat-protein purification and storage
We purify MS2 coat-protein dimers following the method of Sugiyama, Herbert, and Hartmant. 5 Wild-type bacteriophage MS2 is suspended in glacial acetic acid (warning: hazardous; use in fume hood with appropriate personal protective equipment) for 30 min to denature the capsid, separate it into protein dimers, and precipitate the RNA. We then centrifuge the sample at 10000 and collect the supernatant, which contains coat-protein dimers. We filter out the glacial acetic acid with 20 mM acetic acid buffer through 3-kDa-MWCO sterile centrifugal filters (Millipore Sigma, UFC500324) five times. This process removes the glacial acetic acid to prevent further denaturing of the coat-protein dimers. We then determine the concentration of our coat-protein dimers by measuring the absorbance with the Nanodrop Spectrophotometer (Thermo Fisher) at 280 nm. We store the MS2 coat protein at 4 °C in a 20 mM acetic acid buffer. We measure the absorbance at 260 nm to detect residual RNA. In our experiments, we use only purified protein with an absorbance ratio (protein:RNA) above 1.5 to avoid RNA contamination.
4.3 RNA purification and storage
We purify wild-type MS2 RNA using a protocol involving a Qiagen RNeasy Purification Kit Mini (Qiagen, 7400450). We take 100 L of MS2 stored in TNE buffer and mix with 350 L of buffer RLT (a lysis buffer) to remove the coat-protein shell. We add 250 L of ethanol to our sample and mix to precipitate the RNA. We then transfer our sample to a 2 mL RNeasy Mini spin column (provided by the Qiagen Purification Kit) that is placed in a collection tube. We then centrifuge at 10000 for 15 s and discard the flow-through. We add 500 L of buffer RPE (to remove traces of salts) to the spin column and centrifuge for 15 s at 10000. We discard the flow-through. We then add 500 L of buffer RPE once more to the spin column and centrifuge for 2 min at 10000. We place the spin column upside down into in a fresh 1.5 mL collection tube (provided in the purification kit) to collect the RNA trapped in the spin column. We add 50 L of TE buffer to the spin column and centrifuge at 10000 for 1 min to collect the RNA. We measure the RNA concentration using a Nanodrop spectrophotometer by measuring the absorbance at 260 nm and using an extinction coefficient of 25.1 mL/mg. We store the purified MS2 RNA at -80°C in Tris-EDTA (TE) buffer at neutral pH (7.5).
4.4 RNA and coat-protein bulk assembly experiments
For assembly experiments, we mix wild-type MS2 RNA genome at a concentration of 50 nM with varying concentrations of MS2 coat-protein dimers ranging from 2.5 M to 30 M. We leave the mixtures at room temperature (21 °C) for 10 min. Afterward, we add 10 ng of RNase A to the sample and wait 30 min. We then characterize the assembled virus-like particles using gel electrophoresis, dynamic light scattering (DLS), and transmission electron microscopy (TEM).
4.5 Gel electrophoresis and analysis
For gel electrophoresis experiments, we mix 15 L of sample with 4 L of glycerol and load into a 1% agarose gel in assembly buffer consisting of 5 parts Tris-NaCL-EDTA (TNE) buffer (50 mM Tris, 100 mM NaCl, 10 mM EDTA, pH 7.5) to 1 part 20 mM acetic acid buffer. We use Ethidium Bromide (EtBr; warning: hazardous; use in fume hood with appropriate personal protective equipment) to stain the RNA and to detect the presence of MS2 RNA. We use Coomassie Blue R-250 to detect the presence of MS2 coat protein. The combination of these staining methods allow us to confirm the presence of both MS2 RNA and MS2 coat protein within the resulting assemblies. We place three control samples in lanes 2 through 4 that include MS2 RNA at 50 nM concentration (lane 2), wild-type MS2 at 50 nM concentration (lane 3), and 50 nM concentration of digested MS2 RNA genome (lane 4) resulting from the addition of RNase A. These controls allow us to compare the sizes of our assembly products to systems of known sizes. We can also determine whether the samples consist of MS2 VLPs formed during assembly or excess strands of MS2 RNA. We place our assembly products in lanes 6 through 19. These samples are loaded and run at 21 °C at 100 V for 40 min and visualized using a Biosystems UV Imager (Azure, AZ1280).
4.6 Dynamic light scattering (DLS) and analysis
We use dynamic light scattering (Malvern ZetaSizer Nano ZS by Malvern Panalytical) to determine the size distribution of particles that assemble at 50 nM MS2 RNA concentration and coat-protein dimer concentrations of 2.5, 5, 7.5, 10, 12.5, 15, and 20 M. In each case the samples are treated with RNase as described previously. We also characterize the wild-type virus for comparison. We determine the size distributions using the regularization inversion method provided by the instrument software. 35
4.7 Transmission electron microscopy (TEM) and analysis
For transmission electron microscopy, we negatively stain samples that have been assembled in bulk at coat-protein dimer concentrations of 5, 7.5, 10, 15, and 20 M and treated with RNase A. We stain with 2% aqueous uranyl acetate (warning: hazardous; use with appropriate personal protective equipment) on 200 mesh carbon-coated copper TEM grids (Polyscience, TEM-FCF200CU), then image with a Hitachi 7800 TEM located at the Center for Nanoscale Systems at the Science and Engineering Complex (CNS-SEC) at Harvard University. Images are taken at 20, 50, and 100 kV.
As a control, we mix 15 M MS2 coat-protein dimers in assembly buffer. This control is done to ensure that capsid-like or VLP-like structures do not form in the absence of MS2 RNA.
4.8 Coarse-grained model for capsid assembly
We developed a patchy particle model for the capsomers interacting with a polymer chain, which was used to model the RNA, to investigate their assembly. A capsid is constructed from 12 subunits, each having symmetry, where the center of each subunit sits on the vertex of an icosahedron.36, 37, 38, 19
4.8.1 Capsomer-Capsomer Interactions.
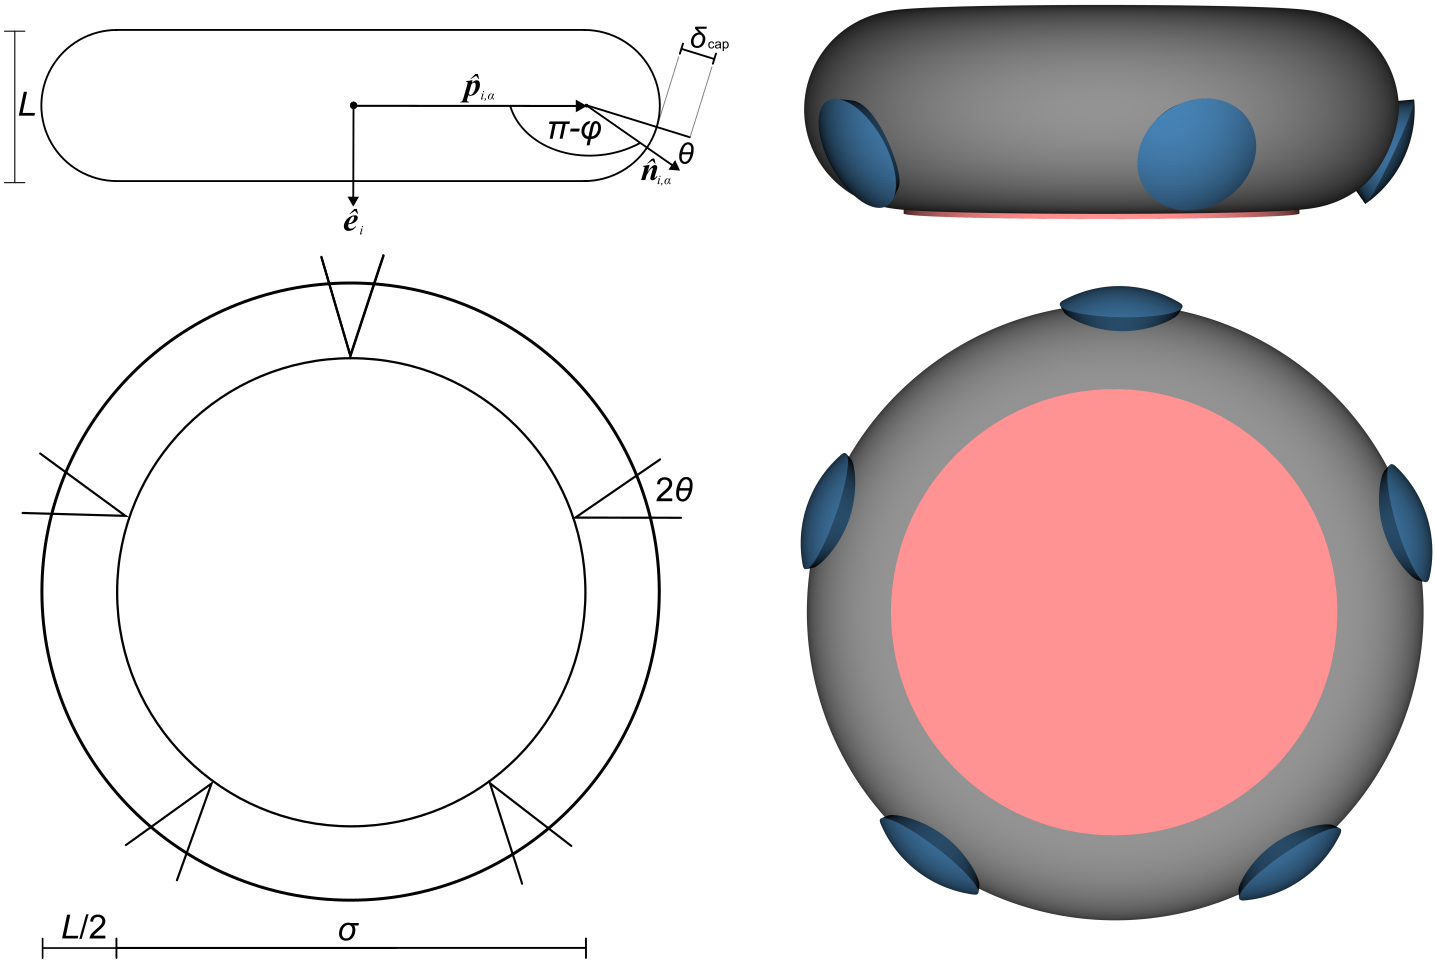
We coarse-grain the capsomeric building blocks as oblate hard spherocylinders (OHSCs) decorated with five identical circular patches conforming to symmetry. See Fig. S2 for a schematic illustration of the model capsomer. For hard oblate spherocylinders, which were previously used as a model system to investigate the phase behavior of discotic liquid crystals, 39 the surface is defined by the points at a distance from an infinitely thin disc of diameter , giving the particle a total diameter and thickness . Note that an OHSC particle, comprising a flat cylindrical core and a toroidal rim, has a uniaxial symmetry, and its orientation can be described by a unit vector normal to the central disc, . The aspect ratio of the OHSC particle is then given by . The pair interaction between two OHSC particles and , with respective positions of the center of mass and and orientations and , is infinite if the shortest distance between their central discs is less than , and zero otherwise:
| (1) |
where and is the shortest distance between the central discs for particles and . We compute this shortest distance using the algorithm outlined in Ref. 39.
We model the interactions between the circular patches by adapting the Kern-Frenkel potential, 40 where the interactions between a pair of circular patches are described by a square-well attraction modulated by an angular factor corresponding to the relative orientations between the patches. The angular factor is unity only when the patches are oriented such that the vector connecting the centers of the two particles passes through both the patches on their surfaces, and zero otherwise. The width of the square well, , determines the range of the attraction between the patches relative to the particle diameter. The depth of the square well, , governs the strength of the attractions. The size of the patches is characterized by a half-angle . An additional parameter defines the inclination of the plane that contains the centers of the patches to the plane of the central cylindrical core.
The total pair potential defining capsomer-capsomer interactions is then
| (2) |
where is the center-to-center distance between particles and , is a unit vector defining the orientation of patch on particle (similarly, is a unit vector corresponding to patch on particle ), and is the separation vector between the centers of patches and .
The term is a square-well potential:
| (3) |
and is the angular modulation factor,
| (4) |
The reference orientation of particle is such that the normal to the flat face of the oblate spherocylinder is aligned with the -axis of the global coordinate frame. We then define the reference position of the first patch on particle as and the position of each other patch as a rotation about the -axis of the local coordinate frame of the particle such that , where is a rotation matrix defining a clockwise rotation of angle about with . The orientation of patch on particle is then , where is the angle between and the plane containing the flat face of the oblate spherocylinder.
4.8.2 Polymer-Polymer Interactions.
Each RNA molecule is modeled as a flexible self-avoiding polymer – that is, as a chain of hard-spheres, where neighboring beads in the chain are connected by a harmonic spring: 17, 41, 42
| (5) |
where is the distance between beads and (where ), sets the strength of the harmonic spring, is the hard-sphere diameter of the beads in the polymer chain, and is a dimensionless parameter setting the equilibrium bond length between neighboring beads.
4.8.3 Capsomer-Polymer Interactions.
We allow for interaction between the capsomers and the polymer via an attractive patch on the surface of the capsomer. The orientation of the patch is aligned with that of the oblate spherocylinder. The beads of the polymer and the capsomer then interact via an attractive square-well interaction, plus a hard-core repulsion between their respective cores. The pair interaction when particle is a capsomer and particle is a bead of a polymer chain is
| (6) |
where is the hard-core interaction
| (7) |
where is the shortest distance between the capsomer and polymer bead. We compute this distance by first computing the projection of the polymer bead onto the plane spanned by the cylindrical core of the capsomer: . Then if , the bead lies over the cylindrical core of the capsomer, so the shortest distance vector between the two particles is . Otherwise, the closest point of the capsomer to the bead lies on its edge. The shortest distance vector between the two particles is then .
The term is the square-well interaction between the patch on the face of the capsomer and the polymer bead:
| (8) |
and is the angular modulation factor for the attractive capsomer-polymer interaction:
| (9) |
4.9 Monte Carlo simulations
We carry out two sets of Monte Carlo simulations in the NVT ensemble using the model outlined above. For the simulations presented in Fig. 5 we set the volume to be and the number of polymer chains , with each polymer chain consisting of beads. For simulations with low capsomer concentration there are capsomers, for medium concentration there are capsomers, and for high concentration there are capsomers. For the larger simulations containing polymer chains, we set the volume to be , with each polymer chain consisting of beads. For simulations with low capsomer concentration simulation there are capsomers, and in the other simulation there are capsomers.
We set parameters as follows. We take to be the unit of length and to be the unit of energy. We then choose the parameters defining the system to be , , , , , , , and . For simulations in which capsids nucleate and grow at low capsomer concentrations we set and the reduced temperature (where is the Boltzmann constant, which is taken to be equal to one), while for simulations in which capsids assemble en masse at low capsomer concentrations we set and . We choose the geometry of the patches on the capsomers to ensure that the particles can stabilize a capsid-like structure in which 12 subunits are fully connected and sit on the vertices of an icosahedron. The choice of the aspect ratio of the OHSC particles ensures that the cavity of a properly formed capsid can accommodate cargo of a reasonable size. In turn, the length of each polymer chain is chosen to be as long as possible with the constraint that it still fit inside a capsid made of 12 capsomers.
We carry out all Monte Carlo simulations with systems contained in a cubic box under periodic boundary conditions, using the minimum image convention. Each capsomer is treated as a rigid body for which the orientational degrees of freedom are represented by quaternions. The potential energy is calculated using a spherical cutoff of , and a cell list is used for efficiency. Each Monte Carlo cycle consists of translational or rotational single-particle or cluster moves, chosen at random with equal probabilities.
Author contributions
All authors conceived the research goals and aims. LAW and AN curated data and code. LAW and AN analyzed the results, with assistance from VNM and DC. RFG, DC, and VNM obtained funding. LAW performed the experiments and AN performed the simulations. All authors developed methods. RFG, DC, and VNM administered the project. AN developed the computer software for the simulations. RFG, DC, and VNM supervised the project. LAW and AN performed validation studies. LAW and AN prepared visualizations, edited by VNM. LAW, AN, and VNM prepared the original draft. All authors reviewed and edited the submitted work.
Conflicts of interest
There are no conflicts to declare.
Data availability statement
Experimental data are freely available at the Harvard Dataverse 43. Simulation code and results are available at the UBIRA eData repository.
Acknowledgements
We thank Amy Barker and Peter Stockley at the University of Leeds for initial stocks of MS2 and E. coli cells. We thank Tim Chiang, Amelia Paine, Aaron Goldfain, and Danai Montalvan for helpful scientific discussions. This research was partially supported by a National Science Foundation (NSF) Graduate Research Fellowship under grant number DGE-1745303, by NSF through the Harvard University Materials Research Science and Engineering Center under NSF grant number DMR-2011754, by the National Institute of General Medical Sciences of the National Institutes of Health under grant numbers K99GM127751 and R00GM127751, by the NSF-Simons Center for Mathematical and Statistical Analysis of Biology at Harvard University under NSF grant number 1764269, and by the Harvard Quantitative Biology Initiative. AN, VNM, and DC gratefully acknowledge support from the Institute of Advanced Studies of the University of Birmingham and the Turing Scheme. This work was performed in part at the Harvard University Center for Nanoscale Systems (CNS), a member of the National Nanotechnology Coordinated Infrastructure Network (NNCI), which is supported by the National Science Foundation under NSF grant number ECCS-2025158. The work was also performed in part at the Harvard University Bauer Core Facility. Any opinion, findings, and conclusions or recommendations expressed in this material are those of the authors and do not necessarily reflect the views of the National Science Foundation.
References
- Caspar and Klug 1962 D. L. Caspar and A. Klug, Cold Spring Harbor Symposia on Quantitative Biology, 1962, pp. 1–24.
- Fraenkel-Conrat and Williams 1955 H. Fraenkel-Conrat and R. C. Williams, Proceedings of the National Academy of Sciences, 1955, 41, 690–698.
- Bancroft and Hiebert 1967 J. B. Bancroft and E. Hiebert, Virology, 1967, 32, 354–356.
- Hiebert et al. 1968 E. Hiebert, J. Bancroft and C. Bracker, Virology, 1968, 34, 492–508.
- Sugiyama et al. 1967 T. Sugiyama, R. Hebert and K. Hartman, Journal of Molecular Biology, 1967, 25, 455–463.
- Beckett et al. 1988 D. Beckett, H.-N. Wu and O. C. Uhlenbeck, Journal of Molecular Biology, 1988, 204, 939–947.
- Peabody 1993 D. S. Peabody, The EMBO Journal, 1993, 12, 595–600.
- Johansson et al. 1997 H. E. Johansson, L. Liljas and O. C. Uhlenbeck, Seminars in Virology, 1997, 8, 176–185.
- Garmann et al. 2019 R. F. Garmann, A. M. Goldfain and V. N. Manoharan, Proceedings of the National Academy of Sciences, 2019, 116, 22485–22490.
- Lalwani Prakash and Gosavi 2021 D. Lalwani Prakash and S. Gosavi, The Journal of Physical Chemistry B, 2021, 125, 8722–8732.
- Sorger et al. 1986 P. Sorger, P. Stockley and S. Harrison, Journal of Molecular Biology, 1986, 191, 639–658.
- Malyutin and Dragnea 2013 A. G. Malyutin and B. Dragnea, The Journal of Physical Chemistry B, 2013, 117, 10730–10736.
- Garmann et al. 2014 R. F. Garmann, M. Comas-Garcia, A. Gopal, C. M. Knobler and W. M. Gelbart, Journal of Molecular Biology, 2014, 426, 1050–1060.
- Garmann et al. 2016 R. F. Garmann, M. Comas-Garcia, C. M. Knobler and W. M. Gelbart, Accounts of Chemical Research, 2016, 49, 48–55.
- Alshareedah et al. 2019 I. Alshareedah, T. Kaur, J. Ngo, H. Seppala, L.-A. D. Kounatse, W. Wang, M. M. Moosa and P. R. Banerjee, Journal of the American Chemical Society, 2019, 141, 14593–14602.
- Guillén-Boixet et al. 2020 J. Guillén-Boixet, A. Kopach, A. S. Holehouse, S. Wittmann, M. Jahnel, R. Schlüßler, K. Kim, I. R. E. A. Trussina, J. Wang, D. Mateju, I. Poser, S. Maharana, M. Ruer-Gruß, D. Richter, X. Zhang, Y.-T. Chang, J. Guck, A. Honigmann, J. Mahamid, A. A. Hyman, R. V. Pappu, S. Alberti and T. M. Franzmann, Cell, 2020, 181, 346–361.e17.
- Elrad and Hagan 2010 O. M. Elrad and M. F. Hagan, Physical Biology, 2010, 7, 045003.
- Perlmutter et al. 2013 J. D. Perlmutter, C. Qiao and M. F. Hagan, eLife, 2013, 2, e00632.
- Perlmutter et al. 2014 J. D. Perlmutter, M. R. Perkett and M. F. Hagan, Journal of Molecular Biology, 2014, 426, 3148–3165.
- Zhang and Linse 2014 R. Zhang and P. Linse, The Journal of Chemical Physics, 2014, 140, 244903.
- Panahandeh et al. 2018 S. Panahandeh, S. Li and R. Zandi, Nanoscale, 2018, 10, 22802–22809.
- Panahandeh et al. 2020 S. Panahandeh, S. Li, L. Marichal, R. Leite Rubim, G. Tresset and R. Zandi, ACS Nano, 2020, 14, 3170–3180.
- Lu et al. 2008 P. J. Lu, E. Zaccarelli, F. Ciulla, A. B. Schofield, F. Sciortino and D. A. Weitz, Nature, 2008, 453, 499–503.
- Zlotnick 1994 A. Zlotnick, Journal of Molecular Biology, 1994, 241, 59–67.
- Zandi et al. 2006 R. Zandi, P. van der Schoot, D. Reguera, W. Kegel and H. Reiss, Biophysical Journal, 2006, 90, 1939–1948.
- Morozov et al. 2009 A. Y. Morozov, R. F. Bruinsma and J. Rudnick, Journal of Chemical Physics, 2009, 131, 155101.
- Zandi and van der Schoot 2009 R. Zandi and P. van der Schoot, Biophysical Journal, 2009, 96, 9–20.
- van der Holst et al. 2018 B. van der Holst, W. K. Kegel, R. Zandi and P. van der Schoot, Journal of Biological Physics, 2018, 44, 163–179.
- Kovacs et al. 2007 E. W. Kovacs, J. M. Hooker, D. W. Romanini, P. G. Holder, K. E. Berry and M. B. Francis, Bioconjugate Chemistry, 2007, 18, 1140–1147.
- Galaway and Stockley 2013 F. A. Galaway and P. G. Stockley, Molecular Pharmaceutics, 2013, 10, 59–68.
- Hartman et al. 2018 E. C. Hartman, C. M. Jakobson, A. H. Favor, M. J. Lobba, E. Álvarez-Benedicto, M. B. Francis and D. Tullman-Ercek, Nature Communications, 2018, 9, 1385.
- Peabody et al. 2021 D. S. Peabody, J. Peabody, S. B. Bradfute and B. Chackerian, Pharmaceuticals, 2021, 14, 764.
- Peabody et al. 2008 D. S. Peabody, B. Manifold-Wheeler, A. Medford, S. K. Jordan, J. do Carmo Caldeira and B. Chackerian, Journal of Molecular Biology, 2008, 380, 252–263.
- Strauss Jr. and Sinsheimer 1963 J. H. Strauss Jr. and R. L. Sinsheimer, Journal of Molecular Biology, 1963, 7, 43–54.
- Malvern Instruments 2013 Malvern Instruments, Zetasizer Nano Series User Manual, Malvern Instruments Ltd., Enigma Business Park, Grovewood Road, Malvern, Worcestershire WR14 1XZ, United Kingdom, 2013.
- Wales 2005 D. J. Wales, Philosophical Transactions of the Royal Society A: Mathematical, Physical and Engineering Sciences, 2005, 363, 357–377.
- Fejer et al. 2009 S. N. Fejer, T. R. James, J. Hernandez-Rojas and D. J. Wales, Physical Chemistry Chemical Physics, 2009, 11, 2098–2104.
- Johnston et al. 2010 I. G. Johnston, A. A. Louis and J. P. Doye, Journal of Physics: Condensed Matter, 2010, 22, 104101.
- Cuetos and Martínez-Haya 2008 A. Cuetos and B. Martínez-Haya, The Journal of Chemical Physics, 2008, 129, 214706.
- Kern and Frenkel 2003 N. Kern and D. Frenkel, Journal of Chemical Physics, 2003, 118, 9882–9889.
- Kampmann et al. 2015 T. A. Kampmann, H.-H. Boltz and J. Kierfeld, The Journal of Chemical Physics, 2015, 143, 044105.
- Joseph et al. 2021 J. A. Joseph, J. R. Espinosa, I. Sanchez-Burgos, A. Garaizar, D. Frenkel and R. Collepardo-Guevara, Biophysical Journal, 2021, 120, 1219–1230.
- Williams et al. 2023 L. A. Williams, A. Neophytou, R. F. Garmann, D. Chakrabarti and V. Manoharan, Data for “Effect of coat-protein concentration on the self-assembly of bacteriophage MS2 capsids around RNA”, Harvard Dataverse, V1, 2023, https://doi.org/10.7910/DVN/8A2HWD.
Supplementary Information for
Effect of coat-protein concentration on the self-assembly of bacteriophage MS2 capsids around RNA
LaNell A. Williams,a
Andreas Neophytou,b
Rees F. Garmann,c,d,e
Dwaipayan Chakrabarti,b
Vinothan N. Manoharan,∗c,a