Quantitative Analysis of Cultural Dynamics Seen from an Event-based Social NetworkDOI: XXXXXXX.XXXXXXXJournal: JACMVolume: 3741118CCS: Social and professional topics Cultural characteristicsCCS: Applied computing Law, social and behavioral sciencesCCS: Human-centered computing Empirical studies in collaborative and social computing
Abstract.
Culture is a collection of connected and potentially interactive patterns that characterize a social group or a passed-on idea that people acquire as members of society. While offline activities can provide a better picture of the geographical association of cultural traits than online activities, gathering such data on a large scale has been challenging. Here, we use multi-decade longitudinal records of cultural events from Meetup.com, the largest event-based social networking service, to examine the landscape of offline cultural events. We analyze the temporal and categorical event dynamics driven by cultural diversity using over 2 million event logs collected over 17 years in 90 countries. Our results show that the national economic status explains 44.6 percent of the variance in total event count, while cultural characteristics such as individualism and long-term orientation explain 32.8 percent of the variance in topic categories. Furthermore, our analysis using hierarchical clustering reveals cultural proximity between the topics of socio-cultural activities (e.g., politics, leisure, health, technology). We expect that this work provides a landscape of social and cultural activities across the world, which allows us to better understand their dynamical patterns as well as their associations with cultural characteristics.
Keywords:
Event-based social networks, cultural differences, event dynamics, quantitative analysis.1. Introduction
Social events are spatial-temporal phenomena, where each event has its own unique characteristics of interactions among the participants, topic, description, and geographic region. In particular, a live social event on a certain topic facilitates a unique offline human interaction, as they serve the special purpose of social gathering (Getz 2008). The expectations, emotions, and attitudes of participants evolve, resulting in a unique human experience, even when events are held on the same topic. Because of such a one-of-a-kind experience, offline live events are appealing, even fascinating, and the organizer’s objective is to cultivate a ’once in a lifetime’ image for them (Fenich 2013; Getz and Page 2019). Furthermore, virtual events, which are conveyed via various social media platforms, provide something of interest and value to people and the tourism industry; they are different types of event experiences (Rojek et al. 1997; Rogers et al. 2014).
Live events are frequently used to disseminate information. One of the most important characteristics of globalization in the twenty-first century is the adoption of different ideas, interests, beliefs, and lifestyles across cultural boundaries (Boli and Lechner 2015; Choudhary et al. 2019; Frigo 2017). Small-scale ethnographic studies can capture local examples of these processes in specific moments. In contrast, computational analysis of social network services, blogs, or websites can provide a global landscape, albeit at the risk of overestimating the impact of globalization (Manovich 2020; Can and Alatas 2019; Hamidi et al. 2011).
This research employs a novel method for studying cultural globalization by using longitudinal data from millions of offline events scheduled through Meetup.com. This platform allows users to communicate virtually with others and meet in person to discuss whatever and wherever they are interested in (Liu et al. 2012). The existence of a physical event on a particular topic in a specific location implies that enough people in the area are interested in the topic. The geographic binding of events is perhaps the most critical difference between offline events like those hosted on Meetup and other online communities, which do not restrict who can join and thus give the impression that all ideas are present everywhere. As a result, we assume that offline events, rather than their online counterparts, provide better geo-contextual signals on the topical interest of users in a given region (Manovich 2020).
Meetup.com, as a prominent social media platform specializing in hosting offline cultural events, has its own design and conventions that define how people interact with the platform. Many of its topics, for example, are amusing and attract participants, particularly the civically disengaged. It also allows people to connect regardless of their ethnicity, social class, or geographic location. Book clubs, for example, can unite people of all ages, classes, and places (Sander 2005; Sharma et al. 2019; Pakrashi et al. 2018). The platform’s versatility in terms of how it is used for not only enjoyment but also social involvement and participation is unique. Meetup.com mixes virtual and real elements to enhance social capital from strangers, which makes it one of the best platforms for analyzing cultural events at a regional level.
There has been multidisciplinary research focusing on specific patterns of social media usage, such as the motivations for user participation and consequences (Zheng and Lee 2016; Khan 2017). Prior research has shown that hashtagging behavior as a form of social media communication can be culturally affected (Sheldon et al. 2017). Other works, such as (Sheldon et al. 2017; Hong and Na 2018; Lin and Ho 2018), have discussed the cultural implications of social media communication. Social platforms also enable political participation, ideological categorization, and social movement (Koiranen et al. 2020; Shen et al. 2020; Yu and Oh 2018). Moreover, the work of (Lee et al. 2018) examines the correlation between social media usage and political polarization through increased political engagement. However, no prior study has investigated the specific link between cross-cultural differences and event-based social networks at the country level due to a lack of empirical data.
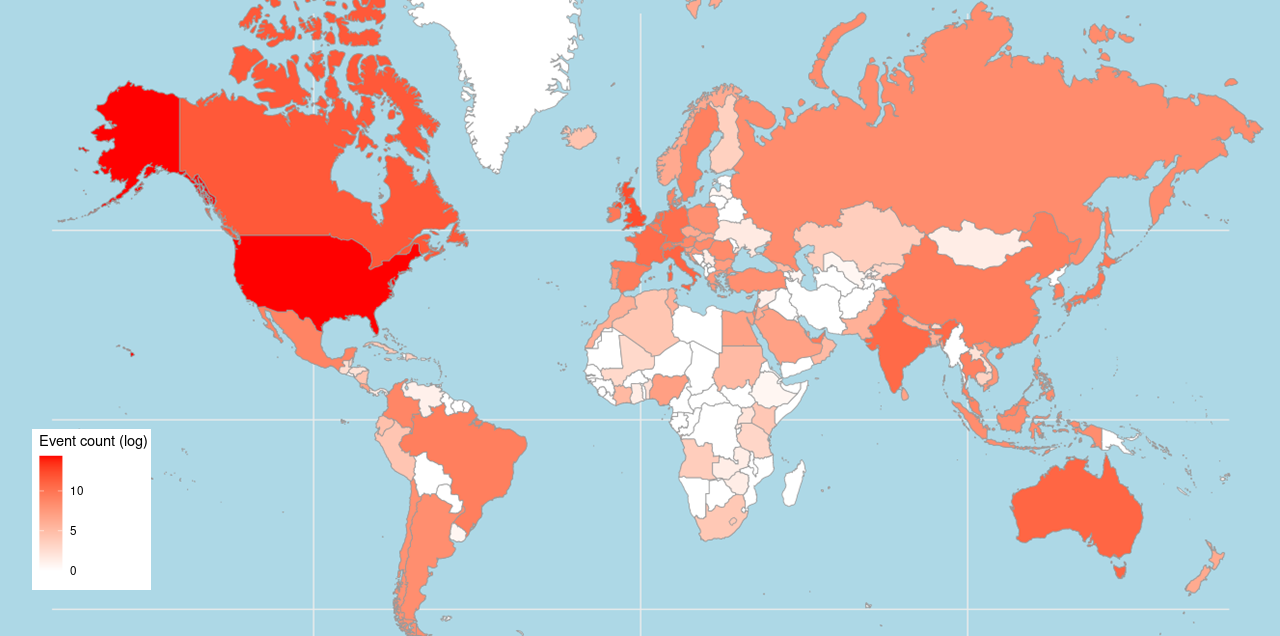
Here, by proposing an organic approach, we advance the research on the relationship between cultural traits and the event dynamics patterns of Meetup.com in many countries worldwide. Event dynamics of each country are examined using various behavioral features, including the participating group, temporal, and category-related patterns. Furthermore, our approach identifies the hierarchical predominance of event categories across multiple countries and argues that scrutinizing the inter-connected hierarchical structure is a crucial step toward a wider understanding of cultural structures and traits. We show that the category prevalence is shaped by the hierarchical structure of cultural traits, specifically the Hoefstede (Hofstede et al. 2010) and Inglehart-Welzel (Inglehart and Welzel 2010b) cultural dimension theory. Our dataset of over 2 million events organized in over 17,000 cities in 90 countries span 17 years between 2003 and 2019 (see Figure 1(a)). The dataset includes its category, date, location, and short text description posted by event organizers, as shown in the main interface (Figure 1(b)). Event organizers select the categories from the 33 available categories, which are grouped into eleven mid-level categories and seven top-level categories (see Appendix).

The remainder of the paper is organized as follows. Section 2 describes how overall, temporal, and category-related behavior patterns are measured. The results of this study, presented in Section 4, include the correlation results and hierarchical structure of the category prevalence. We discuss our findings in Section 5, and lastly, we conclude this paper with some remarks in Section 6.
2. Methods
2.1. Measuring Overall Behavior Pattern
Throughout the investigation, an overall behavior pattern is examined via a summary statistic consisting of the total event count (TEC) for the period, the total number of transactions (N), the average number of events per transaction (), and the standard deviation of events per transaction (). We specify the transaction table of each country as follows. Let transaction denote a set of event categories that exist on the same day in a certain nation, denote a set of transactions, , denoting a transaction table, and denote a set of different event categories . An is a collection of event categories, such as . Because the distributions of TEC and NTrans are positively skewed, we apply log transformation to them. We use the coefficient of variation (CoV) to measure the relative variability of a country’s event patterns:
| (1) |
The country is more likely to have unequal distribution of events across transactions as rises and vice versa.
2.2. Measuring Temporal Behavior Pattern
Three time frames, namely, week (W), month (M), and quarter (Q), are used to measure temporal behavior patterns at various granularities. To calculate the variability of a country’s event pattern through time windows, we define as the total of event produced in each week; as the total event produced in each month; and as the total of event in each three-month intervals. We calculate the variability of event patterns in weekly (), monthly (), and quarterly () measurements for each country.
The average cosine similarity coefficients across adjacent time intervals are used to calculate a country’s consistency in creating events during a monthly (PM) and quarterly (PQ) observation period. We calculate the monthly persistence period by aggregating the number of events at the weekly interval (e.g., four elements per month) and obtaining the proportion of each element. Monthly persistence is computed as:
| (2) |
where is the vector representing the relative amount of events created in each monthly interval in a given month , and is the number of months in a country. Similarly, for the quarterly observation periods, we construct by aggregating the number of events monthly (i.e., three elements for each quarter). A persistence value of 1 indicates that the relative number of occurrences remains constant over time periods and vice versa.
Bursty dynamics () is a method of calculating the intensity of a large number of events over a short period of time. The inter-event times are first calculated as the daily difference between two adjacent transactions. Inter-event times are described as , where signifies the transaction created at time . The following formula can be used to determine bursty dynamics:
| (3) |
where is specified as with and indicate the average and standard deviation of the transaction’s inter-event timings, respectively. When the burstiness parameter is -1, the country’s event pattern is completely steady. The country’s event pattern is entirely random when . Finally, a value of 1 for the parameter results in significant and unexpected increases in the number of occurrences in each transaction.
2.3. Measuring Category-related Behavior Pattern
The category-related behavior metrics are calculated using the total number of events to assess the frequency of occurrences in various categories. The number of categories () indicates how many separate categories were covered during the period. In addition, we assess the diversity of events produced by each country by examining the diversity of categories, , as defined by the Shannon-Wiener diversity index’s relative score:
| (4) |
where is the number of unique categories of country , and is the number of events created by the country in the category . A low score indicates that the country’s events are focused on only a few categories. A high value of , on the other hand, indicates that a country’s number of events is evenly spread throughout all categories.
2.4. Measuring Category Prevalence
We create a matrix that shows how common each category is in each country. Each element in this matrix, , represents the normalized rank of category in country . First, we select a country with , resulting in 63 countries to be evaluated further. We sort each country’s top-10 categories and then use the union to combine the results. This results in 28 top categories, which are found in 63 countries. Each category is sorted in ascending order from the highest to the lowest for each country, based on the total event count (TECk). We make the implicit assumption that a larger TECk value is preferred. As a result, the category is ranked 1 for each country, with is ranked 1. Any missing category is given a rank of 28, indicating that it is not considered important. Formally, a pseudo-code for creating a category rank matrix is summarized in Algorithm 1.
3. Data
3.1. Data Description
The data used for this study is comprised of Meetup events from 146 countries gathered from February 13, 2003, to May 5, 2019, which was collected at the City University of New York using the Meetup API by the author. The data includes the date, category, geographic location, and short text descriptions posted by event organizers. A total of 2,635,724 event samples were recorded. To narrow this study’s scope, we look at the top-90 countries in terms of total event count (TEC), in which a country having fewer than 18 events during the designated period is omitted. Finally, a total of 2,635,508 event samples were included for further analysis. Figure 2 shows an example of the spatiotemporal evolution of Meetup events across time. A total of 33 different categories were covered in only four countries, while other countries had fewer (see Table 1). A list of 33 categories, including the corresponding mid- and top-level categories, is presented in Table 2. Table 1 summarizes the dataset used in the analysis.

3.2. Normality of the Data Distribution
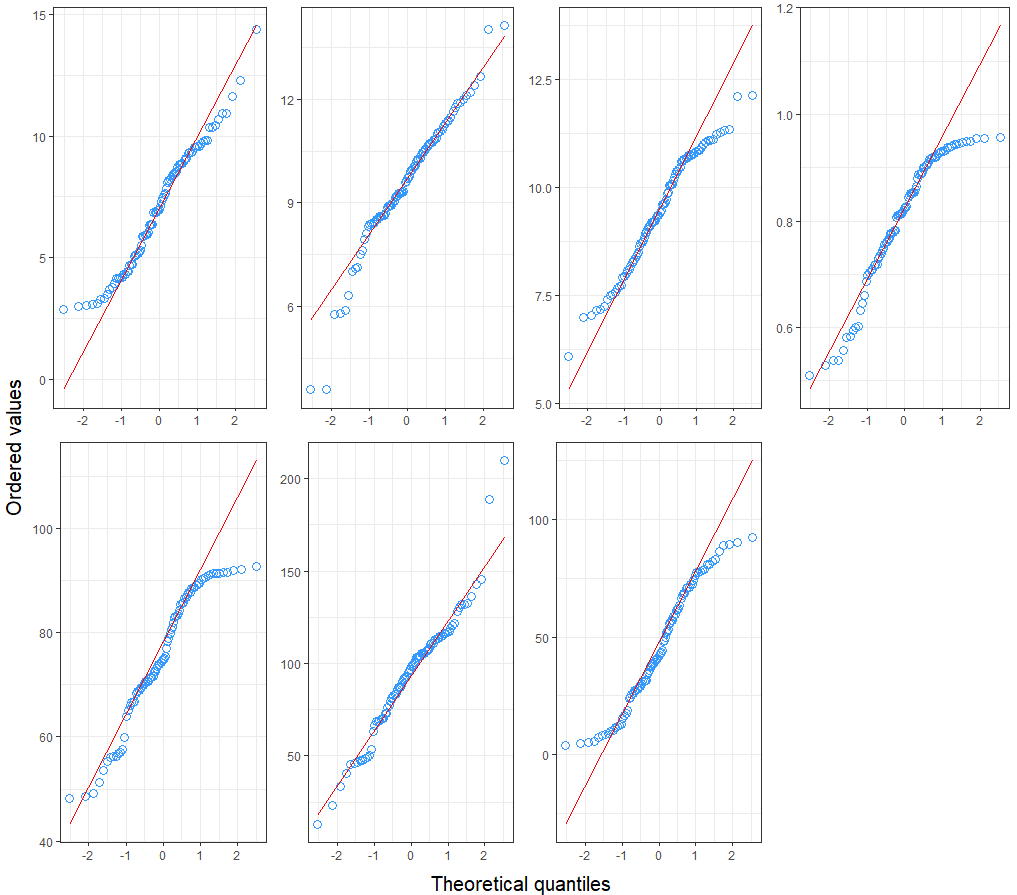
We examine the normality of logarithmic total event count (TEC), logarithmic population, logarithmic GDP per capita (GDP), human development index (HDI), social progress index (SPI), mobile cellular subscriptions per 100 people (MSubs), and individuals using the Internet as a % of the population (IntUs) of the top-90 countries. The tests indicate that TEC and GDP follow a normal distribution, while population, HDI, SPI, MSubs, and IntUs do not follow a normal distribution. The -values of the Jarque–Bera test for TEC, population, GDP, HDI, SPI, MSubs, and IntUs are 0.417, 0.0016, 0.204, 0.014, 0.091, 0.004, and 0.081, respectively. Hence, we fail to reject the null hypothesis that the data is normally distributed for TEC and GDP but not for the population, HDI, SPI, MSubs, and IntUs. The linear Q-Q plot (see Figure 3) confirms the normality of TEC and GDP distributions.
4. Results
4.1. Association Between Event Dynamics and Socioeconomic Performances
Variations in event dynamics patterns are strongly linked to disparities in economic conditions between countries. These correlations provide support for the external validity of the Meetup.com platform. As an illustration, consider that overall, temporal, and category-related traits positively correlate to all socioeconomic indicators except the bursty dynamics. We observe that bursty dynamics negatively correlate with prosperity (as indexed by GDP per capita and human development index (HDI) (Fund 2019)), social progress imperative (as scored by basic human needs, foundations of wellbeing, and opportunity (Imperative 2020)), and digital development index (as measured by the number of internet users per 100 people (Union 2020)) (see Appendix). We highlight three significant relationships that reveal intriguing findings. First, Figure 4 reveals a significant association (= -0.22, ) between bursty dynamics () and foundations of wellbeing. Second, bursty dynamics and opportunity score based on the social development index (Figure 4b) have a substantial link (= -0.22, ). Finally, we discover that wealth (as assessed by GDP per capita (Fund 2019)) has a positive correlation (, ) with the diversity index of categories () (Figure 4c).

4.2. Cultural Traits versus Event Dynamics
Features revealed by event dynamics demonstrate a strong correlation to cultural differences according to Hofstede’s Cultural Scale (Hofstede et al. 2005) and Ingelhart-Welzel World Value Survey (Inglehart and Welzel 2010a; Inglehart 2018; Inglehart and Welzel 2010b), except that masculinity/femininity (see Appendix). We discuss these correlations of Hofstede’s cultural scale as follows. The perceived utility of social networks is directly linked to masculine culture’s values of achievement and progress. However, our findings show no substantial relationship between masculine/feminine cultures and event dynamics characteristics. The other five primary cultural attributes and predictors of event dynamics elements are highlighted. First, we notice systematic differences between individualistic and collectivistic communities. Individualistic cultures, which value utility and active engagement in social exchange (Sánchez-Franco et al. 2009), show a substantial positive connection to total event count (TEC) and other temporal behavior-related variables (Figure 5a) (see Appendix).
Second, countries with high degrees of uncertainty avoidance have only a weak negative relationship with the event category variety index () (Figure 5b). Third, people in low-power distance cultures are more dependent and hence more vulnerable to Meetup.com regardless of power status. Our findings show that bursty dynamics are substantially correlated with high-level power distance cultures (Figure 5b-inset). Fourth, we highlight a collection of correlations involving long-term orientation indices in which specific dynamics properties are significant (see Appendix). We find that the frequency of events and coefficient of variation (CoV) is related in long-term orientation societies (Figure 5c). Finally, we observe that indulgence cultures have significant effects on the average number of events per transaction () and category variety index () (Figure 5d).

4.3. Hierarchical Structure of the Category Prevalence
Based on their geographic location, we can locate countries with homogeneous category preference vectors and explore clusters of countries with such event category predominance. We identified 63 countries with at least ten categories, assigned normalized category ranks to each country, and performed hierarchical clustering using Euclidean distance and Ward’s clustering (Murtagh and Legendre 2014) (see Methods). Three distinct preference clusters of countries were discovered in this investigation. These are illustrated in Figure 6, and are generally consistent in terms of cultural proximity, according to the Inglehart-Welzel World Value Survey 2005-2020 (Inglehart and Welzel 2010a; Inglehart 2018; Inglehart and Welzel 2010b).

The first cluster includes African-Islamic, Catholic Europe, Latin America, and other countries not represented on the World Cultural Map. Countries in the cluster also stress Traditional and Survival Values, Traditional and Self Expression Values, and Secular-Rational and Survival Values. The second group comprises Catholic Europe and several Orthodox European countries as well as African Islamic countries and Latin American states. This cluster also includes Traditional and Survival Values and Secular-Rational and Self-Expression Values. English-speaking Protestant Europe and Confucianist cultural groupings such as Macao, Japan, China, and Hong Kong make up the third cluster. Secular-Rational and Self-Expression Values, as well as Secular-Rational and Survival cultural groups, are all included.


On the other hand, as indicated by cluster 1, traditional cultures have a high interest in movement and politics because they respect national pride and a patriotic viewpoint. In other words, countries in cluster 1 appear to use Meetup.com more frequently to engage in national politics or transformations dialogue. Cluster 2, on the other hand, demonstrates a considerably larger predilection for writing and technology than the other two clusters, despite the lack of cultural proximity. Finally, all clusters appear to have the same modest inclination towards language and identity, new age and spirituality, and singles.
5. Discussion
A study on cultural analytics suggests that data science methods can be used to quantitatively evaluate the patterns, trends, and dynamics of people’s intellectual preferences (Michel et al. 2011; Kim et al. 2014; Manovich 2020). Meetup is a “digital culture” as its platform connects physical activities. The main contribution of this study is an in-depth quantitative investigation of Meetup.com’s event dynamics patterns and how they connect to cultural attributes. By examining a vast data set from Meetup.com that captures real, cultural events organized by people worldwide, we offer an organic way to identify world cultural features and differences. Our method captures differences in cultural event dynamics and generates a set of features that can be used to quantify cultural regularities statistically across countries throughout the world. Furthermore, it enables us to detect cultural closeness, reflecting groups of countries with a shared interest in specific issues. We tested whether event dynamics patterns help explain socioeconomic indicators across 90 societies on all continents. The implications of our findings are discussed as follows.
First of all, the current study found a negative association between the event consistency and the country’s well-being. In other words, the more foundational education, information, and understanding a country’s population has and the conditions for living a healthy life, the more probable the country is to have entirely stable event usage. The result confirmed previous findings that the usage of social networking sites might boost well-being by increasing social capital, which in turn enhances social support (Van Ingen et al. 2016; Trepte et al. 2015; Trepte and Scharkow 2016; Utz and Breuer 2017). While most existing studies focused on pure online social networking sites, this study added a research implication that social support could also happen in an offline setting through face-to-face meeting events. In a similar vein, the opportunity domain of the SPI is negatively associated with its bursty dynamics. Creating a consistent number of Meetup events in a given country is intimately linked to a citizen’s right to freedom of speech. This correlation is explained by a society that supports an individual’s self-esteem and encourages more self-expression. Furthermore, our correlation showed that a rich country tends to have diverse event categories. The number of events in wealthy countries is not concentrated in a few categories, owing to the enormous number of people who engage in various cultural activities. While Meetup events are considered to represent real-world cultural activities, one could argue that cultural and social involvement has always been a means of encouraging rapid economic development in a given country (Ivaldi and Santagata 2017).
This current research revealed that individualistic cultures also have a more consistent pattern regarding the number of events (). This correlation aligns with the existing literature in which individualistic cultures value self-expression (e.g., self-esteem) and independence more than collectivist societies. The Meetup.com platform is based on events organized by individuals who want to share their ideas and communicate with others about similar issues. Even though Meetup comprises social structures and not stranger-to-stranger contacts, motivation is required to create events that will entice people to participate in such activities. In contrast to collectivist societies, the more independent a society is, the more encouraged people are to share their opinions and fearlessly express them. In the countries with a high value of uncertainty avoidance score, we show that such countries have low , indicating the choice of attending the event was limited to a few categories. Because Meetup.com allows for social presence, there is a lesser sense of uncertainty, which makes meeting new people less intimidating. However, as evidenced by the low , we can deduce that uncertainty dampens the impact of shifting to new event categories. For societies with high-level power distance, there is a tendency that the social media platform is difficult to adopt since the number of events has appeared at random () (Sander 2005).
Furthermore, our correlation shows that the number of events increases in long-term-oriented societies. We might argue that Meetup.com has been preferred to maintain a long-term connection. Building trust and deep bonds in high short-term oriented societies, on the other hand, is difficult and time consuming (Marcus and Krishnamurthi 2009). Meetup.com appears to be an excellent platform for attracting devoted attendees, allowing event organizers to identify and better predict turnout. This study also shows a positive impact of the social media platform on indulging societies. Indulgent societies emphasize enjoying life and having fun, mainly leisure, spending, and consumption. Thus, we can argue that the average number of events per transaction and category variations on Meetup.com are linked to social leisure, offering the members the opportunity to fulfill social needs. This result is in line with previous work mentioning that Meetup.com is a platform that meets Maslow’s Hierarchy of Needs for belonging, esteem, and self-actualization (Edgerly 2010).
Next, we discuss the correlations between dynamic pattern features and cultural traits based on the Ingelhart-Welzel World Value Survey. We observe that survival vs. self-expression cultural values possess significant correlations with all pattern dynamics measures, including overall behavior pattern, temporal behavior pattern, and event category-related behavior pattern (see Appendix). In other words, it can be implied that the higher the self-expression values, the larger the production of Meetup.com events. Furthermore, the events were evenly distributed in all available categories, implying that the events were diverse. The low level of trust in a survival-oriented culture may explain why Meetup.com is not widely accepted. An adequate level of trust is required to enable the formation of the social structure (Sander 2005). In a society that lacks trust, it is hard to form a corporate structure (Govier 1997). Consequently, it may be challenging to build a social structure in a survival-oriented society with low-level trust.
Our findings show that the associations between traditional vs. secular-rational authority values and all dynamic pattern features are substantial, except for bursty dynamics and the category variability index (see Appendix). The significant association between these cultural values and the overall event count, transaction count, or the average number of events per transaction on Meetup.com shows that events are actively generated in more secular cultures. If Meetup.com represents cultural beliefs, it is reasonable to assume that it is rarely used for religious or traditional family purposes. Secular cultures regard religion and traditional family values less. Another important conclusion is that, despite the large number of categories (), events in secular-oriented societies were not evenly distributed throughout the various categories (i.e., is unimportant).
The clustering pattern suggests that a group of countries’ cultural proximity may enable them to acquire common interests in event categories. The differences between the clusters show an interesting pattern of variation. As demonstrated in Figure 7. For example, compared to Cluster 1, countries in Cluster 3 have a substantially lower preference for religion and beliefs, movement and politics, and religion and beliefs. Cluster 3 is a secular-rational-oriented culture in which religion, traditional family values, and authority are less important. Cluster 3 countries, on the other hand, are more concerned with personal values such as leisure and the development of interpersonal ties. Music, socializing, sports & entertainment, and fitness are becoming increasingly popular.
Our clustering pattern also reveals cultural proximity as measured by Hofstede’s cultural dimension values. Cluster 1 is mainly made up of countries that mark low in uncertainty and ambiguity values, while Cluster 3 is mostly made up of countries that value individuality, as seen in Figure 8. Compared to the other two clusters, Cluster 2 has no specific cultural traits. Uncertainty avoidance cultures tend to construct specific beliefs and norms to prevent uncertain situations, and they do not allow unorthodox behaviors (Smith 1992). (Mari et al. 2021) suggested that the uncertainty avoidance index, in particular, impacted institutional trust. As a result, the prominence of the movement and politics categories in Cluster 1 can be interpreted to be significantly associated with a high level of uncertainty avoidance. Finally, countries with individualistic cultures (e.g., Cluster 3) that value out-group connections above in-group interactions strongly prefer socializing and other leisure-related categories. It could be because people in an individualistic society have a lot of ability to pick and choose their organizations, and there are a lot of them.
6. Conclusion
We investigated the landscape of cultural events held on Meetup.com, an event-based social network that allows organizers to host offline events. Using 17 years of event data, we developed multiple statistical analysis approaches to capture the dynamic event patterns such as the overall behavior pattern, temporal pattern, and category-related pattern. We demonstrated that many event dynamics and category occurrences are strongly correlated with the economic and cultural characteristics of the countries. Furthermore, a clustering technique to uncover the category prevalence was built. The result offered a better understanding of cultural differences, particularly how people from traditional and secular cultures chose their preferences within Meetup’s categories.
Subsequently, we also raise several issues and limitations associated with our study. Even though Meetup.com is extensively used worldwide, the event distribution is still heavily skewed towards the United States and specific event categories such as movement and politics in Italy. Furthermore, because social diffusion dynamics drive Meetup’s growth directly or indirectly, our data set may indicate greater aggregation and imbalanced distortions. Furthermore, we assume that event categories are disjoint sets, even though they are likely to overlap in the actual world because event organizers may choose them at random when planning a new event. Furthermore, we assume that the total of individual or group cultural values equals country-level values. However, cultural values are unlikely to be universally agreed upon by all the people of a country (Leung and Morris 2015; Peterson 2016). Finally, we may identify how these values are shared across countries by obtaining individual-level data on cultural value orientations and category preferences, allowing for a more nuanced assessment of the extent to which a country implies culture (Gelfand et al. 2011). Despite these constraints, we believe that this research can provide a new viewpoint on how event dynamics patterns in social network platform reflect country-level cultural norms. Our method highlights the relationship between culture, nation, and group behaviors, as illustrated on Meetup.com, allowing us to learn more about how cultural events are created, organized, valued, and experienced.
References
- (1)
- Boli and Lechner (2015) John Boli and Frank J. Lechner. 2015. Globalization and World Culture. In International Encyclopedia of the Social & Behavioral Sciences (Second Edition) (second edition ed.), James D. Wright (Ed.). Elsevier, Oxford, 225–232.
- Can and Alatas (2019) Umit Can and Bilal Alatas. 2019. A new direction in social network analysis: Online social network analysis problems and applications. Physica A: Statistical Mechanics and its Applications 535 (2019), 122372.
- Choudhary et al. (2019) Sonal Choudhary, Rakesh Nayak, Sushma Kumari, and Homagni Choudhury. 2019. Analysing acculturation to sustainable food consumption behaviour in the social media through the lens of information diffusion. Technological Forecasting and Social Change 145 (2019), 481–492.
- Edgerly (2010) Peia Marie Edgerly. 2010. Using the internet as an access to leisure: a study of Meetup. Thesis. California State University at Sacramento.
- Fenich (2013) George G Fenich. 2013. Meetings, Expositions, Events & Conventions: Pearson New International Edition: An Introduction to the Industry. Pearson Higher Ed.
- Frigo (2017) Giovanni Frigo. 2017. Energy ethics, homogenization, and hegemony: A reflection on the traditional energy paradigm. Energy Research & Social Science 30 (2017), 7–17.
- Fund (2019) International Monetary Fund. 2019. World Economic Outlook Database. https://www.imf.org/en/Publications/WEO/weo-database/2019/April
- Gelfand et al. (2011) Michele J Gelfand, Jana L Raver, Lisa Nishii, Lisa M Leslie, Janetta Lun, Beng Chong Lim, Lili Duan, Assaf Almaliach, Soon Ang, Jakobina Arnadottir, et al. 2011. Differences between tight and loose cultures: A 33-nation study. Science 332, 6033 (2011), 1100–1104.
- Getz (2008) Donald Getz. 2008. Event tourism: Definition, evolution, and research. Tourism management 29, 3 (2008), 403–428.
- Getz and Page (2019) Donald Getz and Stephen J Page. 2019. Event studies: Theory, research and policy for planned events. Routledge.
- Govier (1997) Trudy Govier. 1997. Social trust and human communities. McGill-Queen’s Press-MQUP.
- Hamidi et al. (2011) Yasin Hamidi, Yasaman Hamidi, and Shahrbanou Mehrbabak. 2011. Localization versus globalization of social networks. Procedia Computer Science 3 (2011), 191–196.
- Hofstede et al. (2005) Geert Hofstede, Gert Jan Hofstede, and Michael Minkov. 2005. Cultures and organizations: Software of the mind. Vol. 2. Mcgraw-hill New York.
- Hofstede et al. (2010) Geert Hofstede, Gert Jan Hofstede, and Michael Minkov. 2010. Cultures and organizations: Software of the mind. Vol. 2. Mcgraw-hill New York.
- Hong and Na (2018) Seungbeom Hong and Jinkyung Na. 2018. How Facebook is perceived and used by people across cultures: The implications of cultural differences in the use of Facebook. Social Psychological and Personality Science 9, 4 (2018), 435–443.
- Imperative (2020) Social Progress Imperative. 2020. Global Index 2020. https://www.socialprogress.org/index/global
- Inglehart (2018) Ronald Inglehart. 2018. Cultural evolution: People’s motivations are changing, and reshaping the world. Cambridge University Press.
- Inglehart and Welzel (2010a) Ronald Inglehart and Christian Welzel. 2010a. Changing mass priorities: The link between modernization and democracy. Perspectives on politics 8, 2 (2010), 551–567.
- Inglehart and Welzel (2010b) Ronald Inglehart and Chris Welzel. 2010b. The WVS cultural map of the world. World Values Survey (2010).
- Ivaldi and Santagata (2017) Enrico Ivaldi and Marta Santagata. 2017. Cultural Well-Being and GDP Per Capita in Italy: Empirical Evidence. Quality of Life and Quality of Working Life (2017), 151.
- Khan (2017) M Laeeq Khan. 2017. Social media engagement: What motivates user participation and consumption on YouTube? Computers in Human Behavior 66 (2017), 236–247.
- Kim et al. (2014) Daniel Kim, Seung-Woo Son, and Hawoong Jeong. 2014. Large-scale quantitative analysis of painting arts. Scientific Reports 4, 1 (2014), 1–7.
- Koiranen et al. (2020) Ilkka Koiranen, Aki Koivula, Arttu Saarinen, and Teo Keipi. 2020. Ideological motives, digital divides, and political polarization: How do political party preference and values correspond with the political use of social media? Telematics and Informatics 46 (2020), 101322.
- Lee et al. (2018) Changjun Lee, Jieun Shin, and Ahreum Hong. 2018. Does social media use really make people politically polarized? Direct and indirect effects of social media use on political polarization in South Korea. Telematics and Informatics 35, 1 (2018), 245–254.
- Leung and Morris (2015) Kwok Leung and Michael W Morris. 2015. Values, schemas, and norms in the culture–behavior nexus: A situated dynamics framework. Journal of International Business Studies 46, 9 (2015), 1028–1050.
- Lin and Ho (2018) Hsien-Cheng Lin and Wen-Hsien Ho. 2018. Cultural effects on use of online social media for health-related information acquisition and sharing in Taiwan. International Journal of Human–Computer Interaction 34, 11 (2018), 1063–1076.
- Liu et al. (2012) Xingjie Liu, Qi He, Yuanyuan Tian, Wang-Chien Lee, John McPherson, and Jiawei Han. 2012. Event-based social networks: linking the online and offline social worlds. In proc. of the ACM SIGKDD International Conference on Knowledge Discovery and Data Mining. 1032–1040.
- Manovich (2020) Lev Manovich. 2020. Cultural Analytics. MIT Press.
- Marcus and Krishnamurthi (2009) Aaron Marcus and Niranjan Krishnamurthi. 2009. Cross-cultural analysis of social network services in Japan, Korea, and the USA. In International Conference on Internationalization, design and global development. Springer, 59–68.
- Mari et al. (2021) Silvia Mari, Homero Gil de Zúñiga, Ahmet Suerdem, Katja Hanke, Gary Brown, Roosevelt Vilar, Diana Boer, and Michal Bilewicz. 2021. Conspiracy Theories and Institutional Trust: Examining the Role of Uncertainty Avoidance and Active Social Media Use. Political Psychology (2021).
- Michel et al. (2011) Jean-Baptiste Michel, Yuan Kui Shen, Aviva Presser Aiden, Adrian Veres, Matthew K Gray, Google Books Team, Joseph P Pickett, Dale Hoiberg, Dan Clancy, Peter Norvig, et al. 2011. Quantitative analysis of culture using millions of digitized books. Science 331, 6014 (2011), 176–182.
- Murtagh and Legendre (2014) Fionn Murtagh and Pierre Legendre. 2014. Ward’s hierarchical agglomerative clustering method: which algorithms implement Ward’s criterion? Journal of classification 31, 3 (2014), 274–295.
- Pakrashi et al. (2018) Arjun Pakrashi, Elham Alghamdi, Brian Mac Namee, and Derek Greene. 2018. MeetupNet Dublin: Discovering Communities in Dublin’s Meetup Network. arXiv preprint arXiv:1810.03046 (2018).
- Peterson (2016) Mark F Peterson. 2016. A culture theory commentary on Meyer and Peng’s theoretical probe into Central and Eastern Europe. Journal of International Business Studies 47, 1 (2016), 33–43.
- Rogers et al. (2014) Everett M Rogers, Arvind Singhal, and Margaret M Quinlan. 2014. Diffusion of innovations. In An integrated approach to communication theory and research. Routledge, 432–448.
- Rojek et al. (1997) Chris Rojek, John Urry, et al. 1997. Touring cultures: Transformations of travel and theory. Psychology Press.
- Sánchez-Franco et al. (2009) Manuel J Sánchez-Franco, Francisco J Martínez-López, and Félix A Martín-Velicia. 2009. Exploring the impact of individualism and uncertainty avoidance in Web-based electronic learning: An empirical analysis in European higher education. Computers & Education 52, 3 (2009), 588–598.
- Sander (2005) Thomas Sander. 2005. E-associations: using technology to connect citizens: the case of Meetup.com. American Political Science Association.
- Sharma et al. (2019) Abhishek Sharma, Gede Artha Azriadi Prana, Anamika Sawhney, Nachiappan Nagappan, and David Lo. 2019. Analyzing Offline Social Engagements: An Empirical Study of Meetup Events Related to Software Development. arXiv preprint arXiv:1912.07352 (2019).
- Sheldon et al. (2017) Pavica Sheldon, Philipp A Rauschnabel, Mary Grace Antony, and Sandra Car. 2017. A cross-cultural comparison of Croatian and American social network sites: Exploring cultural differences in motives for Instagram use. Computers in Human Behavior 75 (2017), 643–651.
- Shen et al. (2020) Fei Shen, Chuanli Xia, and Marko Skoric. 2020. Examining the roles of social media and alternative media in social movement participation: A study of Hong Kong’s Umbrella Movement. Telematics and Informatics 47 (2020), 101303.
- Smith (1992) Peter B Smith. 1992. Organizational behaviour and national cultures. British Journal of Management 3, 1 (1992), 39–51.
- Trepte et al. (2015) Sabine Trepte, Tobias Dienlin, and Leonard Reinecke. 2015. Influence of social support received in online and offline contexts on satisfaction with social support and satisfaction with life: A longitudinal study. Media Psychology 18, 1 (2015), 74–105.
- Trepte and Scharkow (2016) Sabine Trepte and Michael Scharkow. 2016. How social capital and social support received in media environments contribute to well-being. The Routledge handbook of media use and well-being: International perspectives on theory and research on positive media effects (2016), 304–316.
- Union (2020) International Telecomunication Union. 2020. Measuring Digital Development: Facts and figures 2020. https://tinyurl.com/5ax2m9e9
- Utz and Breuer (2017) Sonja Utz and Johannes Breuer. 2017. The relationship between use of social network sites, online social support, and well-being. Journal of media psychology (2017).
- Van Ingen et al. (2016) Erik Van Ingen, Sonja Utz, and Vera Toepoel. 2016. Online coping after negative life events: Measurement, prevalence, and relation with internet activities and well-being. Social Science Computer Review 34, 5 (2016), 511–529.
- Yu and Oh (2018) Rebecca Ping Yu and Yu Won Oh. 2018. Social media and expressive citizenship: Understanding the relationships between social and entertainment expression on Facebook and political participation. Telematics and informatics 35, 8 (2018), 2299–2311.
- Zheng and Lee (2016) Xiabing Zheng and Matthew KO Lee. 2016. Excessive use of mobile social networking sites: Negative consequences on individuals. Computers in Human Behavior 65 (2016), 65–76.
Appendix A Data Description
| Country | Code | Lat | Lon | #City | TEC | NCat | NTrans | GDP | HDI | MSubs | IntUs | |
| United States | US | 37.090 | -95.713 | 7,117 | 1,771,002 | 33 | 5,303 | 309,445 | 65,300 | 0.926 | 92.23 | 71.04 |
| United Kingdom | GB | 55.378 | -3.436 | 3,090 | 211,273 | 33 | 4,862 | 63,463 | 42,300 | 0.932 | 116.31 | 80.88 |
| Canada | CA | 56.130 | -106.347 | 519 | 110,559 | 33 | 4,951 | 34,300 | 46,200 | 0.929 | 69.64 | 78.80 |
| Italy | IT | 41.872 | 12.567 | 1,296 | 55,064 | 30 | 4,698 | 59,439 | 33,200 | 0.892 | 142.90 | 48.55 |
| Australia | AU | -25.274 | 133.775 | 1,277 | 54,466 | 33 | 4,169 | 22,271 | 55,100 | 0.944 | 100.63 | 77.36 |
| India | IN | 20.594 | 78.963 | 279 | 42,788 | 29 | 3,316 | 1,238,039 | 2,100 | 0.645 | 47.62 | 10.29 |
| France | FR | 46.228 | 2.214 | 633 | 34,609 | 30 | 2,958 | 62,932 | 40,500 | 0.901 | 91.88 | 67.56 |
| Germany | DE | 51.166 | 10.452 | 481 | 30,713 | 31 | 2,932 | 81,539 | 46,400 | 0.947 | 113.39 | 78.08 |
| Netherlands | NL | 52.133 | 5.291 | 330 | 30,646 | 32 | 3,304 | 16,684 | 52,300 | 0.944 | 112.36 | 86.43 |
| Japan | JP | 36.205 | 138.253 | 113 | 18,116 | 29 | 1,836 | 128,188 | 40,200 | 0.919 | 99.26 | 77.56 |
| Switzerland | CH | 46.818 | 8.228 | 408 | 17,995 | 31 | 3,306 | 7,876 | 82,000 | 0.955 | 117.51 | 80.98 |
| Ireland | IE | 53.413 | -8.244 | 139 | 17,283 | 28 | 3,339 | 4,473 | 78,700 | 0.955 | 103.48 | 66.54 |
| Singapore | SG | 1.352 | 103.820 | 1 | 16,229 | 20 | 3,139 | 5,047 | 65,200 | 0.938 | 131.72 | 71.04 |
| United Arab Emirates | AE | 23.424 | 53.848 | 13 | 14,486 | 25 | 2,748 | 7,602 | 43,100 | 0.89 | 145.61 | 68.33 |
| Hong Kong | HK | 22.396 | 114.109 | 9 | 14,188 | 29 | 2,340 | 7,003 | 48,700 | 0.949 | 188.81 | 70.68 |
| Spain | ES | 40.464 | -3.749 | 181 | 13,798 | 28 | 2,382 | 45,885 | 29,600 | 0.904 | 105.40 | 63.58 |
| Belgium | BE | 50.504 | 4.470 | 214 | 13,753 | 28 | 2,593 | 10,960 | 46,400 | 0.931 | 103.70 | 72.24 |
| China | CN | 35.862 | 104.195 | 60 | 11,799 | 29 | 2,117 | 1,372,420 | 10,300 | 0.761 | 63.09 | 31.10 |
| South Korea | KR | 35.908 | 127.767 | 45 | 11,290 | 24 | 2,660 | 49,770 | 31,800 | 0.916 | 99.08 | 82.19 |
| Brazil | BR | -14.235 | -51.925 | 128 | 11,071 | 29 | 1,708 | 196,276 | 8,720 | 0.765 | 90.48 | 38.94 |
| Sweden | SE | 60.128 | 18.644 | 111 | 10,670 | 27 | 2,673 | 9,436 | 51,600 | 0.945 | 115.33 | 89.24 |
| Thailand | TH | 15.870 | 100.993 | 59 | 8,869 | 30 | 2,470 | 67,238 | 7,810 | 0.777 | 105.34 | 25.77 |
| Israel | IL | 31.046 | 34.852 | 98 | 8,588 | 25 | 2,323 | 7,356 | 43,600 | 0.919 | 121.93 | 57.14 |
| Mexico | MX | 23.635 | -102.553 | 96 | 8,051 | 31 | 1,720 | 114,751 | 9,950 | 0.779 | 68.66 | 33.95 |
| Malaysia | MY | 4.210 | 101.976 | 71 | 7,246 | 27 | 2,083 | 28,270 | 11,400 | 0.81 | 110.21 | 58.58 |
| Denmark | DK | 56.264 | 9.502 | 81 | 7,030 | 27 | 2,711 | 5,568 | 60,200 | 0.94 | 116.24 | 89.02 |
| Taiwan | TW | 23.698 | 120.961 | 17 | 6,963 | 26 | 1,841 | 23,179 | 32,100 | 0.907 | NA | NA |
| Colombia | CO | 4.571 | -74.297 | 43 | 6,951 | 27 | 1,762 | 45,428 | 6,430 | 0.767 | 87.21 | 35.11 |
| Austria | AT | 47.516 | 14.550 | 80 | 6,056 | 23 | 1,732 | 8,477 | 50,100 | 0.922 | 136.16 | 72.40 |
| Romania | RO | 45.943 | 24.967 | 31 | 5,072 | 21 | 1,930 | 20,534 | 12,900 | 0.828 | 98.46 | 38.40 |
| Hungary | HU | 47.162 | 19.503 | 39 | 4,834 | 21 | 1,687 | 9,917 | 16,700 | 0.854 | 111.04 | 59.50 |
| Philippines | PH | 12.880 | 121.774 | 81 | 4,712 | 26 | 1,597 | 94,902 | 3,490 | 0.718 | 81.82 | 24.25 |
| Russia | RU | 61.524 | 105.319 | 20 | 4,611 | 21 | 1,498 | 144,206 | 11,600 | 0.824 | 127.92 | 43.23 |
| Indonesia | ID | -0.789 | 113.921 | 73 | 4,320 | 26 | 1,442 | 243,766 | 4,140 | 0.718 | 83.01 | 12.23 |
| Argentina | AR | -38.416 | -63.617 | 46 | 3,930 | 25 | 1,555 | 41,169 | 9,910 | 0.845 | 113.46 | 40.72 |
| Turkey | TR | 38.964 | 35.243 | 40 | 3,761 | 19 | 1,299 | 73,529 | 9,130 | 0.82 | 82.70 | 37.47 |
| Poland | PL | 51.919 | 19.145 | 26 | 3,612 | 19 | 1,441 | 38,226 | 15,700 | 0.88 | 114.69 | 55.65 |
| Chile | CL | -35.675 | -71.543 | 32 | 3,250 | 19 | 1,453 | 17,183 | 14,900 | 0.851 | 104.02 | 49.87 |
| Vietnam | VN | 14.058 | 108.277 | 25 | 2,574 | 22 | 1,292 | 88,634 | 2,720 | 0.704 | 91.46 | 27.48 |
| Qatar | QA | 25.355 | 51.184 | 10 | 2,088 | 22 | 964 | 1,828 | 62,100 | 0.848 | 114.43 | 57.09 |
| Greece | GR | 39.074 | 21.824 | 53 | 1,993 | 21 | 1,004 | 10,893 | 19,600 | 0.888 | 105.62 | 44.43 |
| Portugal | PT | 39.400 | -8.224 | 43 | 1,762 | 22 | 905 | 10,472 | 23,300 | 0.864 | 113.17 | 51.82 |
| Croatia | HR | 45.100 | 15.200 | 22 | 1,663 | 18 | 995 | 4,302 | 14,900 | 0.851 | 100.63 | 52.15 |
| Bulgaria | BG | 42.734 | 25.486 | 11 | 1,475 | 18 | 802 | 7,414 | 9,830 | 0.816 | 118.87 | 42.01 |
| Nigeria | NG | 9.082 | 8.675 | 27 | 1,219 | 13 | 751 | 161,882 | 2,230 | 0.539 | 49.25 | 11.91 |
| Saudi Arabia | SA | 23.886 | 45.079 | 14 | 1,063 | 21 | 655 | 28,024 | 23,100 | 0.854 | 131.90 | 43.11 |
| Egypt | EG | 26.821 | 30.802 | 32 | 1,030 | 15 | 635 | 84,544 | 3,020 | 0.707 | 68.59 | 23.82 |
| Slovenia | SI | 46.151 | 14.995 | 23 | 1,022 | 11 | 676 | 2,039 | 25,900 | 0.917 | 103.09 | 61.98 |
| Lebanon | LB | 33.855 | 35.862 | 27 | 970 | 15 | 661 | 5,472 | 7,580 | 0.744 | 53.57 | 40.29 |
| Costa Rica | CR | 9.749 | -83.753 | 37 | 950 | 16 | 550 | 4,596 | 12,200 | 0.81 | 86.85 | 40.19 |
| Sri Lanka | LK | 7.873 | 80.772 | 17 | 938 | 10 | 672 | 20,296 | 3,850 | 0.782 | 72.80 | 12.91 |
| Slovakia | SK | 48.669 | 19.699 | 7 | 593 | 15 | 450 | 5,416 | 19,300 | 0.86 | 105.66 | 68.63 |
| Norway | NO | 60.472 | 8.469 | 12 | 592 | 15 | 455 | 4,934 | 75,400 | 0.957 | 107.82 | 90.23 |
| New Zealand | NZ | -40.901 | 174.886 | 15 | 580 | 15 | 367 | 4,395 | 42,100 | 0.931 | 103.88 | 76.02 |
| Czech Republic | CZ | 49.817 | 15.473 | 13 | 553 | 10 | 401 | 10,481 | 23,500 | 0.9 | 120.66 | 61.62 |
| Jordan | JO | 30.585 | 36.238 | 3 | 414 | 9 | 330 | 7,594 | 4,410 | 0.729 | 88.25 | 30.36 |
| Continued on next page | ||||||||||||
| Continued from previous page | ||||||||||||
| Country | Code | Lat | Lon | #City | TEC | NCat | NTrans | GDP | HDI | MSubs | IntUs | |
| Bahrain | BH | 25.930 | 50.638 | 14 | 391 | 12 | 238 | 1,195 | 23,500 | 0.852 | 132.54 | 61.22 |
| Morocco | MA | 31.792 | -7.093 | 15 | 378 | 14 | 286 | 32,717 | 3,200 | 0.686 | 87.25 | 39.28 |
| Pakistan | PK | 30.375 | 69.345 | 11 | 364 | 9 | 273 | 181,804 | 1,280 | 0.557 | 48.46 | 8.91 |
| Bangladesh | BD | 23.685 | 90.356 | 5 | 361 | 5 | 309 | 148,441 | 1,860 | 0.632 | 45.22 | 5.38 |
| Tunisia | TN | 33.887 | 9.537 | 12 | 352 | 5 | 279 | 10,703 | 3,320 | 0.74 | 93.12 | 31.68 |
| Nepal | NP | 28.395 | 84.124 | 19 | 243 | 11 | 209 | 26,695 | 1,070 | 0.602 | 45.73 | 7.29 |
| Cyprus | CY | 35.126 | 33.430 | 5 | 199 | 10 | 157 | 1,106 | 27,900 | 0.887 | 111.04 | 53.28 |
| Ivory Coast | CI | 7.546 | -5.548 | 3 | 191 | 4 | 173 | 20,995 | 2,280 | 0.538 | 66.45 | 11.68 |
| Oman | OM | 21.513 | 55.923 | 16 | 174 | 11 | 142 | 3,377 | 15,300 | 0.813 | 116.86 | 37.38 |
| Sudan | SD | 12.863 | 30.218 | 1 | 170 | 2 | 141 | 35,250 | 442 | 0.51 | 46.40 | 15.31 |
| Georgia | GE | 42.315 | 43.357 | 2 | 163 | 6 | 127 | 4,105 | 4,700 | 0.812 | 85.91 | 27.22 |
| Mauritius | MU | -20.348 | 57.552 | 11 | 157 | 5 | 116 | 1,244 | 11,100 | 0.806 | 96.40 | 29.16 |
| Liechtenstein | LI | 47.166 | 9.555 | 4 | 112 | 5 | 68 | 36 | 181,000 | 0.919 | 96.98 | 78.47 |
| Ecuador | EC | -1.831 | -78.183 | 7 | 111 | 9 | 97 | 15,151 | 6,180 | 0.759 | 77.15 | 27.89 |
| Macao | MO | 22.211 | 113.553 | 1 | 107 | 12 | 88 | 547 | 84,100 | 0.909 | 210.04 | 56.25 |
| Nicaragua | NI | 12.865 | -85.207 | 3 | 84 | 5 | 74 | 5,869 | 1,910 | 0.66 | 73.18 | 9.82 |
| Iceland | IS | 64.963 | -19.021 | 4 | 83 | 8 | 56 | 317 | 66,900 | 0.949 | 107.90 | 92.41 |
| Peru | PE | -9.190 | -75.015 | 8 | 75 | 9 | 47 | 29,322 | 6,980 | 0.777 | 76.26 | 31.61 |
| Algeria | DZ | 28.034 | 1.660 | 11 | 74 | 1 | 60 | 36,685 | 3,970 | 0.748 | 81.26 | 16.40 |
| Monaco | MC | 43.750 | 7.413 | 1 | 66 | 10 | 65 | 36 | 186,000 | NA | 70.50 | 73.90 |
| Kenya | KE | -0.024 | 37.906 | 5 | 65 | 11 | 55 | 42,769 | 1,820 | 0.601 | 50.10 | 8.40 |
| Jamaica | JM | 18.110 | -77.298 | 9 | 64 | 7 | 50 | 2,821 | 5,580 | 0.734 | 95.12 | 27.07 |
| South Africa | ZA | -30.559 | 22.938 | 7 | 64 | 9 | 50 | 51,902 | 6,000 | 0.709 | 106.63 | 25.53 |
| Cuba | CU | 21.522 | -77.781 | 7 | 51 | 8 | 44 | 11,273 | 8,820 | 0.783 | 12.84 | 18.85 |
| Angola | AO | -11.203 | 17.874 | 1 | 43 | 3 | 24 | 24,036 | 2,790 | 0.581 | 33.59 | 4.73 |
| Kazakhstan | KZ | 48.020 | 66.924 | 1 | 41 | 5 | 42 | 16,534 | 9,810 | 0.825 | 107.30 | 35.96 |
| Finland | FI | 61.924 | 25.748 | 8 | 33 | 7 | 26 | 5,378 | 48,800 | 0.938 | 130.13 | 83.19 |
| Cambodia | KH | 12.566 | 104.991 | 2 | 28 | 2 | 15 | 14,488 | 1,640 | 0.594 | 70.11 | 8.11 |
| Dominican Republic | DO | 18.736 | -70.163 | 4 | 27 | 6 | 18 | 9,749 | 8,280 | 0.756 | 69.47 | 31.04 |
| Kyrgyzstan | KG | 41.204 | 74.766 | 1 | 23 | 2 | 23 | 5,543 | 1,310 | 0.697 | 79.66 | 17.66 |
| Tanzania | TZ | -6.369 | 34.889 | 5 | 22 | 5 | 17 | 45,522 | 1,120 | 0.529 | 40.28 | 3.88 |
| Bahamas | BS | 25.034 | -77.396 | 5 | 21 | 7 | 21 | 354 | 34,900 | 0.814 | 83.68 | 48.01 |
| Myanmar | MM | 21.914 | 95.956 | 2 | 20 | 3 | 10 | 50,920 | 1,410 | 0.583 | 23.14 | 5.18 |
| Belize | BZ | 17.190 | -88.498 | 5 | 18 | 6 | 15 | 326 | 4,820 | 0.716 | 47.66 | 29.02 |
| No | Category | Mid-level category | Top-level category |
|---|---|---|---|
| 1 | Movies & Film | Cinema and Video Art | Art |
| 2 | Sci-Fi & Fantasy | ||
| 3 | Dancing | Dancing | |
| 4 | Arts & Culture | General Art | |
| 5 | Music | Music and Audio Art | |
| 6 | Career & Business | Business and Finance | Training |
| 7 | Education & Learning | Education and Science | |
| 8 | Tech | Technology | |
| 9 | Writing | Languages | |
| 10 | Book Clubs | Everyday Culture | |
| 11 | Cars & Motorcycles | ||
| 12 | Community & Environment | ||
| 13 | Food & Drink | ||
| 14 | Games | ||
| 15 | Health & Wellbeing | ||
| 16 | Hobbies & Crafts | ||
| 17 | Lifestyle | ||
| 18 | Outdoors & Adventure | ||
| 19 | Paranormal | ||
| 20 | Parents & Family | ||
| 21 | Pets & Animals | ||
| 22 | Photography | ||
| 23 | Socializing | ||
| 24 | Support | ||
| 25 | Language & Ethnic Identity | Religion and Traditions | |
| 26 | LGBT | ||
| 27 | New Age & Spirituality | ||
| 28 | Religion & Beliefs | ||
| 29 | Singles | Other | Other |
| 30 | Movements & Politics | Politics | Politics |
| 31 | Fashion & Beauty | Sports | Sports |
| 32 | Fitness | ||
| 33 | Sports & Recreation |
Appendix B Overall Correlations

