ConvBoost: Boosting ConvNets for Sensor-based Activity RecognitionJournal: IMWUTVolume: 72756DOI: 10.1145/3596234CCS: Computing methodologies Machine learning approachesCCS: Human-centered computing Ubiquitous and mobile computing
Abstract.
Human activity recognition (HAR) is one of the core research themes in ubiquitous and wearable computing. With the shift to deep learning (DL) based analysis approaches, it has become possible to extract high-level features and perform classification in an end-to-end manner. Despite their promising overall capabilities, DL-based HAR may suffer from overfitting due to the notoriously small, often inadequate, amounts of labeled sample data that are available for typical HAR applications. In response to such challenges, we propose ConvBoost – a novel, three-layer, structured model architecture and boosting framework for convolutional network based HAR. Our framework generates additional training data from three different perspectives for improved HAR, aiming to alleviate the shortness of labeled training data in the field. Specifically, with the introduction of three conceptual layers–Sampling Layer, Data Augmentation Layer, and Resilient Layer–we develop three “boosters”–R-Frame, Mix-up, and C-Drop–to enrich the per-epoch training data by dense-sampling, synthesizing, and simulating, respectively. These new conceptual layers and boosters, that are universally applicable for any kind of convolutional network, have been designed based on the characteristics of the sensor data and the concept of frame-wise HAR. In our experimental evaluation on three standard benchmarks (Opportunity, PAMAP2, GOTOV) we demonstrate the effectiveness of our ConvBoost framework for HAR applications based on variants of convolutional networks: vanilla CNN, ConvLSTM, and Attention Models. We achieved substantial performance gains for all of them, which suggests that the proposed approach is generic and can serve as a practical solution for boosting the performance of existing ConvNet-based HAR models. This is an open-source project, and the code can be found at https://github.com/sshao2013/ConvBoost
Keywords:
Human Activity Recognition, Deep Learning, Ensemble, Data Augmentation, Sensors1. Introduction
Human Activity Recognition (HAR) is a core research topic in ubiquitous and wearable computing. HAR research covers a variety of application scenarios, including but not limited to health assessments, sports tracking and coaching, sleep monitoring etc. (Plötz et al. 2012; Avci et al. 2010; Hammerla et al. 2015; Ladha et al. 2013; Zhai et al. 2020; Gao et al. 2019). HAR models are essentially mapping functions, which associate streams of sensor data to limited sets of activity types. A traditional HAR pipeline includes sliding window segmentation, feature engineering or extraction, followed by developing pattern recognition or machine learning models for the actual activity recognition step. Out of them, feature engineering tends to be a trial-and-error process, which can be time-consuming. For different HAR tasks, the optimal features may vary from case to case, making feature designing process expensive and less scalable. Recently, deep learning (DL) came into popularity for HAR modelling, which can learn high-level features and perform activity classification in an end-to-end manner. In many cases, they tend to be more effective than traditional feature engineering methods (Plötz and Guan 2018).
For DL-based HAR, two major approaches exist: frame-wise and sample-wise processing (Plötz and Guan 2018). Frame-wise methods are considered mainstream, and such methods train networks on segmented frames (via sliding window), to then map the signal frames to activities. Sample-wise approaches, however, are normally trained using sequential models (e.g., Long Short Term Memory, LSTM (Hammerla et al. 2016; Guan and Plötz 2017)), which can build the mapping relationship from each signal sample (i.e., at each timestamp) to activities. Although sample-wise methods have shown to be successful with regards to handling the challenging non-repetitive (i.e., sequential) activities (Hammerla et al. 2016; Guan and Plötz 2017), the frame-wise processing using variants of convolutional networks–ConvNets– tends to be better at dealing with the more common repetitive activities such as walking, running and cycling, etc. Given the effectiveness and simplicity, frame-wise ConvNet-based methods are now considered mainstream in the HAR field (Ordóñez and Roggen 2016; Hammerla et al. 2016; Yaguchi et al. 2020; Meyer et al. 2021; Chen et al. 2020; Bai et al. 2020; Tang et al. 2021; Münzner et al. 2017; Yang et al. 2015).
Despite the promising performance of DL-based approaches, they often suffer from overfitting problems, especially in application scenarios where there are only small amounts of labeled example data available for model training. Unfortunately, this is a rather common problem due to logistical and privacy related restrictions, which render data annotation expensive if not impossible at times. To alleviate this overfitting issue, several research directions were explored including data augmentation (Li et al. 2020; Wang et al. 2018; Zhang et al. 2017), self-supervised learning (SSL)(Saeed et al. 2019; Tang et al. 2021; Haresamudram et al. 2022; Haresamudram et al. 2020), or learning paradigm design (e.g., ensemble learning (Guan and Plötz 2017; Tan et al. 2022; Sekiguchi et al. 2020), self-paced curriculum learning(Jiang et al. 2015), etc.). For HAR, SSL came into popularity in recent years, which can take advantage of unlabeled data for activity representation learning, with improved performance in downstream HAR tasks (Haresamudram et al. 2022). For ensemble learning, in (Guan and Plötz 2017) an epoch-wise bagging scheme was proposed, based on which a number of epoch-wise LSTMs were generated and combined for sample-wise HAR tasks. To inject diversity for better ensemble results, some hyper-parameters (e.g., window length, sampling point, batch size) were modelled as per-epoch variables. This scheme led to very promising results in challenging HAR scenarios, yet the diversity injection mechanism was specifically designed for sample-wise LSTM and thus may limit its application to the mainstream frame-wise ConvNets in HAR.
Motivated by this epoch-wise bagging idea, in this work we aim to build a more generic ConvNet-Boosting (ConvBoost) framework for mainstream HAR ConvNets. Compared with (Guan and Plötz 2017), which focused on ensemble learning, our ConvBoost defines–and solves–a per-epoch training data generation problem, which renders our overall approach more flexible for various DL models. Compared with the popular SSL-based approaches (Haresamudram et al. 2022), which can learn representation from the unlabeled data, we argue the potentials of the original labeled training sequence haven’t been fully exploited, and via our apporach we can generate high-quality training frames to boost the performance of ConvNets. In our ConvBoost framework, we define three conceptual layers, namely: i) Sampling Layer; ii)Data Augmentation Layer; and iii) Resilient Layer. Their introduction into model training aims at generating per-epoch, diverse training examples from different perspectives to extend the available sample data. Within this three-layer structure, three boosters are integrated: i) Random Framing (R-Frame) booster; ii) Mix-up booster; and iii) Channel Dropout (C-Drop) booster. These boosters enrich the per-epoch training examples by dense-sampling (via R-Frame), synthesizing (via Mix-up), or simulating problematic signals (via C-Drop). With the per-epoch generated additional data, robust epoch-wise classifiers can be trained, which can be used individually (i.e., best base classifier, referred to as Single-Best mode) or jointly (i.e., via Ensemble (Guan and Plötz 2017) mode) for different HAR scenarios. In Figure 1, we demonstrate our proposed 3-layer ConvBoost framework, and the contributions of this paper can be summarized as follows:

- (1)
We propose a 3-layer ConvBoost framework for mainstream ConvNet-based HAR. Through the three new conceptual layers, the proposed ConvBoost can dynamically generate per-epoch additional and complementary training examples for robust HAR model development.
- (2)
Based on the characteristics of sensor data and frame-based HAR problems, we design three tailored boosters corresponding to the three conceptual layers in our ConvBoost, which are Random Framing (R-Frame) booster, Mix-up booster, and Channel Dropout (C-Drop) booster.
- (3)
We demonstrate the effectiveness of our approach in an extensive experimental evaluation on three benchmark datasets . Through our comprehensive experiments we gain an understanding on the performance gains achieved by each layer/booster in our ConvBoost framework.
- (4)
Through our ConvBoost framework, we re-interpret the original epoch-wise bagging scheme (Guan and Plötz 2017), and develop its ConvNet variant. Through our experiments, we found that the performance gains of ConvBoost (Ensemble) mainly stem from the strengthened classifiers (via the per-epoch additional complementary training data), instead of ensemble diversity, indicating training data generation can be a crucial direction for epoch-wise-ensemble based HAR.
- (5)
Our ConvBoost is an extensible framework, and we explore two possible extensions: i) extra boosters; and ii) ConvBoost (Ensemble mode) compression.
2. Related Work
2.1. ConvNets for Human Activity Recognition (HAR)
Compared with traditional HAR, deep learning (DL) can extract high-level activity features and perform classification in an end-to-end manner. With the promising performance, DL became mainstream in HAR research. Out of many DL architectures, the most popular ones are based on convolutional networks (ConvNets), e.g., CNN, ConvLSTM, and so on(Ronao and Cho 2015; Ordóñez and Roggen 2016; Hammerla et al. 2016; Yang et al. 2015). However, they may suffer from overfitting when with limited data or lack of annotations. Based on ConvNets, several research directions were explored to address this issue, including self-supervised learning (SSL) (Saeed et al. 2019; Tang et al. 2021; Haresamudram et al. 2022; Haresamudram et al. 2020), or data synthesis (Li et al. 2020; Kwon et al. 2020). The major aim of SSL is to learn representation from the unlabeled data by designing pre-training objectives or auxiliary tasks, before fine-tuning to the downstream HAR tasks. In (Saeed et al. 2019) Saeed et al. developped a multi-task SSL scheme, and based on multiple auxiliary tasks (e.g., adding random noise, varying sampling rate), the activity representation can be learned and fine tuned with improved performance. In (Haresamudram et al. 2020), a masked reconstruction based SSL was proposed, which demonstrated great improvements when compared with other unsupervised learning schemes in HAR tasks. In (Tang et al. 2021), SelfHAR, a semi-supervised framework was proposed, which combined teacher-student self-training to exploit both unlabeled and labeled datasets while allowing for data augmentation, and multi-task self-supervision for improved activity representation learning. Haresamudram et al. comprehensively studied seven state-of-the-art SSL-based approaches on various HAR datasets (Haresamudram et al. 2022). Most recently, SSL was performed on a large-scale unlabeled activity dataset (Yuan et al. 2022) for pre-trained model development, which demonstrated improved performance on other downstream HAR tasks. Moreover, the popular generative models (e.g., GAN) was also explored in (Li et al. 2020) to generate synthetic activity sensor-data to tackle the lack of annotation problems.
2.2. Epoch-wise Bagging Scheme for HAR
To address the lack of annotation issue, Guan and Ploetz proposed a deep LSTM ensemble approach in (Guan and Plötz 2017) for better generalization. In their approach, the epoch-wise bagging scheme was proposed, which can simply generate per-epoch LSTM classifiers with nearly no extra training time cost. The epoch-wise base classifiers were aggregated using a score-level fusion, which is simple and effective for challenging HAR tasks.
However, directly applying the epoch-wise bagging scheme may face the lack of ensemble diversity problem since the base classifiers were generated across epochs using the same network structure. One could use different network structures as base learners (with higher diversity), yet it would substantially increase the training costs. In (Guan and Plötz 2017), it was pointed out that there would be no fusion effect if all the base learners were identical (i.e., zero diversity) and some diversity injection approaches were used to mitigate this problem in the epoch-wise bagging scheme. Different from traditional deep learning approaches, in (Guan and Plötz 2017) some hyper-parameters of LSTM (i.e., initial sampling point, batch size, window/frame length) were modeled as random variables, whose values may vary across different epochs or batches. Although this hyper-parameter modelling strategy may inject some uncertainties for diverse epoch-wise classifier training, they were specifically designed for LSTM models (for sample-wise HAR), and cannot be applied directly to the mainstream ConvNet-based methods like CNN(Yang et al. 2015), ConvLSTM(Morales and Roggen 2016), Attention Model(Murahari and Plötz 2018), etc. Moreover, although LSTM ensemble (Guan and Plötz 2017) may significantly boost the performance (over the single LSTM), the diversity injection procedure is empirical and hasn’t been studied using existing diversity measurement metrics (e.g., Q-Statistic (QS)(Udny Yule 1900)).
In this section, we review previous HAR works for tackling the lack of annotation problem. For ConvNet-based approaches, SSL is one of the major research topics, aiming at learning representation via pre-train objectives or auxiliary tasks from unlabeled data to boost the performance of the downstream (supervised) HAR tasks. In this paper, we try to solve this problem from a different perspective. Instead of employing the unlabeled data, we argue the potentials of the original labeled sensor data haven’t been fully exploited, and our ConvBoost framework can be used to generate high-quality labeled training data for improved HAR. It is worth noting that although the proposed ConvBoost framework is motivated by the epoch-wise bagging scheme (Guan and Plötz 2017), its focus is per-epoch (labeled) training data generation, making it a very flexible and extensible solution.
3. The ConvBoost Framework
In contrast to epoch-wise bagging scheme (Guan and Plötz 2017), our ConvBoost framework is designed for mainstream HAR ConvNets, and the underlying mechanism is to create per-epoch training frames in three conceptual layers via dense-sampling, synthesizing, and simulating operations. The training-frame generation nature makes it a flexible scheme that can be applicable to various ConvNet types. The proposed three conceptual layers are Sampling Layer, Data Augmentation Layer, and Resilient Layer, and for each layer a booster is developed for per-epoch training frames generation, which are listed as follows:
- (1)
Sampling Layer: in this layer we propose Random Framing (R-Frame) booster, which can be deemed as an epoch-wise dense-sampling approach, in contrast to traditional one-off sliding window method.
- (2)
Data Augmentation Layer: in this layer we apply mix-up booster, which can synthesize virtual data via interpolation (Zhang et al. 2017).
- (3)
Resilient Layer: in this layer we randomly drop some sensor channels (i.e., Channel Dropout or C-Drop for short) to simulate the problematic sensor signals for diverse training frames.
Note these three layers are not limited to these three boosters (i.e., R-Frame, mix-up, and C-Drop), which can be used solely or jointly, or even replaced by other advanced boosters. In the experimental section, we also study the performance gain achieved by booster combinations.
3.1. Random Framing (R-Frame) Booster in Sampling Layer
For many HAR systems, sliding window is a standard procedure, which converts long signal sequences into short, individual frames for classification. For ConvNet-based HAR, these frames are normally shuffled before each training epoch. However, DL-based approaches are notoriously data-hungry, and they often suffer from overfitting in scenarios where there is only limited amounts of labeled sample data available for model training, which is a common problem in HAR. Although the per-epoch shuffling operation may reduce the overfitting effect to some extent, it is limited, since the overall training frames–constructed by the one-off sliding window–is a fixed set, which is problematic especially when training large ConvNets.
To address this issue, here we propose a ’Random Framing (R-Frame) booster’ in the Sampling Layer, which can generate per-epoch dynamic frame sets, in contrast to a fixed frame set produced by traditional sliding window. In Figure 2, we show both frame-generation approaches for ConvNets. Compared to traditional sliding window, we see:
- •
R-Frame introduces a variable, namely epoch-wise random offset , based on which a dynamic training set (in frames) can be constructed in every training epoch.
- •
For each training epoch, bootstrapping is also applied to further improve the data diversity.
Given these properties (e.g., epoch-wise dynamic training-frame-generation), the proposed R-Frame can be an effective alternative to the traditional sliding window to train epoch-wise ConvNets. Given a long signal sequence, the per-epoch training set (in the epoch) can be generated as follows:
- (1)
generate a random offset , where is the window/frame length and is the floor operation;
- (2)
remove the first timestamps of signals from the original long sequence;
- (3)
perform standard sliding window approach, yielding the initial training frames;
- (4)
bootstrapping (i.e., random sampling with replacement) on the initial training frames to form the epoch’s training frames .
Since the random offset varies over epochs, we have different epoch-wise training frames, and by applying bootstrapping(i.e., step (4)) we further enrich the data diversity for robust ConvNet training.
In essence, R-Frame can be deemed as a special sliding window approach with additional dense-sampling strategy (i.e., based on the epoch-wise offset and bootstrapping) and it serves as the core part in the Sampling Layer of our ConvBoost framework. R-frame can yield various training frames at each epoch, and this characteristic makes it especially suitable for the epoch-wise ConvNet training.
3.2. Mix-up Booster in Data Augmentation Layer
For the Sampling Layer, we propose an R-Frame booster, which introduces epoch-wise random offset and bootstrapping strategy to generate additional training frames, in contrast to the traditional sliding window counterpart. However, in essence it is a dense sampling approach and has its own upper limit. To further enrich the data diversity, we additionally use data synthesis approaches. In our ConvBoost framework we define a Data Augmentation Layer, where we use the popular mix-up strategy (Zhang et al. 2017) as a booster to generate virtual training frames.
Given any two training frames () and (), the virtual frame can be generated via a linear interpolation operation:
| (1) |
with two labels and , where is the mixing ratio sampled from Beta distribution(Zhang et al. 2017) parameterized by , which controls the strength of interpolation. With the generated virtual training frame and two labels , , we can calculate the corresponding joint cross-entropy loss via a weighted sum operation:
| (2) |
In this work, the mix-up booster is employed at the training batch-level, and we set the number of the virtual frames the same as the batch size.
3.3. Channel Dropout (C-Drop) Booster in Resilient Layer
In the Sampling and Data Augmentation Layers, we develop two boosters, which can create additional training frames via dense sampling and data synthesis. From the perspective of sensor data’s characteristics, it is also sensible to increase the data diversity by simulating the problematic signals, which can also make the trained model resilient to certain level of signal noises. Therefore, in our ConvBoost framework, we design a Resilient Layer, and use the Channel Dropout (C-Drop) booster, which can randomly set some channels to zeros, as shown in Figure 3.
Although dropping some channels may increase the diversity of the training data, note that the percentage of the dropped channels is a hyper-parameter and should not be too large. In this work, for each training batch we empirically set it as a random number ranging from , which means only a small number of channels are set to zeros. We expect C-Drop booster can simulate some characteristics of sensor data in real-world cases, and also increase the data diversity for robust ConvNet training.
3.4. ConvBoost for Human Activity Recognition
In our ConvBoost framework, we design three conceptual layers, namely Sampling Layer, Data Augmentation Layer, and Resilient Layer, based on which we develop the corresponding boosters to create more diverse training frames for robust ConvNet development.
In algorithm 1, we describe how to train ConvNets using proposed ConvBoost framework. Specifically, by applying the boosters in the proposed layers, we can generate per-epoch training frames, based on which epoch-wise HAR classifiers can be trained. Without loss of generality, our framework outputs all the epoch-wise classifiers for HAR tasks, as shown in algorithm 1. It is a flexible framework and can be used directly by selecting the best epoch-wise classifier based on validation–Single-Best–or via Ensemble (Guan and Plötz 2017). Both schemes are studied in the experimental section.
For the Ensemble scheme, similar to (Guan and Plötz 2017), based on validation data, we can choose best base learners for aggregation. For a query data , the classification probability distribution of the model can be written as , and via a simple score-level fusion we can further get the final aggregated score :
| (3) |
and predicted activity will be assigned to the one with the largest probability over the classes, i.e., .
for to do
Shuffling and Constructing batches
for to B do
Data Augmentation Layer: Applying Mix-up Booster (Sec. 3.2)
Model Training (via Backpropagation) end for
4. Experimental Evaluation
4.1. Datasets
To evaluate the effectiveness of our method, we used three public datasets: i) Opportunity (OPP) (Chavarriaga et al. 2013); ii) Physical Activity Monitoring (PAMAP2) dataset (Reiss and Stricker 2012); and iii) Growing Old Together Validation (GOTOV) (Paraschiakos et al. 2020) dataset. The activities to be recognized for each dataset are shown in Figure 4.

4.1.1. Opportunity (OPP) (Chavarriaga et al. 2013)
The OPP dataset is one of the most challenging wearable-based HAR dataset, which exhibits imbalanced class distributions (as shown in Figure 4). It includes 18 daily kitchen activities (collected from five runs of four subjects) such as opening the door or closing the drawer, at a sampling rate of 30 Hz. Following (Hammerla et al. 2016; Guan and Plötz 2017), we employed the hold-out evaluation protocol. That is, the second run from subject 1 was used for validation, runs 4 and 5 from subjects 2 and 3 were used as test while the rest data were used for training. Following (Hammerla et al. 2016; Guan and Plötz 2017), 79-dimensional IMU recordings were used for our experiments.
4.1.2. Physical Activity Monitoring Dataset (PAMAP2) (Reiss and Stricker 2012)
The PAMAP2 dataset is one of the most widely used wearable-based HAR dataset, which includes 12 daily activities (collected from nine subjects) such as running, walking, lying, sitting, etc. The dataset includes IMU recordings from hand, chest and ankle with accelerometer, gyroscope, magnetometer, temperature and heart rate information, with a total of 52 dimensions. We employed the hold-out evaluation protocol from (Hammerla et al. 2016; Guan and Plötz 2017), that is, the runs 1 and 2 from subject five were used for validation, runs 1 and 2 from the sixth subject were used as test, while the remaining data was used for training.
4.1.3. Growing Old Together Validation (GOTOV) (Paraschiakos et al. 2020)
GOTOV is one of the most recent HAR dataset, with activities collected from older-age subjects. It has 16 daily activities collected from thirty-five participants. The subjects were instructed to wear accelerometer sensors at three locations: ankle, chest and wrist with a 9-dimensional recording, at the sampling rate of 83Hz (Paraschiakos et al. 2020). In our study, we removed six participants who did not wear the sensors completely and used the rest twenty-nine subjects for our experiments. Hold-out evaluation was employed and we used data from subjects 9, 13, 20, 30, 31 for validation; subjects 6, 17, 28, 33, 35 for testing and the rest nineteen subjects for training.
4.2. Implementation Details
4.2.1. Networks and Configurations
To boost ConvNets, we employed some most popular backbones: CNN(Yang et al. 2015), convolutional LSTM (ConvLSTM)(Morales and Roggen 2016) and attention model(Murahari and Plötz 2018). For CNN, three convolutional layers (with 256 feature maps per layer) were used, with max-pooling layers in-between, followed by two fully-connected layers (with hidden unit number 128 per layer) connecting to the output nodes. For ConvLSTM, three convolutional layers (with 256 feature maps per layer) were used, with max-pooling layers in-between, followed by two LSTM layers (with hidden unit number 128 per layer) connecting to the output nodes. For Attention Model, four convolutional layers (with 64 feature maps per layer) were used, followed by two LSTM layers (with 128 hidden units per layer)(Ordóñez and Roggen 2016) and an attention layer (Murahari and Plötz 2018). For all hidden units in the three backbone networks, ReLU was used as the activation function.
To train the models, cross entropy loss with Adam optimizer was used. Each model was trained for 100 epochs, and 100 base classifiers were generated via algorithm 1. During training, group normalization (Wu and He 2020) was used, and we set the mini-batch size to 256; dropout was performed before the output layer with ; The learning rate was set to , and we fixed =0.8 for mix-up method. These hyper-parameters were used for all ConvNets across all the datasets.
For OPP, following (Hammerla et al. 2016), the length of the sliding window was set to 1 second, with 50% overlap. We also used 1 second sliding window with 50% overlap on GOTOV dataset. For PAMAP2 dataset, following (Hammerla et al. 2016), we used sliding window in the length of 5.12 seconds with 78% overlap. Following (Guan and Plötz 2017), we normalized each dataset before training/evaluation, i.e., making each channel zero mean and unit variance.
4.2.2. Evaluation Metric
For all experiments, mean F1-score was used to measure the performance, which is defined as:
| (4) |
where stands for the number of classes (activities); For the class, , , denote the number of true positive, false positive, and false negative predictions, respectively. For the statistical significance testing, we used two-tailed independent t-tests with p-values reported, where p 0.05, p 0.01 and p 0.001 correspond to *, ** and ***, respectively (in line with the literature e.g., (Morales and Roggen 2016),(Guan and Plötz 2017)).
4.3. Model Comparison
Based on the OPP, PAMAP2 and GOTOV datasets, we evaluated our ConvBoost framework using state-of-the-art ConvNet backbones from the HAR community: i) CNN (Yang et al. 2015); ii) ConvLSTM (Morales and Roggen 2016); and iii) Attention Model (Murahari and Plötz 2018).
Our ConvBoost framework is motivated by previous work (Guan and Plötz 2017), where per-epoch generated classifiers (i.e., sample-wise stateful LSTMs) were fused for improved HAR. For better fusion effect, hyper-parameters such as window length, batch size, initial sampling point were modelled as random factors to enhance the ensemble diversity. Although the frame-wise ConvNets are different from sample-wise LSTM, based on the idea of epoch-wise bagging and diversity injection, we developed the ConvNet variant of (Guan and Plötz 2017) for comparison, with the implementation details as follows:
| Methods | OPP | PAMAP2 | GOTOV | |
|---|---|---|---|---|
| CNN(Yang et al. 2015) | Original | 61.2 | 81.0 | 74.6 |
| ConvNet variant of (Guan and Plötz 2017)(Single-Best) | 61.51 1.51 | 82.03 3.99 | 74.79 1.83 | |
| ConvNet variant of (Guan and Plötz 2017)(Ensemble) | 65.61 1.23 | 85.25 3.41 | 76.67 1.21 | |
| Proposed ConvBoost (Single-Best) | 69.10 1.57 | 89.92 1.79 | 79.51 1.33 | |
| Proposed ConvBoost (Ensemble) | 70.53 0.81 | 90.05 0.56 | 80.99 0.88 | |
| ConvLSTM(Morales and Roggen 2016) | Original | 62.2 | 77.7 | 72.0 |
| ConvNet variant of (Guan and Plötz 2017)(Single-Best) | 62.24 1.67 | 80.03 3.07 | 72.36 2.67 | |
| ConvNet variant of (Guan and Plötz 2017)(Ensemble) | 65.50 1.11 | 83.47 3.49 | 74.33 1.56 | |
| Proposed ConvBoost (Single-Best) | 68.22 1.99 | 89.37 1.90 | 77.44 1.51 | |
| Proposed ConvBoost (Ensemble) | 71.24 0.96 | 90.26 0.40 | 78.95 1.01 | |
| Att. Model(Murahari and Plötz 2018) | Original | 64.1 | 88.1 | 72.4 |
| ConvNet variant of (Guan and Plötz 2017)(Single-Best) | 64.05 1.06 | 88.58 3.41 | 72.24 1.89 | |
| ConvNet variant of (Guan and Plötz 2017)(Ensemble) | 67.58 1.23 | 89.88 2.95 | 74.68 1.51 | |
| Proposed ConvBoost (Single-Best) | 71.05 1.18 | 89.57 2.21 | 80.08 0.96 | |
| Proposed ConvBoost (Ensemble) | 72.81 0.76 | 89.90 0.57 | 81.66 0.72 | |
- •
ConvNet variant of (Guan and Plötz 2017) (Ensemble): The epoch-wise bagging strategy was applied to the (frame-wise) ConvNet backbone. For each training epoch, we applied bootstrapping for diversity injection, i.e., we randomly sample the frames with replacement, which will result in about 36.8% (Chernick and LaBudde 2014) of the frames not being used (per epoch), yielding diverse epoch-wise base classifiers. In the Ensemble mode, following (Guan and Plötz 2017), the 20 best epoch-wise classifiers were selected (via validation set) for score-level fusion.
- •
ConvNet variant of (Guan and Plötz 2017) (Single-Best): This is a special case of the Ensemble mode, where only the best base classifier was selected (via validation set) for HAR.
In both Ensemble and Single-Best modes, we compared the ConvNet variants of (Guan and Plötz 2017) with our ConvBoost framework:
- •
Proposed ConvBoost (Ensemble): The proposed 3-layer framework with the following three boosters, R-Frame, Mix-up and C-Drop; Likewise, in the Ensemble mode, the 20 best epoch-wise classifiers were selected (via validation set) for score-level fusion. It is worth noting that ConvNet variant of (Guan and Plötz 2017) is a special case of our ConvBoost when without boosters, i.e., without additional generated training frames.
- •
Proposed ConvBoost (Single-Best): Only the best base classifier within the ConvBoost Ensemble was used (via validation set) for HAR.
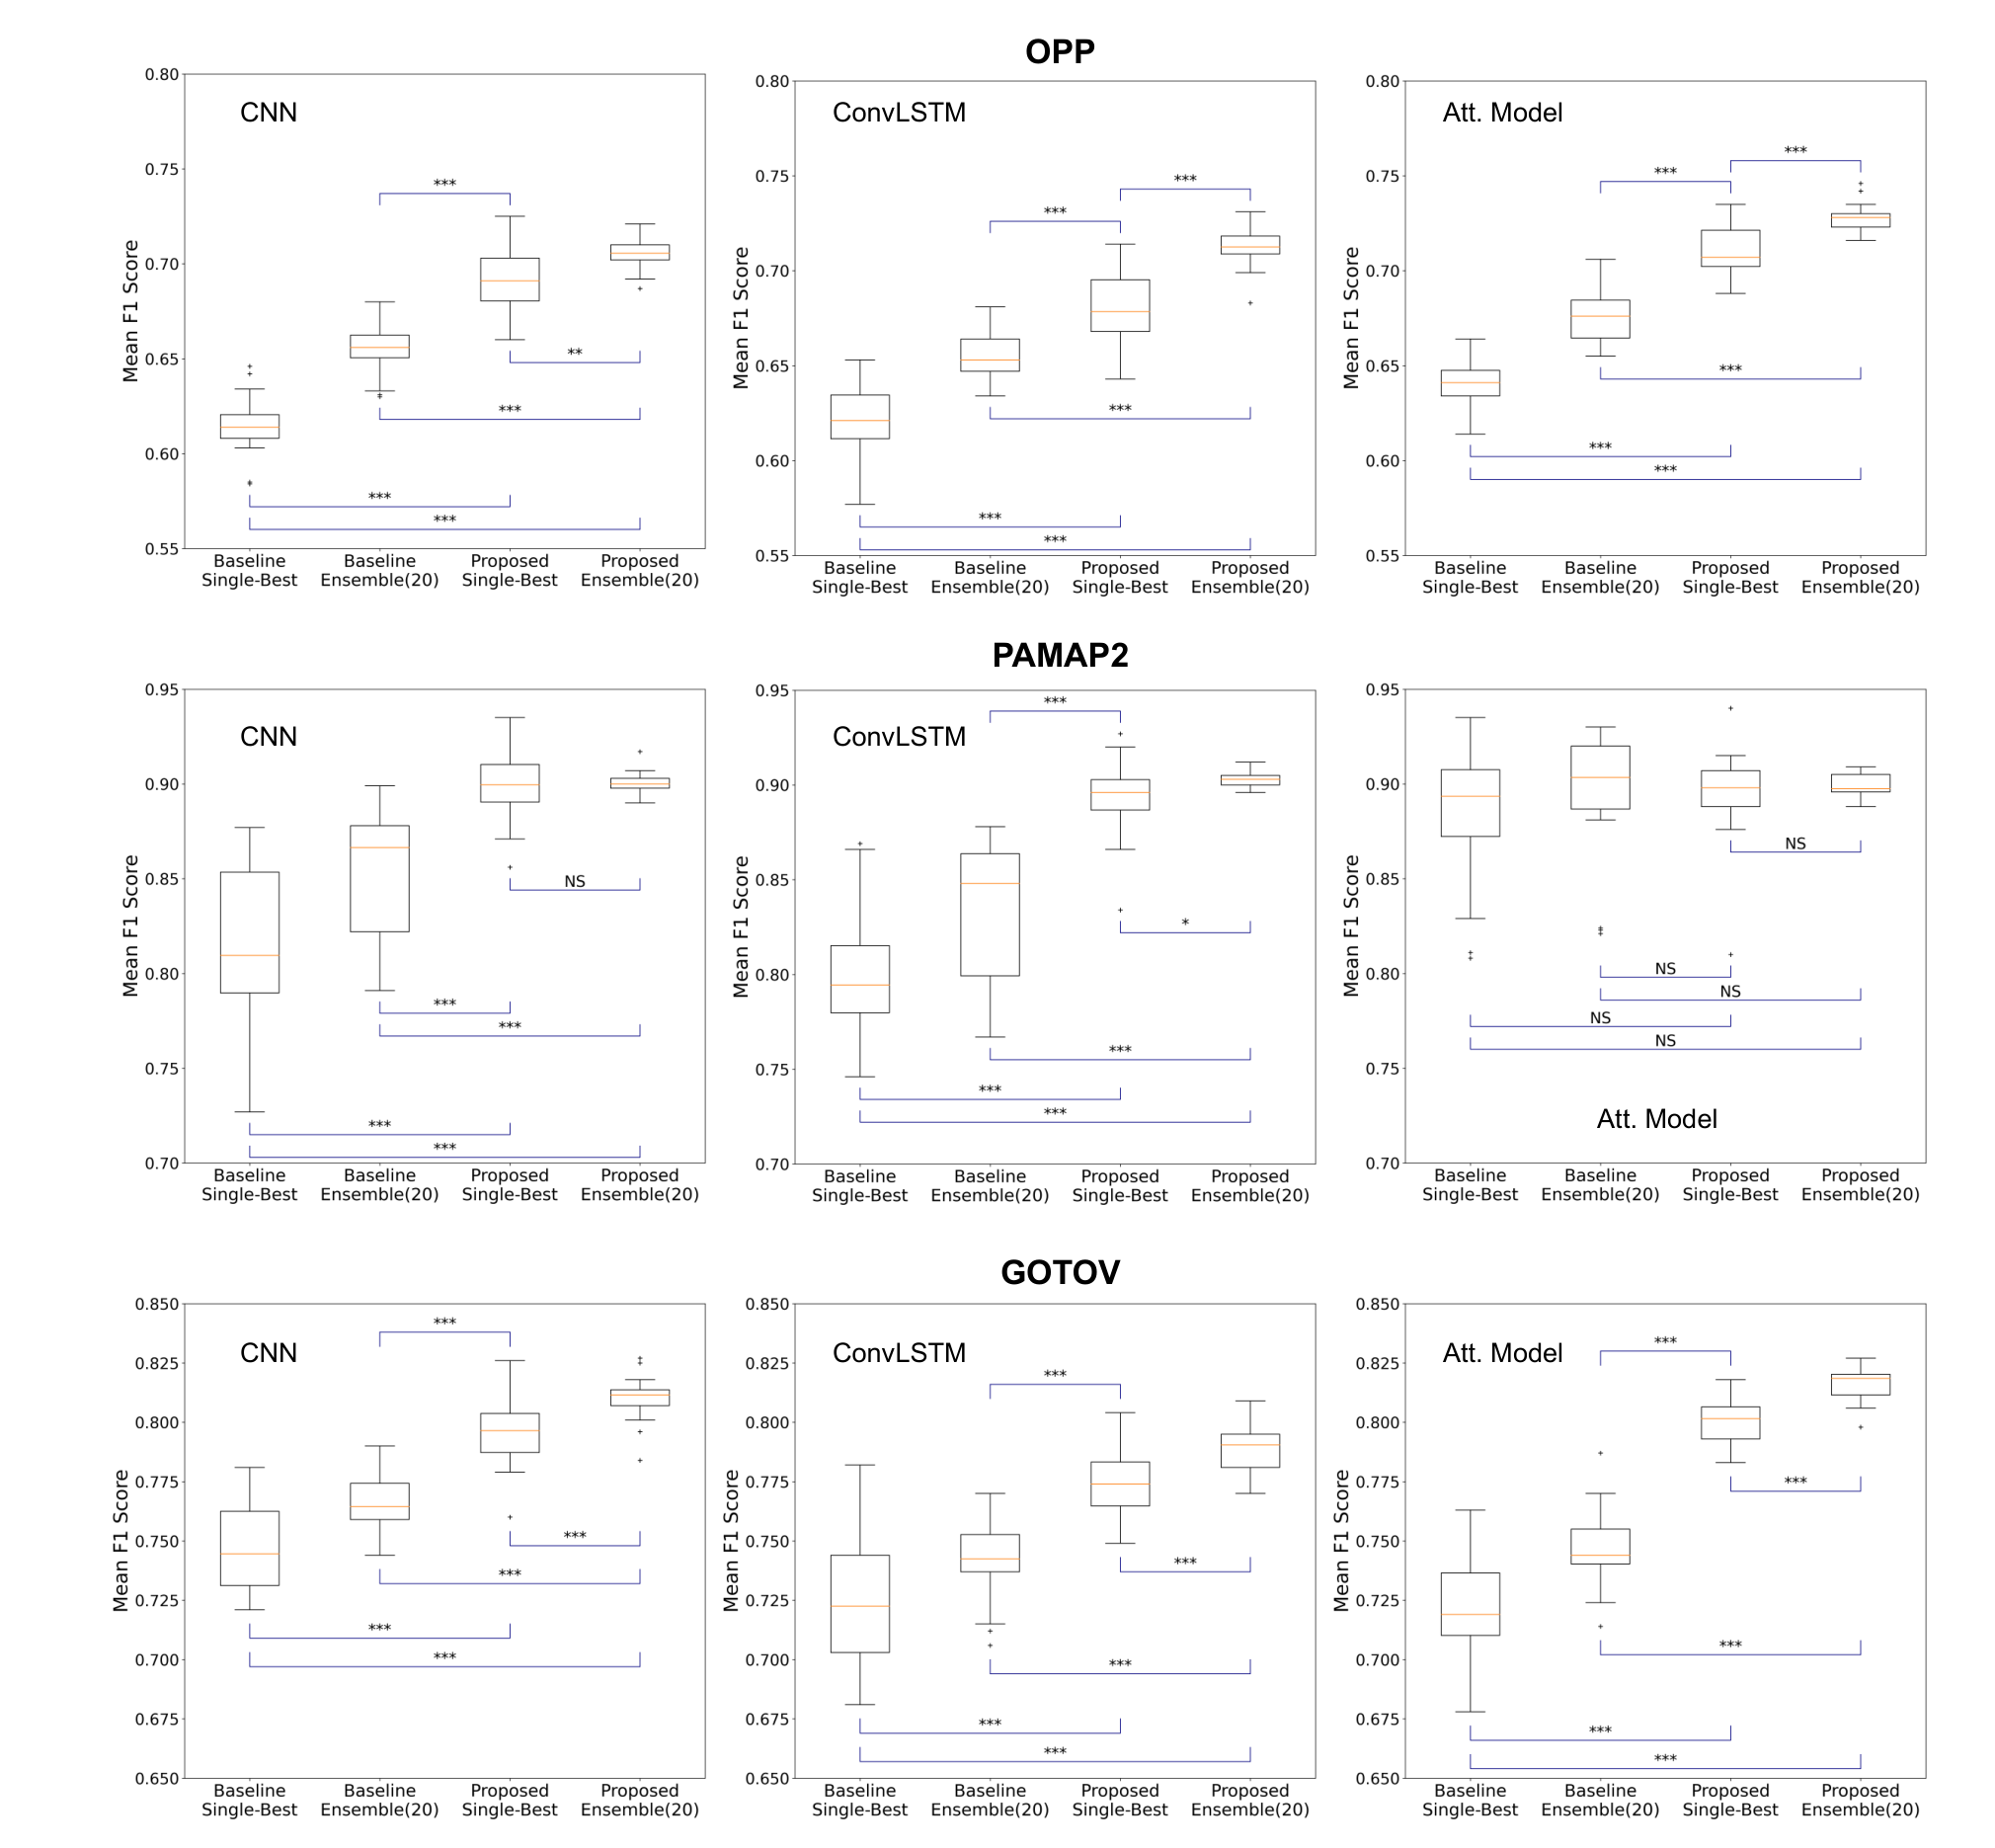
Based on the aforementioned ConvNet backbones (CNN (Yang et al. 2015), ConvLSTM (Morales and Roggen 2016), and Attention Model (Murahari and Plötz 2018)), we report the results of: i) the Proposed ConvBoost; ii) ConvNet variants of (Guan and Plötz 2017); as well as iii) the original ConvNet baselines in Table 1. For the Proposed ConvBoost and the ConvNet variants of (Guan and Plötz 2017), both the results of Ensemble and Single-Best modes are reported. Since there are random factors in the training process, we ran each model for 20 repetitions and report the corresponding mean and standard deviation.
From Table 1, we can see–compared to the original backbone ConvNets–generally it is beneficial to apply the epoch-wise bagging strategy (Guan and Plötz 2017) to ConvNets. Based on the developed ConvNet variant of (Guan and Plötz 2017), we can see although Single-Best only has comparable performance, substantial performance gain can be achieved in the Ensemble mode.
However, the potential of the epoch-wise bagging scheme may not be fully exploited when with inadequate, i.e., too little, training data. Our ConvBoost framework can provide an simple yet effective solution, based on which the additional training frames can be generated via three conceptual layers, i.e., Sampling Layer, Data Augmentation Layer, and Resilient Layer. From Table 1, we can see with the generated additional training data, significant performance improvements can be achieved, when compared to the Single-Best/Ensemble counterparts of ConvNet varants of (Guan and Plötz 2017), on all the three datasets, irrespective of backbone ConvNets. It is worth noting that based on our ConvBoost, single classifier (i.e., Single-Best) can outperform classifier fusion method (i.e., Ensemble of ConvNet variant of (Guan and Plötz 2017)), especially in the challenging datasets (e.g., OPP, and GOTOV), indicating effectiveness of our ConvBoost framework, which can fully take advantage of the epoch-wise bagging scheme via generating additional training frames via its three different conceptual layers.
We also conducted the statistical significance testing on the four methods (i.e., Single-Best and Ensemble modes of our ConvBoost and ConvNet variant of (Guan and Plötz 2017)), and the corresponding box-plots are provided in Figure 5. It becomes clear that the results are in line with the previous observations in Table 1. From Figure 5 we notice for the PAMAP2 dataset, with Attention Model backbone, all the results of the four methods are not significantly different, with (in ) ranging from (Single-Best of ConvNet variant of (Guan and Plötz 2017)) to (Proposed ConvBoost Ensemble). One possible explanation can be the high-performance of the backbone (88.1 in of Attention Model on PAMAP2 dataset), which may hit the upper limit of the performance on this dataset11 1 More results can be found in Appendix including a) leave-one-subject-out setting on PAMAP2 dataset ( Table 3); b) Confusion matrices ( Figure 9). On the more challenging datasets (i.e., OPP and GOTOV datasets), the performance gains are significant for our approach irrespective of Single-Best or Ensemble mode. For example, with Attention Model as backbone, our ConvBoost (Ensemble) leads to about , and performance gains over the ConvNet variant of (Guan and Plötz 2017) (Ensemble) on GOTOV dataset and OPP dataset respectively, indicating the effectiveness of the proposed ConvBoost framework on challenging HAR scenarios.
Generally, for the epoch-wise training schemes, i.e., our ConvBoost or the ConvNet variant of (Guan and Plötz 2017), we can observe the Ensemble mode tends to perform better than the Single-Best counterpart, indicating the generalization capability of classifier fusion. One the other hand, our 3-layer ConvBoost framework can generate additional informative training frames, based on which even single classifiers can also yield very competitive performance. As shown in Figure 5, the Single-Best (ConvBoost) can benefit significantly from the additional training data, and it can substantially outperform Ensemble when without such generated data (i.e., ConvNet variant of (Guan and Plötz 2017)). This observation suggests the significant contribution of the training-frame-generation mechanism of our ConvBoost framework via 3 different layers/boosters, suggesting it is an important direction for robust HAR model development.
Since the Ensemble mode of our ConvBoost framework can yield the best performance, unless stated otherwise, we use it as the default model for the rest of this paper.
4.4. Ablation Study
Based on the ConvBoost Ensemble, we also conducted a number of ablation studies to: i) better understand the performance gain contributed by each booster (in the corresponding layer); and ii) better understand how booster can change the properties of the ensemble in terms of diversity and expected performance of base classifiers. Note all the experiments in this subsection were conducted on the OPP dataset.


4.4.1. On the Effectiveness of Boosters
In our 3-layer ConvBoost framework, the three boosters (R-Frame, Mix-up, and C-Drop) are the core components, aiming at generating various training frames at different stages. To better understand the contribution of each booster, we designed some ablation studies and report the results in form of box-plots results in Figure 6. We can observe that the proposed ConvBoost Ensemble with all the 3 boosters (i.e., with R-Frame, Mix-up, and C-Drop) yields the best results, much higher than Baseline Ensemble (i.e., ConvNet variant of (Guan and Plötz 2017), with no booster) or the ones with single booster, indicating the complementary nature of these boosters. The three boosters can generate additional training data from very different perspectives, e.g., via dense-sampling in Sampling Layer, via interpolation/synthesis in Data Augmentation Layer, and via sensor data simulation in Resilient Layer, respectively. These different types of booster-generated data tend to be less correlated, yielding very promising combining results when used as a whole.
It can also be observed that the application of single booster can generally improve the performance significantly irrespective of ConvNets. The only exception is the Attention Model backbone with C-Drop booster, which has comparable performance with the Baseline Ensemble (i.e., no booster). Nevertheless, it is still beneficial to use other two boosters (i.e., R-Frame and Mix-up) with improved results.


4.4.2. Ensemble Analysis
For ensembles, generally higher level of diversity (among the base classifiers) tends to yield better fusing results (Zhou 2019; Liu et al. 2019; Jackowski 2018; Kuncheva and Whitaker 2003). To measure the diversity, in this work we use two metrics, namely, the Q-Statistic (QS)(Udny Yule 1900), and cosine-similarity of the model parameters (i.e., CS). QS exploits the predicted labels (from the base classifier pairs) to measure diversity, while CS directly measures the similarity of the pair-wise model parameters without any prediction process. More details of QS can be found in the Appendix. For both metrics, higher values (with a maximum value of 1) indicate lower diversity.
The performance of base classifiers is also key to the ensemble, and previous works suggested ensemble’s performance can be boosted by strengthening base classifiers (Guan et al. 2013; Guan et al. 2014). Here we measure both diversity (in CS/QS) and base classifiers’ expected performance (in ) and report the results in Figure 7. We can see the CS/QS values are constantly high, indicating lower diversity irrespective of boosters or backbones. One possible explanation is that the models were generated in an epoch-wise manner, resulting in higher level of similarity (with lower diversity). One alternative to increase the ensemble diversity is to employ different network structures, e.g., fusing CNN, LSTM, or ConvLSTM, etc. yet it is less practical since the training cost can be much higher than epoch-wise training strategies.
From Figure 7 we can also see for all the three ConvNet backbones, the base classifiers can be strengthened by the three boosters, and the expected performance (in ) of base classifiers is in line with the corresponding ensemble performance (as shown in Figure 6).
These observations suggest the performance gains are mainly from the strengthened base classifiers, instead of ensemble diversity. This finding can explain the superior performance of our ConvBoost’s Single-Best mode, whose performance are only slightly lower the the corresponding Ensemble mode (as shown in Table 1), and it highlights the importance of training data generation under the proposed framework.
4.5. Extensions of the ConvBoost Framework
The proposed ConvBoost is an extensible framework, and in this subsection we demonstrate two possible extensions by: i) adding extra boosters; and ii) compressing ConvBoost Ensemble.
4.5.1. Extra Booster(s)
In our 3-layer ConvBoost framework, three boosters are used to generate training frames from different perspectives. Experimental results in the ablation studies suggest their complementary nature and effectiveness of combining them. It is also interesting to explore extra boosters for improved performance, and based on our 3-layer ConvBoost structure, we designed experiments with simple additional boosters:
- (1)
Experiment 1: We additionally add R-Frame∗, i.e., R-Frame followed by Mix-up in the Data Augmentation Layer.
- (2)
Experiment 2: we additionally add scaling operation (Um et al. 2017) in the Resilient Layer.
Based on the OPP dataset, in Table 2 we compare their performance with Baseline Ensemble (i.e., ConvNet variant of (Guan and Plötz 2017), no booster) and the proposed ConvBoost Ensemble (with 3 boosters, or different combinations of 2 boosters). We can see with these simple extra boosters, the performance can be further improved to some extent, suggesting the extensibility of the ConvBoost framework. To further boost the performance, one may design more complementary boosters or layers that are less correlated to the existing ones under this ConvBoost framework. For example, most recently it was found that context information can also be combined into frame-wise ConvNets (Pellatt and Roggen 2020) as additional information, and in the future we will incorporate this context-aware idea into our ConvBoost framework for booster/layer design.
From Table 2, it is also worth noting that within our ConvBoost framework, the ConvNet variant of (Guan and Plötz 2017) (referred to Baseline Ensemble in the table) can be deemed as a special case when with no boosters. Without additional generated training data, it has lowest performance than other ones with more boosters.
| Methods | Layers (with boosters) | Backbones | ||||
| Sampling Layer | Data Aug. Layer | Resilient Layer | CNN | ConvLSTM | Att. Model | |
| Baseline Ensemble | - | - | - | 65.61 1.23 | 65.50 1.11 | 67.58 1.23 |
| ConvBoost Ensemble | R-Frame | Mix-up | - | 69.86 0.88 | 70.27 0.94 | 71.86 1.11 |
| ConvBoost Ensemble | - | Mix-up | C-Drop | 66.65 1.18 | 67.53 1.10 | 71.28 1.01 |
| ConvBoost Ensemble | R-Frame | - | C-Drop | 69.46 0.94 | 69.58 0.74 | 70.43 0.98 |
| ConvBoost Ensemble | R-Frame | Mix-up | C-Drop | 70.53 0.81 | 71.24 0.96 | 72.81 0.76 |
| Exp. 1 | R-Frame | Mix-up; R-Frame∗ | C-Drop | 71.21 1.03 | 71.39 1.05 | 73.01 0.88 |
| Exp. 2 | R-Frame | Mix-up | C-Drop; Scaling | 70.71 0.88 | 71.66 0.70 | 73.07 1.12 |
4.5.2. Compression in ConvBoost Ensemble
When in Ensemble mode, it is necessary to explore ensemble compression for efficient applications. Here we simply average the models’ parameters, which can reduce the model size by (i.e., from 20 base classifiers to 1 classifier). Due to the lack of diversity in the ensemble (as shown in Figure 7), the model parameters may be regarded as a multivariate Gaussian distribution with low variance in each dimension, and in this case the corresponding mean model serves as light-weight representation for the whole distribution (the ensemble).
It is worth pointing out this idea is very similar to the recent proposed model soup (Wortsman et al. 2022), where a number of pre-trained models fine-tuned based on different hyper-parameters were averaged for prediction. To the best of our knowledge, there is no feasible pre-trained models in the HAR community that generalize well, and here we employed the parameter averaging idea for ConvBoost Ensemble compression.
On the OPP dataset, we compare the results of the proposed ConvBoost Ensemble, the compressed counterpart (via parameter averaging), and the proposed ConvBoost Single-Best in terms of both performance and model size, as shown in Figure 8. We can see via the simple model averaging, the compressed model has comparable performance with the ensemble counterpart, but with only of the parameters. On the other hand, although ConvBoost Single-Best is also a strong light-weight method (cf. Table 1), the proposed simple compressed ensemble outperforms Single-Best at the same model size irrespective of backbones, suggesting it is a practical solution for light-weight applications. In the future, we will explore more advanced model compression approaches for higher performance in both effectiveness and efficiency.

4.5.3. Potential Applications and Future Work
In our 3-layer ConvBoost framework, we design and employ R-Frame, mix-up, and C-Drop boosters for ConvNet-based HAR. Out of them, R-Frame and mix-up are generic, while C-Drop is domain-specific that is designed to simulate the problematic sensor data. We observed the performance of our ConvBoost is very competitive even only with the generic boosters ( i.e., R-Frame and mix-up boosters here), and this indicates the great potentials of our framework on the general time-series analysis applications. For various application, under the ConvBoost framework one can focus on designing domain-specific boosters for performance enhancement.
Although we demonstrated our ConvBoost framework can exploit the potentials of (limited) labeled sequential sensor data, all the boosters were developed to facilitate supervised learning. In the future, we will explore how to develop boosters for unsupervised learning/self-supervised learning schemes to deal with vast amount of unlabeled data collected in unconstrained environments.
5. Conclusion
We proposed the ConvNet-Boosting (ConvBoost) Framework, which includes three conceptual layers–Sampling Layer, Data Augmentation Layer, and Resilient Layer–aiming at boosting the performance of ConvNet-based HAR models. Within the three conceptual layers, we designed three boosters–R-Frame, Mix-up, and C-Drop–which can generate per-training-epoch additional informative training frames via dense sampling, synthesizing, and simulating operations. With the epoch-wise generated data, the base classifiers trained from each epoch can be effectively strengthened, yielding significant performance gain in both Single-Best and Ensemble modes irrespective of ConvNet types for HAR.
Through our ConvNet, we also re-interpreted previous work on epoch-wise bagging schemes (Guan and Plötz 2017), and developed its ConvNet variant. Through our extensive experiments we found–for the Ensemble mode–that the performance gains were mainly from the strengthened individual (epoch-wise) classifiers, rather than ensemble diversity. In this case, our 3-layer ConvBoost can generate diverse complementary training examples from different perspectives, which substantially enhances the base learners, yielding improved performance in both Ensemble mode and Single-Best mode. We also explored two extensions by adding more boosters and applying compression to ConvBoost Ensemble, and very encouraging initial results were achieved, indicating it is an extensible and flexible solution for various HAR tasks.
Acknowledgments
We would like to thank the anonymous reviewers for their constructive comments that helped improving the quality of this paper.
References
- (1)
- Avci et al. (2010) Akin Avci, Stephan Bosch, Mihai Marin-Perianu, Raluca Marin-Perianu, and Paul Havinga. 2010. Activity recognition using inertial sensing for healthcare, wellbeing and sports applications: A survey. In 23th International conference on architecture of computing systems 2010. VDE, VDE, The Netherlands, 1–10.
- Bai et al. (2020) Lei Bai, Lina Yao, Xianzhi Wang, Salil S Kanhere, Bin Guo, and Zhiwen Yu. 2020. Adversarial multi-view networks for activity recognition. Proceedings of the ACM on Interactive, Mobile, Wearable and Ubiquitous Technologies 4, 2 (2020), 1–22.
- Chavarriaga et al. (2013) Ricardo Chavarriaga, Hesam Sagha, Alberto Calatroni, Sundara Tejaswi Digumarti, Gerhard Tröster, José del R Millán, and Daniel Roggen. 2013. The Opportunity challenge: A benchmark database for on-body sensor-based activity recognition. Pattern Recognition Letters 34, 15 (2013), 2033–2042.
- Chen et al. (2020) Ling Chen, Yi Zhang, and Liangying Peng. 2020. METIER: A deep multi-task learning based activity and user recognition model using wearable sensors. Proceedings of the ACM on Interactive, Mobile, Wearable and Ubiquitous Technologies 4, 1 (2020), 1–18.
- Chernick and LaBudde (2014) Michael R Chernick and Robert A LaBudde. 2014. An introduction to bootstrap methods with applications to R. John Wiley & Sons.
- Gao et al. (2019) Yan Gao, Yang Long, Yu Guan, Anna Basu, Jessica Baggaley, and Thomas Ploetz. 2019. Towards Reliable, Automated General Movement Assessment for Perinatal Stroke Screening in Infants Using Wearable Accelerometers. Proc. ACM Interact. Mob. Wearable Ubiquitous Technol. 3, 1, Article 12 (mar 2019), 22 pages. https://doi.org/10.1145/3314399
- Guan and Plötz (2017) Yu Guan and Thomas Plötz. 2017. Ensembles of Deep LSTM Learners for Activity Recognition Using Wearables. Proc. ACM Interact. Mob. Wearable Ubiquitous Technol. 1, 2, Article 11 (June 2017), 28 pages. https://doi.org/10.1145/3090076
- Guan et al. (2014) Yu Guan, Yunlian Sun, Chang-Tsun Li, and Massimo Tistarelli. 2014. Human gait identification from extremely low-quality videos: an enhanced classifier ensemble method. IET biometrics 3, 2 (2014), 84–93.
- Guan et al. (2013) Yu Guan, Xingjie Wei, Chang-Tsun Li, Gian Luca Marcialis, Fabio Roli, and Massimo Tistarelli. 2013. Combining gait and face for tackling the elapsed time challenges. In 2013 IEEE Sixth International Conference on Biometrics: Theory, Applications and Systems (BTAS). IEEE, IEEE, Coventry, UK, 1–8.
- Hammerla et al. (2015) Nils Yannick Hammerla, James Fisher, Peter Andras, Lynn Rochester, Richard Walker, and Thomas Plötz. 2015. PD disease state assessment in naturalistic environments using deep learning. In Twenty-Ninth AAAI conference on artificial intelligence.
- Hammerla et al. (2016) Nils Y Hammerla, Shane Halloran, and Thomas Ploetz. 2016. Deep, convolutional, and recurrent models for human activity recognition using wearables. IJCAI 2016 (2016).
- Haresamudram et al. (2020) Harish Haresamudram, Apoorva Beedu, Varun Agrawal, Patrick L. Grady, Irfan Essa, Judy Hoffman, and Thomas Plötz. 2020. Masked Reconstruction Based Self-Supervision for Human Activity Recognition (ISWC ’20). Association for Computing Machinery, New York, NY, USA. https://doi.org/10.1145/3410531.3414306
- Haresamudram et al. (2022) Harish Haresamudram, Irfan Essa, and Thomas Plötz. 2022. Assessing the State of Self-Supervised Human Activity Recognition Using Wearables. Proc. ACM Interact. Mob. Wearable Ubiquitous Technol. 6, 3, Article 116 (sep 2022), 47 pages. https://doi.org/10.1145/3550299
- Jackowski (2018) Konrad Jackowski. 2018. New diversity measure for data stream classification ensembles. Engineering Applications of Artificial Intelligence 74 (2018), 23–34.
- Jiang et al. (2015) Lu Jiang, Deyu Meng, Qian Zhao, Shiguang Shan, and Alexander Hauptmann. 2015. Self-paced Curriculum Learning. In AAAI.
- Kuncheva and Whitaker (2003) Ludmila I Kuncheva and Christopher J Whitaker. 2003. Measures of diversity in classifier ensembles and their relationship with the ensemble accuracy. Machine learning 51, 2 (2003), 181–207.
- Kwon et al. (2020) Hyeokhyen Kwon, Catherine Tong, Harish Haresamudram, Yan Gao, Gregory D. Abowd, Nicholas D. Lane, and Thomas Plötz. 2020. IMUTube: Automatic Extraction of Virtual on-Body Accelerometry from Video for Human Activity Recognition. Proc. ACM Interact. Mob. Wearable Ubiquitous Technol. 4, 3, Article 87 (sep 2020), 29 pages. https://doi.org/10.1145/3411841
- Ladha et al. (2013) Cassim Ladha, Nils Y Hammerla, Patrick Olivier, and Thomas Plötz. 2013. ClimbAX: skill assessment for climbing enthusiasts. In Proceedings of the 2013 ACM international joint conference on Pervasive and ubiquitous computing. 235–244.
- Li et al. (2020) Xi’ang Li, Jinqi Luo, and Rabih Younes. 2020. ActivityGAN: Generative adversarial networks for data augmentation in sensor-based human activity recognition. In Adjunct Proceedings of the 2020 ACM International Joint Conference on Pervasive and Ubiquitous Computing and Proceedings of the 2020 ACM International Symposium on Wearable Computers. 249–254.
- Liu et al. (2019) L Liu, W Wei, KH Chow, M Loper, E Gursoy, S Truex, and Y Wu. 2019. Deep Neural Network Ensembles against Deception: Ensemble Diversity. Accuracy and Robustness. arXiv 1908 (2019).
- Meyer et al. (2021) Johannes Meyer, Adrian Frank, Thomas Schlebusch, and Enkeljeda Kasneci. 2021. A CNN-based Human Activity Recognition System Combining a Laser Feedback Interferometry Eye Movement Sensor and an IMU for Context-aware Smart Glasses. Proceedings of the ACM on Interactive, Mobile, Wearable and Ubiquitous Technologies 5, 4 (2021), 1–24.
- Morales and Roggen (2016) Francisco Javier Ordóñez Morales and Daniel Roggen. 2016. Deep convolutional feature transfer across mobile activity recognition domains, sensor modalities and locations. In Proceedings of the 2016 ACM International Symposium on Wearable Computers. 92–99.
- Münzner et al. (2017) Sebastian Münzner, Philip Schmidt, Attila Reiss, Michael Hanselmann, Rainer Stiefelhagen, and Robert Dürichen. 2017. CNN-based sensor fusion techniques for multimodal human activity recognition. In Proceedings of the 2017 ACM International Symposium on Wearable Computers. 158–165.
- Murahari and Plötz (2018) Vishvak S. Murahari and Thomas Plötz. 2018. On Attention Models for Human Activity Recognition. In Proceedings of the 2018 ACM International Symposium on Wearable Computers (Singapore, Singapore) (ISWC ’18). Association for Computing Machinery, New York, NY, USA, 100–103. https://doi.org/10.1145/3267242.3267287
- Ordóñez and Roggen (2016) Francisco Javier Ordóñez and Daniel Roggen. 2016. Deep Convolutional and LSTM Recurrent Neural Networks for Multimodal Wearable Activity Recognition. Sensors 16, 1, Article 115 (2016). https://doi.org/10.3390/s16010115
- Paraschiakos et al. (2020) Stylianos Paraschiakos, Ricardo Cachucho, Matthijs Moed, Diana van Heemst, Simon Mooijaart, Eline P Slagboom, Arno Knobbe, and Marian Beekman. 2020. Activity recognition using wearable sensors for tracking the elderly. User Modeling and User-Adapted Interaction 30, 3 (2020), 567–605.
- Pellatt and Roggen (2020) Lloyd Pellatt and Daniel Roggen. 2020. CausalBatch: Solving Complexity/Performance Tradeoffs for Deep Convolutional and LSTM Networks for Wearable Activity Recognition. In Adjunct Proceedings of the 2020 ACM International Joint Conference on Pervasive and Ubiquitous Computing and Proceedings of the 2020 ACM International Symposium on Wearable Computers (Virtual Event, Mexico) (UbiComp-ISWC ’20). Association for Computing Machinery, New York, NY, USA, 272–277. https://doi.org/10.1145/3410530.3414365
- Plötz and Guan (2018) Thomas Plötz and Yu Guan. 2018. Deep learning for human activity recognition in mobile computing. Computer 51, 5 (2018), 50–59.
- Plötz et al. (2012) Thomas Plötz, Nils Y Hammerla, Agata Rozga, Andrea Reavis, Nathan Call, and Gregory D Abowd. 2012. Automatic assessment of problem behavior in individuals with developmental disabilities. In Proceedings of the 2012 ACM conference on ubiquitous computing. 391–400.
- Reiss and Stricker (2012) Attila Reiss and Didier Stricker. 2012. Introducing a new benchmarked dataset for activity monitoring. In 2012 16th international symposium on wearable computers. IEEE, 108–109.
- Ronao and Cho (2015) Charissa Ann Ronao and Sung-Bae Cho. 2015. Deep convolutional neural networks for human activity recognition with smartphone sensors. In International Conference on Neural Information Processing. Springer, 46–53.
- Saeed et al. (2019) Aaqib Saeed, Tanir Ozcelebi, and Johan Lukkien. 2019. Multi-Task Self-Supervised Learning for Human Activity Detection. Proc. ACM Interact. Mob. Wearable Ubiquitous Technol. 3, 2, Article 61 (jun 2019), 30 pages. https://doi.org/10.1145/3328932
- Sekiguchi et al. (2020) Ryoichi Sekiguchi, Kenji Abe, Takumi Yokoyama, Masayasu Kumano, and Masaki Kawakatsu. 2020. Ensemble learning for human activity recognition. In Adjunct proceedings of the 2020 ACM international joint conference on pervasive and ubiquitous computing and proceedings of the 2020 ACM international symposium on wearable computers. 335–339.
- Tan et al. (2022) Tan-Hsu Tan, Jie-Ying Wu, Shing-Hong Liu, and Munkhjargal Gochoo. 2022. Human activity recognition using an ensemble learning algorithm with smartphone sensor data. Electronics 11, 3 (2022), 322.
- Tang et al. (2021) Chi Ian Tang, Ignacio Perez-Pozuelo, Dimitris Spathis, Soren Brage, Nick Wareham, and Cecilia Mascolo. 2021. Selfhar: Improving human activity recognition through self-training with unlabeled data. ACM IMWUT (2021).
- Udny Yule (1900) G Udny Yule. 1900. On the Association of Attributes in Statistics: With Illustrations from the Material of the Childhood Society, &c. Philosophical Transactions of the Royal Society of London Series A 194 (1900), 257–319.
- Um et al. (2017) Terry T Um, Franz MJ Pfister, Daniel Pichler, Satoshi Endo, Muriel Lang, Sandra Hirche, Urban Fietzek, and Dana Kulić. 2017. Data augmentation of wearable sensor data for parkinson’s disease monitoring using convolutional neural networks. In Proceedings of the 19th ACM international conference on multimodal interaction. 216–220.
- Wang et al. (2018) Jiwei Wang, Yiqiang Chen, Yang Gu, Yunlong Xiao, and Haonan Pan. 2018. SensoryGANs: an effective generative adversarial framework for sensor-based human activity recognition. In 2018 International Joint Conference on Neural Networks (IJCNN). IEEE, 1–8.
- Wortsman et al. (2022) Mitchell Wortsman, Gabriel Ilharco, Samir Yitzhak Gadre, Rebecca Roelofs, Raphael Gontijo-Lopes, Ari S Morcos, Hongseok Namkoong, Ali Farhadi, Yair Carmon, Simon Kornblith, et al. 2022. Model soups: averaging weights of multiple fine-tuned models improves accuracy without increasing inference time. arXiv preprint arXiv:2203.05482 (2022).
- Wu and He (2020) Yuxin Wu and Kaiming He. 2020. Group Normalization. International Journal of Computer Vision 128 (2020). Issue 3. https://doi.org/10.1007/s11263-019-01198-w
- Yaguchi et al. (2020) Kei Yaguchi, Kazukiyo Ikarigawa, Ryo Kawasaki, Wataru Miyazaki, Yuki Morikawa, Chihiro Ito, Masaki Shuzo, and Eisaku Maeda. 2020. Human Activity Recognition Using Multi-Input CNN Model with FFT Spectrograms. In Adjunct Proceedings of the 2020 ACM International Joint Conference on Pervasive and Ubiquitous Computing and Proceedings of the 2020 ACM International Symposium on Wearable Computers (Virtual Event, Mexico) (UbiComp-ISWC ’20). Association for Computing Machinery, New York, NY, USA, 364–367. https://doi.org/10.1145/3410530.3414342
- Yang et al. (2015) Jian Bo Yang, Minh Nhut Nguyen, Phyo Phyo San, Xiao Li Li, and Shonali Krishnaswamy. 2015. Deep Convolutional Neural Networks on Multichannel Time Series for Human Activity Recognition. In Proceedings of the 24th International Conference on Artificial Intelligence (Buenos Aires, Argentina) (IJCAI’15). AAAI Press, 3995–4001.
- Yuan et al. (2022) Hang Yuan, Shing Chan, Andrew P. Creagh, Catherine Tong, David A. Clifton, and Aiden Doherty. 2022. Self-supervised Learning for Human Activity Recognition Using 700,000 Person-days of Wearable Data. arXiv:2206.02909 [eess.SP]
- Zhai et al. (2020) Bing Zhai, Ignacio Perez-Pozuelo, Emma A. D. Clifton, Joao Palotti, and Yu Guan. 2020. Making Sense of Sleep: Multimodal Sleep Stage Classification in a Large, Diverse Population Using Movement and Cardiac Sensing. Proc. ACM Interact. Mob. Wearable Ubiquitous Technol. 4, 2, Article 67 (June 2020), 33 pages. https://doi.org/10.1145/3397325
- Zhang et al. (2017) Hongyi Zhang, Moustapha Cisse, Yann N Dauphin, and David Lopez-Paz. 2017. mixup: Beyond empirical risk minimization. arXiv preprint arXiv:1710.09412 (2017).
- Zhou (2019) Zhi-Hua Zhou. 2019. Ensemble methods: foundations and algorithms. Chapman and Hall/CRC.
Appendix A Q_statistics (QS) for Diversity Measurement
Q_statistics (QS) (Udny Yule 1900) is a popular metric to measure the ensemble diversity. Specifically, it computes the pairwise relationship between any two predictions (from base learners) in the ensemble.
Given a query data, assuming and are two predictions from two base classifiers (corresponding to the and the classifiers in the ensemble), we set (or ) for correct predictions and (or ) for incorrect predictions. Given a dataset, for the and the classifiers can be defined as
| (5) |
where is defined as the occurrence of the following prediction scenarios of both classifiers, i.e.,
| (6) |
We can further extend it to an ensemble with base learners, with QS defined as:
| (7) |
to measure the pairwise relationship of base learners’ predictions in the ensemble.
Appendix B Additional Results
B.1. Confusion Matrices on Three datasets
Based on the proposed ConvBoost Ensemble (with Attention Model backbone), in Figure 9 we report the confusion matrices of the three datasets. Although ConvBoost can boost the performance of ConvNet-based models via generating diverse training frames, the HAR challenges still exist in various scenarios. For example, on GOTOV dataset, our model cannot easily distinguish the activity classes "Walking slow", "Walking fast","Walking normal", which has much higher inter-class similarity. On OPP dataset, the error patterns are mainly from the "Null class", which is the majority class taking up to of the total data, yielding lots of false negative predictions.


B.2. Results on PAMAP2 Dataset in Leave-One-Subject-Out Setting
| Subject | Baseline Ensemble | ConvBoost Ensemble (Proposed) | ||||
|---|---|---|---|---|---|---|
| CNN | ConvLSTM | Att. Model | CNN | ConvLSTM | Att. Model | |
| 1 | 71.77 2.33 | 69.44 2.03 | 75.14 4.52 | 77.19 1.56 | 75.63 0.94 | 79.09 1.25 |
| 2 | 83.80 4.29 | 77.66 3.90 | 86.04 2.83 | 88.96 3.32 | 90.77 3.73 | 93.77 1.45 |
| 3 | 68.34 6.58 | 69.64 6.02 | 75.09 7.71 | 72.40 5.62 | 69.56 6.15 | 77.55 6.16 |
| 4 | 81.17 4.27 | 79.40 4.00 | 85.15 4.67 | 92.31 2.79 | 88.81 4.44 | 93.16 4.44 |
| 5 | 88.27 2.23 | 82.84 2.77 | 93.02 0.53 | 92.60 0.34 | 92.75 0.32 | 93.15 0.34 |
| 6 | 86.82 3.25 | 83.60 2.35 | 88.99 3.31 | 89.83 2.80 | 90.09 3.05 | 90.38 3.98 |
| 7 | 92.51 4.29 | 95.07 2.65 | 95.82 2.04 | 96.08 2.66 | 93.04 4.36 | 95.21 3.59 |
| 8 | 38.23 4.73 | 41.42 3.15 | 70.56 7.48 | 47.71 3.65 | 45.38 2.91 | 70.09 5.59 |
| Avg. | 76.36 | 74.88 | 83.73 | 82.13 | 80.75 | 86.54 |