Compressible Turbulence in the Near-Sun Solar Wind: Parker Solar Probe’s First Eight PeriheliaJournal: ApJ
Abstract
Many questions remain about the compressibility of solar wind turbulence with respect to its origins and properties. Low plasma beta (ratio of thermal to magnetic pressure) environments allow for the easier generation of compressible turbulence, enabling study of the relationship between density fluctuations and turbulent Mach number. Utilizing Parker Solar Probe plasma data, we examine the normalized proton density fluctuations as a function of turbulent Mach number conditioned on plasma beta and cross helicity. With consideration of statistical error in the parameters computed from in-situ data, we find a general result that , consistent with both linear-wave theory, and nearly-incompressible turbulence in an inhomogeneous background field. We compare observational results conditioned on plasma beta and cross helicity with 3D magnetohydrodynamic simulations, and observe rather significant similarities with respect to how those parameters affect the proportionality between density fluctuations and turbulent Mach number. This study further investigates the complexity of compressible turbulence as viewed by the density scaling relationship, and may help better understand the compressible environment of the near-Sun solar wind.
I Introduction
Density fluctuations persist on average at a low level of about 10% in the solar wind inertial range and over a wide range of heliocentric distances (Roberts et al. 1987b). The properties and origins of this compressible component of turbulence are still unclear. Density fluctuations are generated from a non-zero divergence of the velocity field; however, when available, the regime of low plasma beta (ratio of thermal to magnetic pressure) is a signature for an easier generation of compressible turbulence (Roberts et al. 1987b; Roberts et al. 1987a; Roberts et al. 1990; Bavassano & Bruno 1995; Grappin et al. 1990; Malara et al. 1996), a consequence of the plasma being dragged and compressed by the dominant magnetic pressure, warranting a more detailed investigation. Such is the case in regions near recent Parker Solar Probe (PSP) perihelia due to the presence of a large (dominantly radial) magnetic field (Kasper et al. 2021) and the orbital approach to the coronal plasma, presumably of lower (Chhiber et al. 2019, e.g.,).
The coexistence of compressive and incompressive fluctuations in magnetohydrodynamic (MHD) turbulence has been observed in the solar wind, for example, by comparing spectra of density and magnetic field fluctuations, which have a similar power-law nature (Montgomery et al. 1987; Klein et al. 1993). Theories involving small-amplitude and slow time scale compressive fluctuations have been used to expose the roles of Alfvén waves, pressure balances, and compressive waves in turbulent plasmas. Formally this involves an expansion of the compressible MHD equations about an incompressible state, based on small turbulent Mach numbers (). This approach enables solutions characteristic of small-amplitude density fluctuations occurring at slow time scales (Matthaeus & Brown 1988; Matthaeus et al. 1991), namely nearly-incompressible (NI) theory. For a homogeneous background field, NI theory predicts that the root-mean-square (rms) density fluctuations scale with . This theory is derived most directly when plasma beta is large, i.e., sound speed greater than Alfvén speed () which is typically not the case for heliocentric distances . However large need not invalidate NI dynamics if the associated wave frequencies remain small () due to spectral (wavevector ) anisotropy. Indeed extensions of the theory to arbitrary plasma beta have also been presented, and these explicitly account for anisotropy relative to the mean magnetic field (Zank et al. 1990; Zank & Matthaeus 1992; Zank & Matthaeus 1993; Bayly et al. 1992). These extensions preserve the scaling, in general.
Further generalizations of NI theory treat the case of an inhomogeneous background field and are perhaps most relevant to the solar wind; these theories predict a linear scaling of rms fluctuation strength with (Bhattacharjee et al. 1998; Hunana & Zank 2010; Zank et al. 2017; Adhikari et al. 2020a; Zank et al. 2021), a result also expected from a linearized analysis of the MHD equations Cho & Lazarian 2003. The density scaling has been shown to also depend on (Cho & Lazarian 2003).
The turbulent Mach number is a key parameter that measures the compressibility of the turbulence, where is the rms of the velocity fluctuations, represents a suitable averaging operator, and is the ion sound speed. Equivalently,
| (1) |
can be written by making substitutions in favor of the Alfvén speed with , , and , where is the polytropic index, is the Boltzmann constant, is the plasma temperature for protons and electrons, is the proton mass, is the ratio of thermal to magnetic pressure for protons, is the proton density, and is the magnetic field magnitude.
The purpose of this study is to further examine the relationship between density fluctuations and . To better understand the nature of compressible MHD turbulence, many numerical simulations have been employed (Cho & Lazarian 2003; Kowal et al. 2007; Yang et al. 2016; Yang et al. 2017; Shoda et al. 2019; Yang et al. 2019; Makwana & Yan 2020; Yang et al. 2021; Gan et al. 2022; Fu et al. 2022). From a wave perspective, compressible MHD turbulence involves the nonlinear interactions between three distinct MHD modes: Alfvén, fast, and slow modes. Perpendicular ion heating is mainly caused via dissipation of the Alfvén mode via cyclotron resonance, although fast modes can also contribute to perpendicular ion heating via the same mechanism. Slow modes dissipate via Landau resonance at the fluid scale, leading to parallel ion heating for low . These are several pathways that density fluctuations can be connected to heating and dissipation. Density fluctuations can originate from either (or both) MHD waves or nonlinear structures, thus connecting the properties of density fluctuations to the strength of compressibility through two potentially distinct frameworks.
Fu et al. 2022 investigated the relationship between the rms density fluctuation amplitude and by performing a series of compressible 3D MHD simulations. They found a linear scaling, such that . They find that this coefficient of proportionality is dependent on cross helicity , and proton beta , where are the Elssser variables, is the fluctuating velocity vector of the solar wind, and is the fluctuating magnetic field vector () in Alfvén units. Similar scaling studies of solar wind density fluctuations have been carried out previously, e.g., (Matthaeus et al. 1990; Tu & Marsch 1994; Adhikari et al. 2020b).
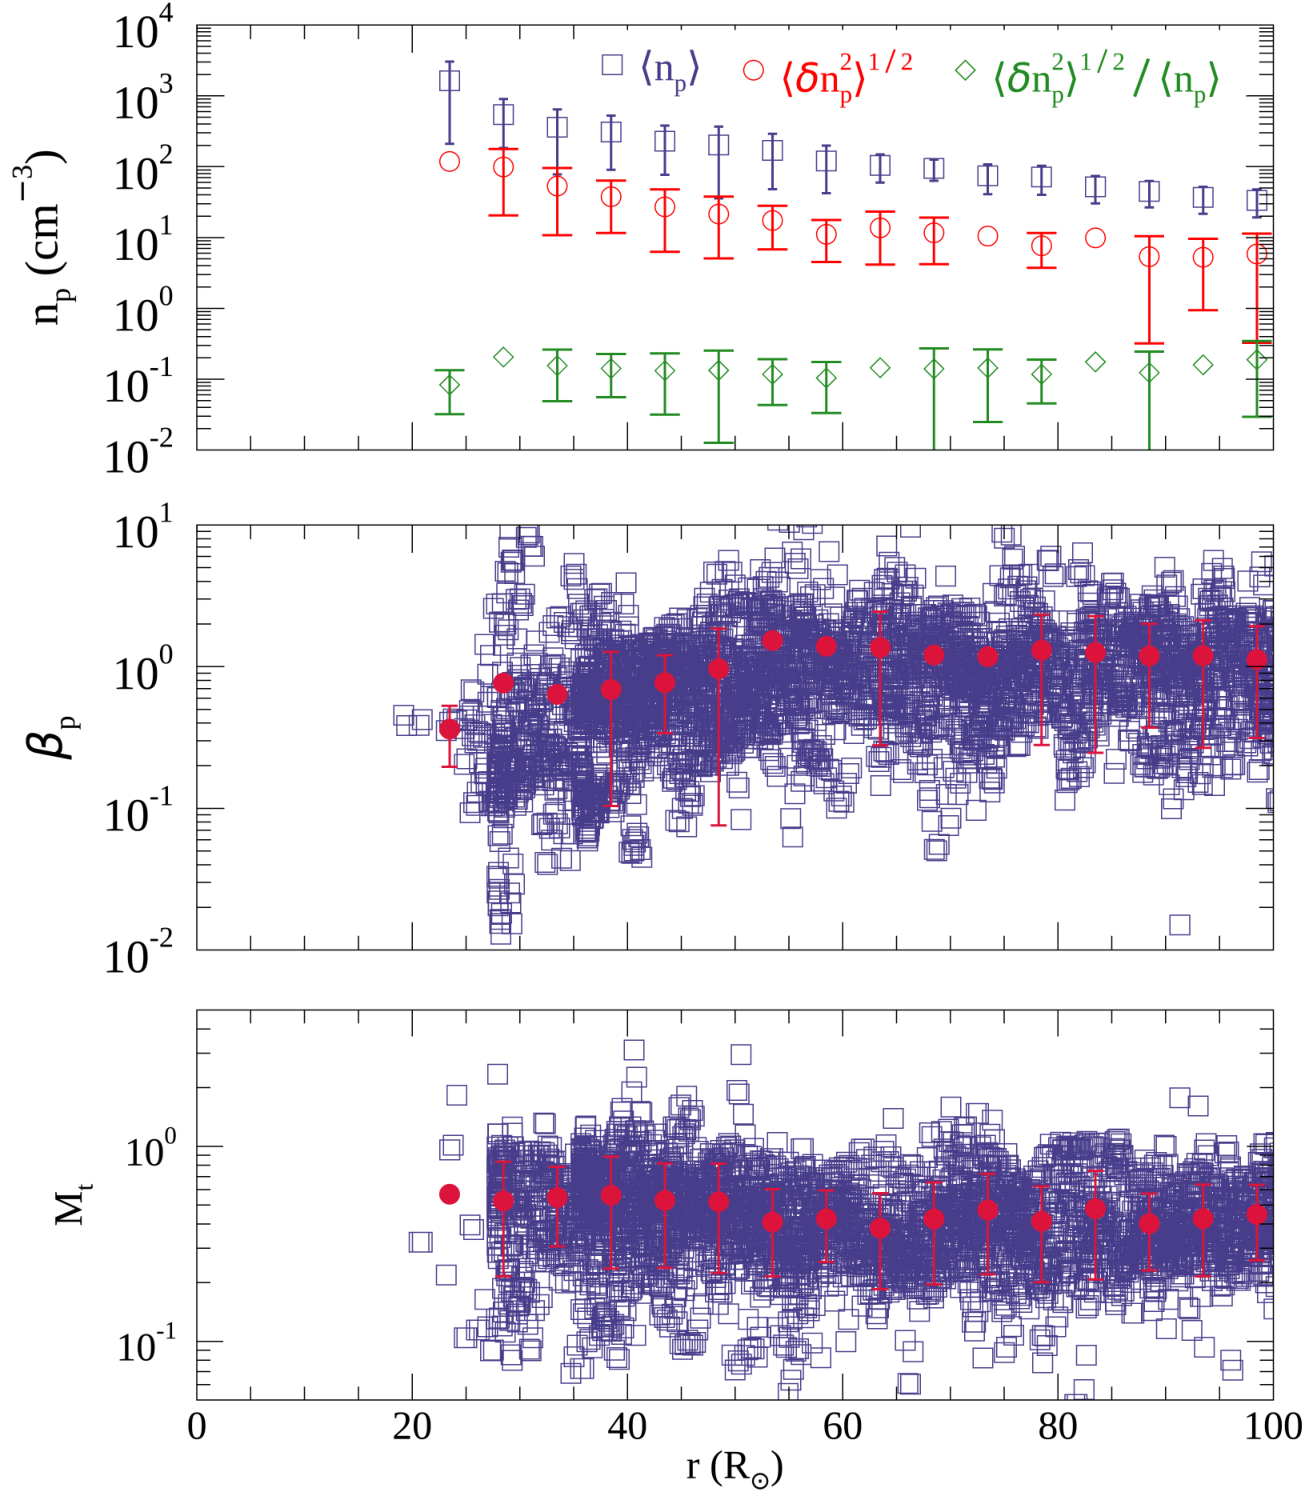
In the present study, we find that the scaling of normalized density fluctuations in the solar wind during PSP’s perihelia (see Section II for data description and methods; see Figure 1 for overview radial trends) varies nearly linearly with (see Figure 2).We also condition the results based on and , and compare with recent simulations showcasing behavior that is similarly observed (see Figure 3). However, we also find that a larger ensemble average of the same quantities yield different scaling properties. These results are expressed in Section III. In Section IV, we review our results and discuss their impact on compressibility studies.
II Parker Solar Probe Data
We use publicly available data11 1 Obtained from the NASA Space Physics Data Facility. from the first eight orbits of Parker Solar Probe (PSP), covering the time period between October 2018 to June 2021. Plasma data are from the Solar Probe Cup (SPC) on the SWEAP suite (Kasper et al. 2016; Case et al. 2020). For all orbits, we discard SPC data when the “general_flag” variable is on. Level 3 SPC moment data (Case et al. 2020, see) are resampled to 1-s cadence using a linear interpolation. These data are then cleaned using a Hampel filter (Pearson 2002; Bandyopadhyay et al. 2018; Parashar et al. 2020) in the time domain, with a filtering interval of 120 seconds. Outliers are identified as values beyond three times the local standard deviation larger than the filtering interval’s median. The outlier values are then replaced with the local median value.
To show the overall trend of density fluctuations from orbits 1 through 8, we smooth the 1-s cadence time series of using a boxcar average over a moving window of 2-hr duration to obtain the mean density (at 1-s cadence), denoted by the following . The fluctuations in are then computed as , from which we compute the rms density fluctuations at 1-s cadence. Both and are then downsampled to 1-hr cadence.
An overview of the density profile for all eight orbits is shown in Figure 1, with radially binned statistics of size 5 . As expected, the average proton density is increasing with decreasing heliocentric distance. The rms density fluctuation amplitude is also almost steadily increasing moving inwards. However, the normalized rms density fluctuation remains rather steady, except that it dips to lower values precipitously near 25 . This might be an artifact of low sampling at these distances, requiring a larger available sampling from future PSP encounters. Changing this radial bin size to 10 and 2 produces no change in the trends.
We also provide overview trends of and in Figure 1, computed using a 2-hr averaging window with radial binning as described above. The turbulent Mach number ranges widely between 0.1 and 1, with averages around 0.5 and no significant trend with radial distance. From 100 inward, the proton beta stays near 1 until about 60 , after which it decreases to an average of 0.3. The collection of these trends point towards identification of a heliocentric region that may be meaningfully viewed as a low and intermediate environment. Therefore, we focus on distances in this range for the results below.
We now describe the averaging procedure used to obtain the results presented in Section III, we start with the data resampled to 1-s cadence for the fundamental quantities , , and . Fluctuations of these fundamental quantities are defined as , , and , where represents a 5-minute centered rolling average, with the averaging duration chosen to approximately match the correlation time of magnetic fluctuations observed during PSP’s first several perihelia (Chen et al. 2020; Chhiber et al. 2021, e.g.,). Therefore, each fluctuating quantity is a time series with 1-s cadence. We then divide these quantities into non-overlapping 5-minute sub-intervals which are used to compute a final averaged value for these quantities within each sub-interval, denoted as . This gives the notation . Finally, averages of these quantities over all non-overlapping sub-intervals will be denoted by an overbar . Unless otherwise specified, from here onward , , and refer to results obtained after the averaging procedure is performed. Note that can be computed from the proton thermal speed as , which can also be used in the framework of computing and to extract a temperature (or thermal pressure). Note that for this study, we assume that the temperature and density are equivalent for both the protons and electrons.
III Results from Encounters 1-8
In this study, we examine the effects of and on the relationship between and . The interest here is in statistical characterization of beta, Mach number and density fluctuations of the turbulence at the energy containing scales. (Note that the inertial range, and its properties such as the spectrum, are separate issues not investigated here.) Therefore we average the higher resolution samples over a time value on the order of the correlation time (5-minutes) at these radial distances. To achieve this balance between statistical significance and regional variation, please refer to Section II for averaging techniques.
Nine days from each encounter, centered around perihelion, are used, corresponding to a range of heliocentric distances . Parameter ranges for the full set of data points are as follows: with a mean , with , with , and with .
III.1 On the scaling of density fluctuations with
We investigate a possible power-law relationship between and . Evaluating the standard errors in computing these two quantities , we find that due to the propagation of error for . We have also adjusted the non-overlapping interval duration up to 120 minutes and experienced insignificant alterations of the results presented here, other than a decrease in the number of available samples. Based on these statistical considerations, we provide the power-law fit of as a function of , and invert this relation to find an estimated scaling of the density fluctuations with respect to . The reason for this lies within the power-law fitting method, which assumes that any error is introduced by the values of the function and not its dependent variable(s).
An overview of as a function of is shown in Figure 2. In this locally averaged point of view, we observe that as determined from the fit shown in Figure 2. This power-law is close to the scaling observed by Adhikari et al. 2020b in PSP’s first orbit. Note that we have applied constraints on our analysis, such that intervals with values of have been discarded due to instrument noise considerations (Case et al. 2020). Additionally, 1% of the lower and upper values of have been discarded to remove possible outliers from the core results.
The obtained power-law scaling is inconsistent with that predicted from NI theory for homogeneous flows (density fluctuations scale with ). The result obtained here follows much more closely the elementary prediction from linear theory, or NI theory with an inhomogeneous background field (density fluctuations scale with ). However, significant statistical variations are seen.
Shifting to a global perspective for the relationship of these quantities, we perform averaging over the full set of non-overlapping sub-intervals (all blue circles in Figure 2). We find that and . Values of and are shown in Figure 2 represented by the red star. While no formal conclusion can be formed based on these constants of proportionality, their values might be seen as slightly favoring the homogeneous NI theory. Perhaps most likely is that we are observing some mixture of inhomogeneous NI scaling and homogeneous NI scaling.
| 0.36 0.03 | 0.44 0.06 | 0.37 0.05 | 0.41 0.05 | |
| 0.21 0.01 | 0.19 0.05 | 0.34 0.03 | 0.29 0.03 | |
| 0.16 0.01 | 0.24 0.04 | 0.24 0.05 | 0.17 0.02 |
III.2 Influence of plasma beta and cross helicity on the scaling
We also have examined the linear dependence of density fluctuations when separately grouping intervals conditioned on values of the parameters and . Specifically we examine how these properties affect the scaling of with . There may be some dependence, which is difficult to define from the data (Totten et al. 1995; Livadiotis 2018; Nicolaou et al. 2019; Nicolaou et al. 2020, however, see). Therefore, we set for the entirety of this study, noting that any change to will not change any qualitative remarks on the observed conditioned trends. We compare our results with similar analyses based on compressible 3D MHD turbulence simulations performed by (Fu et al. 2022). This will provide potential confirmation of observed effects when and are varied. These conditioned in-situ (left panel) and simulation (right panel) results are given in Figure 3. Since the overall results are well-fit by a linear relationship between density fluctuations and Mach number (Figure 2), we perform linear fits , represented by the straight lines in the left panel of Figure 3, with details of the fits provided in Table 1. These conditioned results provide observations of different systematic changes for different combined ranges of and .
Specific conclusions are:
- •
For fixed , we observe no significant trend of linear coefficient with respect to .
- •
For fixed , we observe a decreasing with increasing .
The description of these trends can be confirmed numerically via the linear least-squares fit to the function in Table 1 and comparing the value of over different pairings of and . Further discussion of these trends can be found in Section IV.
Next, we compare these trends with results based on 3D MHD simulations of compressible turbulence published by Fu et al. 2022. These results utilized the high-performance code ATHENA++ (Stone et al. 2020) to solve the ideal compressible MHD equations within an elongated box domain with periodic boundary conditions. The system started from a uniform mass density and uniform background magnetic field with zero fluctuations. Plasma parameters are selected to represent typical solar wind conditions found within 1 au. Further details on the simulations may be found in Fu et al. 2022.
The aforementioned observed trends are also seen in simulations (Fu et al. 2022), in which several runs of different and are used to compute a density fluctuation amplitude over the simulation domain for fixed and . The results with from Fu et al. 2022 are shown on the right panel of Figure 3. Here we note two caveats when comparing PSP observations to these simulations. The first is that the PSP observations correspond to averaging at around the energy injection scale, where as simulation results presented in Figure 3 are computed for scales in the inertial range, although including the energy injection scales do not affect these trends. Secondly, results from the 3D MHD simulations are produced by global averaging over a 3D volume. Such averaging is not equivalent to spacecraft sampling along a 1D trajectory, which contains more random variations and may have a dependence on the angle between the sample trajectory and background magnetic field due to anisotropy of fluctuations (Du et al. 2023). A systematic bias can be introduced since PSP favors sampling of the solar wind parallel to the background magnetic field. However, since sampling likely affects the calculation of both and similarly, we expect the qualitative trends in the scaling relation to remain consistent even if proper directional averaging is made.
IV Discussion
We have examined the relationship between the normalized proton density variation and the turbulent Mach number, a problem that has been examined previously using several different spacecraft (Matthaeus et al. 1990; Tu & Marsch 1994) in different regions of the heliosphere, with Adhikari et al. 2020b utilizing PSP’s first encounter. Here we extend these studies to PSP’s dataset of the first eight encounters. We find a power-law scaling of , consistent with NI theory extended to inhomogeneous background fields (Bhattacharjee et al. 1998; Hunana & Zank 2010), and also with the prediction based on linearized MHD equations. Since the best fit lies between the compressible wave scaling and the NI scaling expected for a homogeneous background field (Zank & Matthaeus 1993), it is also possible to interpret the observed result as representing a mixture of these two types of plasma states. We also examined the influence of the averaging domain on the relationship between density fluctuations and turbulent Mach number. When averaging over the full set of PSP intervals, we find that the coefficient of the scaling is closer to unity than that of the scaling, suggesting some relevance of the homogeneous NI theory.
Another interesting point of discussion is the relationship of the present results to both incompressive cascade rate laws (Politano & Pouquet 1998) and compressive cascade rate laws (Hadid et al. 2017). The empirical scaling found in the present paper may provide guidance as to which of these formulations may be most appropriate for application to solar wind. Moreover, analyses that employ the compressive cascade rate formalism, such as Hadid et al. 2017 infer an empirical relationship between cascade rate and turbulent Mach number, i.e., for slow wind and for fast wind. Using our result that , and assuming the results can be combined, one may deduce a relationship between and that may be interesting for future investigation. The same observational treatment finds a scaling between Mach number and internal energy in an isothermal approximation, an approximation that may not be optimal for the solar wind. Future studies might employ the present empirical results to delve more deeply into various forms of NI theory and cascade laws to provide additional constraints on the underlying theory. Such considerations are well beyond the present intended scope.
We also carry out a procedure similar to Fu et al. 2022 to examine the effects of plasma beta and cross helicity on the linear dependence of density fluctuations on and compare our observational analysis with their results from 3D MHD simulations (see Figure 3). From the conditioned results using PSP observations and in comparison to their simulation results, we find a consistency in the trends with increasing for a given range of (see Table 1). One clear result is that when cross helicity is increased, the normalized density fluctuations are decreased. This is generally consistent with the idea that Alfvénic fluctuations are incompressive. It is rather significant that PSP observations in the compressible solar wind reflects the same systematic changes observed in compressible three-dimensional MHD simulations.
One might want to develop a special treatment of density fluctuations for regions of solar wind having low plasma beta (), a condition that occurs sometimes, especially in magnetic clouds (Smith et al. 2006) but is not common in general. Low plasma beta has been recently treated using weak turbulence theory based on fast magnetosonic modes (Galtier 2023). However the absence of Alfvén modes in that treatment makes it unlikely to explain the observations in the present paper. Given that Alfvénic fluctuations are typically present (Chen et al. 2020), a relevant theory related to the generation of density fluctuations is the parametric decay instability (Fu et al. 2018, e.g.,) of Alfvén waves. However this mechanism becomes more important at low plasma beta when the fluctuation is coherent, which, again, is not typical for the observations we have presented.
Anisotropy in the inner heliosphere due to a more dominantly radial magnetic field has been found to affect many properties of turbulence, such as differences in magnetic power spectra, correlation lengths, and heating when decomposing these quantities into parallel and perpendicular components. A possible influence on the observed distributions and associated scalings is that these intervals are largely dominated by parallel sampling by PSP (Cuesta et al. 2022). Anisotropy can cause density fluctuations sampled along the mean magnetic field to be weaker compared to the fluctuations sampled transverse to the mean field (Du et al. 2023). Further analysis along the lines of prior investigations (e.g., Matthaeus et al. 1990; Zank et al. 1990; Matthaeus et al. 1996; Dasso et al. 2005) would be required to examine further the relationship between the well-studied types of anisotropy and the corresponding observed properties of the density fluctuations (Wang et al. 2023). Another point of interest is to investigate these results in regards to solar wind speed. Although future PSP orbits may encounter more frequent faster solar wind speeds, the intervals in this study favor slow wind speeds () by nearly 98%.
V Acknowledgements
This research is partially supported by NASA under the Heliophysics Supporting Research program grants 80NSSC18K1210 and 80NSSC18K1648, by the Parker Solar Probe Guest Investigator program 80NSSC21K1765 at the University of Delaware, by Heliophysics Guest Investigator program 80NSSC19K0284, and the PUNCH project under subcontract NASA/SWRI N99054DS. In collaboration with Los Alamos National Laboratory (LANL), and partially supported by a NASA LWS grant 80NSSC20K0377(subcontract 655-001), those affiliated with University of Delaware visited LANL in summer 2022 to work on this project. S. Du and H. Li acknowledge the support by DOE OFES program and LANL/LDRD program. Z. Gan and X. Fu are supported by NASA under Award No. 80NSSC20K0377.
References
- Adhikari et al. (2020a) Adhikari, L., Zank, G. P., & Zhao, L. L. 2020a, ApJ, 901, 102, doi: 10.3847/1538-4357/abb132
- Adhikari et al. (2020b) Adhikari, L., Zank, G. P., Zhao, L. L., et al. 2020b, ApJS, 246, 38, doi: 10.3847/1538-4365/ab5852
- Bandyopadhyay et al. (2018) Bandyopadhyay, R., Chasapis, A., Chhiber, R., et al. 2018, ApJ, 866, 81, doi: 10.3847/1538-4357/aade93
- Bavassano & Bruno (1995) Bavassano, B., & Bruno, R. 1995, J. Geophys. Res., 100, 9475, doi: 10.1029/94JA03048
- Bayly et al. (1992) Bayly, B. J., Levermore, C. D., & Passot, T. 1992, Physics of Fluids A: Fluid Dynamics, 4, 945, doi: 10.1063/1.858275
- Bhattacharjee et al. (1998) Bhattacharjee, A., Ng, C. S., & Spangler, S. R. 1998, ApJ, 494, 409, doi: 10.1086/305184
- Case et al. (2020) Case, A. W., Kasper, J. C., Stevens, M. L., et al. 2020, ApJS, 246, 43, doi: 10.3847/1538-4365/ab5a7b
- Chen et al. (2020) Chen, C. H. K., Bale, S. D., Bonnell, J. W., et al. 2020, ApJS, 246, 53, doi: 10.3847/1538-4365/ab60a3
- Chhiber et al. (2021) Chhiber, R., Usmanov, A. V., Matthaeus, W. H., & Goldstein, M. L. 2021, ApJ, 923, 89, doi: 10.3847/1538-4357/ac1ac7
- Chhiber et al. (2019) Chhiber, R., Usmanov, A. V., Matthaeus, W. H., Parashar, T. N., & Goldstein, M. L. 2019, ApJS, 242, 12, doi: 10.3847/1538-4365/ab16d7
- Cho & Lazarian (2003) Cho, J., & Lazarian, A. 2003, MNRAS, 345, 325, doi: 10.1046/j.1365-8711.2003.06941.x
- Cuesta et al. (2022) Cuesta, M. E., Chhiber, R., Roy, S., et al. 2022, ApJ, 932, L11, doi: 10.3847/2041-8213/ac73fd
- Dasso et al. (2005) Dasso, S., Milano, L. J., Matthaeus, W. H., & Smith, C. W. 2005, ApJ, 635, L181, doi: 10.1086/499559
- Du et al. (2023) Du, S., Li, H., Gan, Z., & Fu, X. 2023, ApJ, 946, 74, doi: 10.3847/1538-4357/acc10b
- Fu et al. (2022) Fu, X., Li, H., Gan, Z., Du, S., & Steinberg, J. 2022, ApJ, 936, 127, doi: 10.3847/1538-4357/ac8802
- Fu et al. (2018) Fu, X., Li, H., Guo, F., Li, X., & Roytershteyn, V. 2018, ApJ, 855, 139, doi: 10.3847/1538-4357/aaacd6
- Galtier (2023) Galtier, S. 2023, Journal of Plasma Physics, 89, 905890205
- Gan et al. (2022) Gan, Z., Li, H., Fu, X., & Du, S. 2022, ApJ, 926, 222, doi: 10.3847/1538-4357/ac4d9d
- Grappin et al. (1990) Grappin, R., Mangeney, A., & Marsch, E. 1990, J. Geophys. Res., 95, 8197, doi: 10.1029/JA095iA06p08197
- Hadid et al. (2017) Hadid, L., Sahraoui, F., & Galtier, S. 2017, The Astrophysical Journal, 838, 9
- Hunana & Zank (2010) Hunana, P., & Zank, G. P. 2010, ApJ, 718, 148, doi: 10.1088/0004-637X/718/1/148
- Kasper et al. (2016) Kasper, J. C., Abiad, R., Austin, G., et al. 2016, Space Sci. Rev., 204, 131, doi: 10.1007/s11214-015-0206-3
- Kasper et al. (2021) Kasper, J. C., Klein, K. G., Lichko, E., et al. 2021, Phys. Rev. Lett., 127, 255101, doi: 10.1103/PhysRevLett.127.255101
- Klein et al. (1993) Klein, L., Bruno, R., Bavassano, B., & Rosenbauer, H. 1993, J. Geophys. Res., 98, 7837, doi: 10.1029/92JA02906
- Kowal et al. (2007) Kowal, G., Lazarian, A., & Beresnyak, A. 2007, ApJ, 658, 423, doi: 10.1086/511515
- Livadiotis (2018) Livadiotis, G. 2018, Entropy, 20, 799, doi: 10.3390/e20100799
- Makwana & Yan (2020) Makwana, K. D., & Yan, H. 2020, Physical Review X, 10, 031021, doi: 10.1103/PhysRevX.10.031021
- Malara et al. (1996) Malara, F., Primavera, L., & Veltri, P. 1996, J. Geophys. Res., 101, 21597, doi: 10.1029/96JA01637
- Matthaeus & Brown (1988) Matthaeus, W. H., & Brown, M. R. 1988, Physics of Fluids, 31, 3634, doi: 10.1063/1.866880
- Matthaeus et al. (1996) Matthaeus, W. H., Ghosh, S., Oughton, S., & Roberts, D. A. 1996, J. Geophys. Res., 101, 7619, doi: 10.1029/95JA03830
- Matthaeus et al. (1990) Matthaeus, W. H., Goldstein, M. L., & Roberts, D. A. 1990, J. Geophys. Res., 95, 20673, doi: 10.1029/JA095iA12p20673
- Matthaeus et al. (1991) Matthaeus, W. H., Klein, L. W., Ghosh, S., & Brown, M. R. 1991, J. Geophys. Res., 96, 5421, doi: 10.1029/90JA02609
- Montgomery et al. (1987) Montgomery, D., Brown, M. R., & Matthaeus, W. H. 1987, J. Geophys. Res., 92, 282, doi: 10.1029/JA092iA01p00282
- Nicolaou et al. (2019) Nicolaou, G., Livadiotis, G., & Wicks, R. T. 2019, Entropy, 21, 997, doi: 10.3390/e21100997
- Nicolaou et al. (2020) Nicolaou, G., Livadiotis, G., Wicks, R. T., Verscharen, D., & Maruca, B. A. 2020, ApJ, 901, 26, doi: 10.3847/1538-4357/abaaae
- Parashar et al. (2020) Parashar, T. N., Goldstein, M. L., Maruca, B. A., et al. 2020, ApJS, 246, 58, doi: 10.3847/1538-4365/ab64e6
- Pearson (2002) Pearson, R. K. 2002, IEEE Transactions on Control Systems Technology, 10, 55, doi: 10.1109/87.974338
- Politano & Pouquet (1998) Politano, H., & Pouquet, A. 1998, Geophys. Res. Lett., 25, 273, doi: 10.1029/97GL03642
- Roberts et al. (1990) Roberts, D. A., Goldstein, M. L., & Klein, L. W. 1990, J. Geophys. Res., 95, 4203, doi: 10.1029/JA095iA04p04203
- Roberts et al. (1987a) Roberts, D. A., Goldstein, M. L., Klein, L. W., & Matthaeus, W. H. 1987a, J. Geophys. Res., 92, 12023, doi: 10.1029/JA092iA11p12023
- Roberts et al. (1987b) Roberts, D. A., Klein, L. W., Goldstein, M. L., & Matthaeus, W. H. 1987b, J. Geophys. Res., 92, 11021, doi: 10.1029/JA092iA10p11021
- Shoda et al. (2019) Shoda, M., Suzuki, T. K., Asgari-Targhi, M., & Yokoyama, T. 2019, ApJ, 880, L2, doi: 10.3847/2041-8213/ab2b45
- Smith et al. (2006) Smith, C. W., Vasquez, B. J., & Hamilton, K. 2006, Journal of Geophysical Research: Space Physics, 111
- Stone et al. (2020) Stone, J. M., Tomida, K., White, C. J., & Felker, K. G. 2020, ApJS, 249, 4, doi: 10.3847/1538-4365/ab929b
- Totten et al. (1995) Totten, T. L., Freeman, J. W., & Arya, S. 1995, J. Geophys. Res., 100, 13, doi: 10.1029/94JA02420
- Tu & Marsch (1994) Tu, C. Y., & Marsch, E. 1994, J. Geophys. Res., 99, 21,481, doi: 10.1029/94JA00843
- Wang et al. (2023) Wang, V., Chhiber, R., Cuesta, M. E., et al. 2023, in prep.
- Yang et al. (2019) Yang, L. P., Li, H., Li, S. T., et al. 2019, MNRAS, 488, 859, doi: 10.1093/mnras/stz1747
- Yang et al. (2017) Yang, Y., Matthaeus, W. H., Shi, Y., Wan, M., & Chen, S. 2017, Physics of Fluids, 29, 035105, doi: 10.1063/1.4979068
- Yang et al. (2016) Yang, Y., Shi, Y., Wan, M., Matthaeus, W. H., & Chen, S. 2016, Phys. Rev. E, 93, 061102, doi: 10.1103/PhysRevE.93.061102
- Yang et al. (2021) Yang, Y., Wan, M., Matthaeus, W. H., & Chen, S. 2021, Journal of Fluid Mechanics, 916, A4, doi: 10.1017/jfm.2021.199
- Zank et al. (2017) Zank, G. P., Adhikari, L., Hunana, P., et al. 2017, ApJ, 835, 147, doi: 10.3847/1538-4357/835/2/147
- Zank & Matthaeus (1992) Zank, G. P., & Matthaeus, W. H. 1992, Journal of Plasma Physics, 48, 85, doi: 10.1017/S002237780001638X
- Zank & Matthaeus (1993) —. 1993, Physics of Fluids, 5, 257, doi: 10.1063/1.858780
- Zank et al. (1990) Zank, G. P., Matthaeus, W. H., & Klein, L. W. 1990, Geophys. Res. Lett., 17, 1239, doi: 10.1029/GL017i009p01239
- Zank et al. (2021) Zank, G. P., Zhao, L. L., Adhikari, L., et al. 2021, Physics of Plasmas, 28, 080501, doi: 10.1063/5.0055692