Witnessing the intracluster medium assembly at the cosmic noon in JKCS 041 2020Witnessing the intracluster medium assembly at the cosmic noon in JKCS 041–References
Abstract
In this work we study the intracluster medium of a galaxy cluster at the cosmic noon: JKCS 041 at . A 28h long Sunyaev-Zel’dovich (SZ) observation using MUSTANG-2 allows us to detect JKCS 041 , even if intrinsically extremely faint compared to other SZ-detected clusters. We found that the SZ peak is offset from the X-ray center by about 220 kpc in the direction of the brightest cluster galaxy, which we interpret as due to the cluster being observed just after first passage of a major merger. JKCS 041 has a low central pressure and a low Compton compared to local clusters selected by their intracluster medium (ICM), likely because the cluster is still in the process of assembly but also in part because of a hard-to-quantify bias in current local ICM-selected samples. JKCS 041 has a dex fainter signal than another less massive cluster, exemplifying how much different weak-lensing mass and SZ mass can be at high redshift. The observations we present provide us with the measurement of the most distant resolved pressure profile of a galaxy cluster. Comparison with a library of plausibly descendants shows that JKCS 041 pressure profile will likely increase by about 0.7 dex in the next 10 Gyr at all radii.
Keywords:
Galaxies: clusters: intracluster medium – Galaxies: clusters: individual: JKCS 041 — galaxies: clusters: general — X-rays: galaxies: clusters1 Introduction
The redshift around two is a key epoch for galaxies and clusters: the cosmic star formation rate and the black hole growth peak at about this redshift (Madau & Dickinson 2014) and the first massive clusters emerge from the cosmic web (Arnaud et al. 2009). At this epoch of high star formation rates, AGN and merger activity, the intracluster medium (ICM) is heavily shaped by accretion shocks, heating from stellar winds associated to star formation of member galaxies, and mechanical heating and turbulence generated by AGNs (McNamara et al. 2005). A characterization of the ICM of clusters at this epoch would therefore offer a measurement of the efficiency of these feedback mechanisms and of the gas circulation in these initial stages of the cluster formation. However, in spite of extensive searches, in the last ten years we were unable to characterize the ICM of any cluster at , the most distant characterized clusters being XLSSC122 (Willis et al. 2020) at , JKCS 041 (Andreon et al. 2009, Newman et al. 2014, Andreon et al. 2014) at and IDCS J1426.5+3508 (Stanford et al. 2012, Andreon et al. 2021) at . At , ICM detections are still quite uncertain; the ICM detection of a cluster by Wang et al. (2016) has been questioned by Champagne et al. (2021). The Spiderweb structure is dominated by the wings of PSF of the central bright AGN and by inverse-Compton scattering on the jet emission (Tozzi et al. 2022). The latter components outshine the tentative ICM detection at energies larger than about 1 keV (Tozzi et al. 2022), while the available Chandra data below 0.8 keV are noisy at best because of the contaminant on the optical blocking filter. The complexity of this handful of arcsec wide sky region, with two bright AGNs, two bright jets and at best a very weak ICM emission, has been pointed out by the SZ analysis of Di Mascolo et al. (2023). The properties of the ICM at this key epoch are therefore poorly known because of the difficulty of acquiring spatially resolved data adequate for the purpose. XLSSC122 and JKCS 041 have X-ray radial surface brightness profiles (Mantz et al. 2018, Andreon et al. 2009). IDCS J1426.5+3508 instead, thanks to spatially resolved Sunyaev-Zel’dovich (SZ) and X-ray data, has all its thermodynamic profiles determined. This allowed Andreon et al. (2021) to find a sizeable gas, heat, and entropy transfer at kpc in IDCS J1426.5+3508 , while the cluster central region has likely reached the final stage. Of course, with just one example studied in detail, it is impossible to say whether the inside-out ICM assembly seen in IDCS J1426.5+3508 is a general feature of the whole cluster population at those redshifts. As mentioned, is an epoch of intense merger activity. The ICM of several major mergers at low to intermediate redshifts have been studied in detail (e.g., Cl J0152-1357 and Bullet clusters, Massardi et al. 2010; Menanteau et al. 2012), but adequate data to investigate the ICM properties of one such object at are still lacking. At this redshift, the fraction of disturbed clusters is expected to be high, making this investigation even more pressing.
In this paper we report very deep Sunyaev-Zel’dovich (SZ) observations of JKCS 041 sufficient to measure the radial profile of the cluster pressure and therefore to study its intracluster medium. JKCS 041 is an intermediate-mass cluster (a few M⊙, Andreon et al. 2014) at (Newman et al. 2014; Andreon et al. 2014) with hot gas detected by Chandra (Andreon et al. 2009). With 19 spectroscopic members, a well defined red sequence, and an extensive multi-wavelength coverage, this system is perhaps the most studied cluster in the high redshift Universe; for example it is the only cluster so far with measurements of velocity dispersion of their individual passive galaxies (Prichard et al. 2017). Mostly based on the dynamics of the cluster galaxies, JKCS 041 seems is suspected to have substructure and to be a merger in progress (Prichard et al. 2017). Unlike other clusters, JKCS 041 is not ICM-selected (was discovered as galaxy overdensity and later follow-up, Andreon et al. 2009) and therefore does not share the common bias of ICM-selected samples that have clusters with large signals over-represented (and clusters with low signals underrepresented or absent), see e.g. Andreon et al. (2011).
Throughout this paper, we assume , , and km s-1 Mpc-1. Results of stochastic computations are given in the form , where and are the posterior mean and standard deviation. The latter also corresponds to 68% uncertainties because we only summarize posteriors close to Gaussian in this way. All logarithms are in base 10.

2 Observations, data reduction and analysis
2.1 Weak lensing
Kim et al. (2023) performed a weak lensing analysis of JKCS 041 based on WFC3 imaging data and photometric redshifts presented in Newman et al. (2014). The authors found a mass of . The analysis makes a two-dimensional fit using Navarro, Frenk & White (1997) profiles with the Diemer & Joyce (2019) mass-concentration relation. Two mass components were jointly fitted, the JKCS 041 cluster itself and a spectroscopic confirmed group about 1 arcmin south-west of the X-ray center (the plus sign in Fig. 1, Newman et al. 2014).
A similar analysis for the other cluster often mentioned in this work, IDCS J1426.5+3508 at returns a lower mass of (Jee et al. 2017), in agreement with its lower richness (Andreon 2013). The masses of these two clusters, used here, have been derived from following Ragagnin et al. (2021).
2.2 Galaxy dynamics
Using the K-band Multi-Object Spectrograph at VLT, Prichard et al. (2017) determined precise ( km/s) redshifts of 16 JKCS 041 galaxies that were known to be members using Hubble Space Telescope redshifts (with km/s precision) in Newman et al. (2014). These are shown in Fig. 1 as squares color-coded by relative velocity. The spatial distribution of the relative velocities (note that the red squares are all in the cluster South) suggest that JKCS 041 is composed by two merging sub-clusters (Prichard et al. 2017).
2.3 X-ray
JKCS 041 was observed with Chandra ACIS-S for 75 ks; data reduction and analysis are described in Andreon et al. (2009). Here we use the same data to derive an image to be used as comparison to the SZ image.
To optimize the imaging of the cluster, we start from Scharf (2002), who discusses the optimal energy range to be used to image galaxy clusters at with maximal signal to noise when photons cannot be weighted but can only be taken or discarded depending on their energy. We improve upon his work eliminating the redshift limit and weighting photons with a weight given by the information content of each (infinitesimal) energy bin. The weight is computed as the ratio between the cluster and the background spectra. The cluster is modelled with an APEC spectrum with the temperature measured for JKCS 041 (from Andreon et al. 2009) and its redshift (from Newman et al. 2014) to enforce regularity. The background is measured from the photons falling in the same chip but outside the cluster solid angle. Compared with the common [0.5,2] keV choice, the optimal weight resemble a Maxwell distribution, with a peak at about 1 keV, a FWHM of 0.9 keV, and a tail a higher energies. The decrease at keV is due to the presence of a background line there (as already remarked by Scharf 2002), while the decrease at lower energies is due to the increased background. After weighing and getting rid of point sources (interpolating over the tiny regions occupied by them), we apply an adaptive filter to the data using CIAO csmooth (based on Ebeling et al. 2006) to keep only features with , as already done in Andreon et al. (2009). Isocontours of the image so obtained are shown in Fig. 1.
2.4 SZ data
JKCS 041 was observed for 28h (overhead included) with MUSTANG-2 between December 2018 and January 2021. MUSTANG-2 is a 215-element array of feedhorn-coupled TES bolometers (Dicker et al. 2014) at the 100m Green Bank telescope (GBT) working at 90 GHz. When mounted on the GBT, MUSTANG-2 has about 10" FWHM resolution and an instantaneous field of view of 4.5 arcmin.
JKCS 041 was observed with Lissajous daisy scans, typically with a 2.5 arcmin radius. The data were calibrated using preferentially Solar systems objects, and also ALMA calibrators (Fomalont et al. 2014, van Kempen et al. 2014). Our SZ maps are calibrated to Rayleigh-Jeans brightness temperature (), adopted throughout this paper. The final map has a RMS noise of 23 when smoothed to the beam resolution, within the central 2 arcmin radius. A beam profile specific to this cluster observations is created by stacking all secondary (point-source) calibrators interspersed during these observations (see Ginsburg et al. 2020). The beam FWHM of the final map is 9.5 arcsec.
The data were reduced following the traditional approach (named MIDAS in Romero et al. 2020, to which we refer for details): time ordered data from unresponsive detectors or from bad scans and glitches are flagged, remaining ones are filtered to subtract atmospheric and electronic background. This filtering also removes some (cluster) signal, which needs to be accounted for during the analysis using the transfer function, shown in Fig. 2. The transfer function is larger than 0.8 at scales smaller than 1 arcmin, then drops to lower values. Since atmospheric conditions were less stable during the observations of JKCS 041 than of IDCS J1426.5+3508 , a more aggressive filtering was needed for JKCS 041 data. This resulted in a transfer function that drops to low values at smaller scales (compared to the one of IDCS J1426.5+3508 , shown in Andreon et al. 2021).
The resulting map is shown in the left panel of Fig. 1. The SZ peak is at (RA, Dec)=(2:26:43.2,-4:41:13). A few point sources are visible (dark blue in the Figure surrounded by blue circles) and pixels contaminated by them are flagged and ignored during further cluster analysis.
For completeness, we report that JKCS 041 was also observed for 17h with the NIKA2 camera (Adam et al. 2018) at 150 and 250 GHz at the IRAM 30m telescope. The cluster SZ signal is not obvious in the preliminary reduction of this shorter exposure taken with a smaller telescope, although there is a (negative) blip in the NIKA2 150 GHz map at the location of the MUSTANG-2 (negative) peak. We defer a full analysis of the properly reduced NIKA2 data to a later paper.
2.5 The SZ-X offset
The X-ray peak is at (RA,Dec)=(2:26:43.1,-4:41:36), about 26 arcsec (about 220 kpc) South of the SZ one derived in Sec. 2.4 A spatial offset between the X-ray and SZ centers is possible because of the different dependence of these two observables on electron density and temperature. This has already been seen for example in the merging clusters Cl J0152-1357 (Massardi et al. 2010) and Bullet (Menanteau et al. 2012). According to hydrodynamic simulations in Zhang et al. (2014), large offsets are produced just after the pericenric passage during near head-on major mergers of clusters with . Therefore, we interpret the SZ-X offset as due to the cluster being observed just after a major merger, as a part of the emergence of the first massive clusters from the cosmic web at early times. The spatial SZ-X offset corroborates the suggestion by Prichard et al. (2017) that JKCS 041 still shows traces in the galaxy dynamics of the two sub-clusters that formed it; see Fig.1 with large positive velocities (red) points regrouped in the cluster south. In JKCS 041 , the SZ-X offset is in the North-South direction, as the two groups identified by Prichard et al. (2017) (the red points).
Judging from Zhang et al. (2014) simulations, the main cluster is coincident with the SZ peak while the colliding cluster is South of it and came from North with km/s and is seen Gyr after the pericentric after a nearly head-on collision. This would produce an X-ray peak about 250 kpc South of the SZ peak, as observed in JKCS 041 . In the simulations, the two sub-clusters have a mass of 1-2 M⊙ (that are cluster masses at ) and their summed mass is consistent with the observed JKCS 041 weak lensing mass. Tailored (and more precise) constraints on the JKCS 041 colliding sub-clusters (e.g. gas fraction) and merger parameters (e.g. relative velocity and projection effects) accounting for the observational setup (e.g., SZ transfer function) and constrained by measured quantities (mass, Compton-Y, etc.) are presented in Felix et al. (2023).
2.6 The depressed pressure profile
Figure 3 shows the cluster SZ radial surface brightness profile, extracted with 10 arcsec radial annuli centered on the SZ peak after flagging the point sources indicated in Fig. 1. The cluster is quite faint, with a peak of K. The brightness profile levels off to K, a non-zero level (that we name pedestal) induced by the data reduction that forces the map to have zero mean.
The three dimensional pressure profile is derived fitting the SZ data with a modified version of PreProFit (Castagna & Andreon 2019), accounting for the transfer function, point spread function (beam), and pedestal level, following Andreon et al. (2021). The conversion from to Compton is derived in Andreon et al. (2021) and, since it is (minimally) -dependent we adopt the observed temperature keV (Andreon et al. 2009).
Following Andreon et al. (2021), we adopt a pressure profile given by a cubic spline in log-log space with knots at radii of and arcsec. By adopting a cubic spline we allow the shape of the pressure profile to vary almost arbitrarily while keeping it continuous and doubly-differentiable. By defining the spline in log quantities (log pressure vs log radius), we naturally exclude non-physical (negative) values of pressure and radius and we can approximate a large variety of profiles, and their derivatives, including the commonly parameterised pressure profile as in Nagai et al. (2007). Our model then has 5 variables: the pressures at the four radii, and , and the pedestal value of the SZ surface brightness. Our analysis assumes spherical symmetry, uniform priors, zeroed for unphysical values (e.g., pressure cannot be negative). In particular, since the total mass of the cluster is finite, the logarithmic slope of the pressure should be steeper than at large radii (Romero et al. 2018). We therefore adopted a logarithmic slope at Mpc as prior. This prior could alternatively be expressed as a maximal value for the pedestal level. The imposition of this prior is necessary primarily to distinguish a radially-flat background from a radially-flat cluster signal.
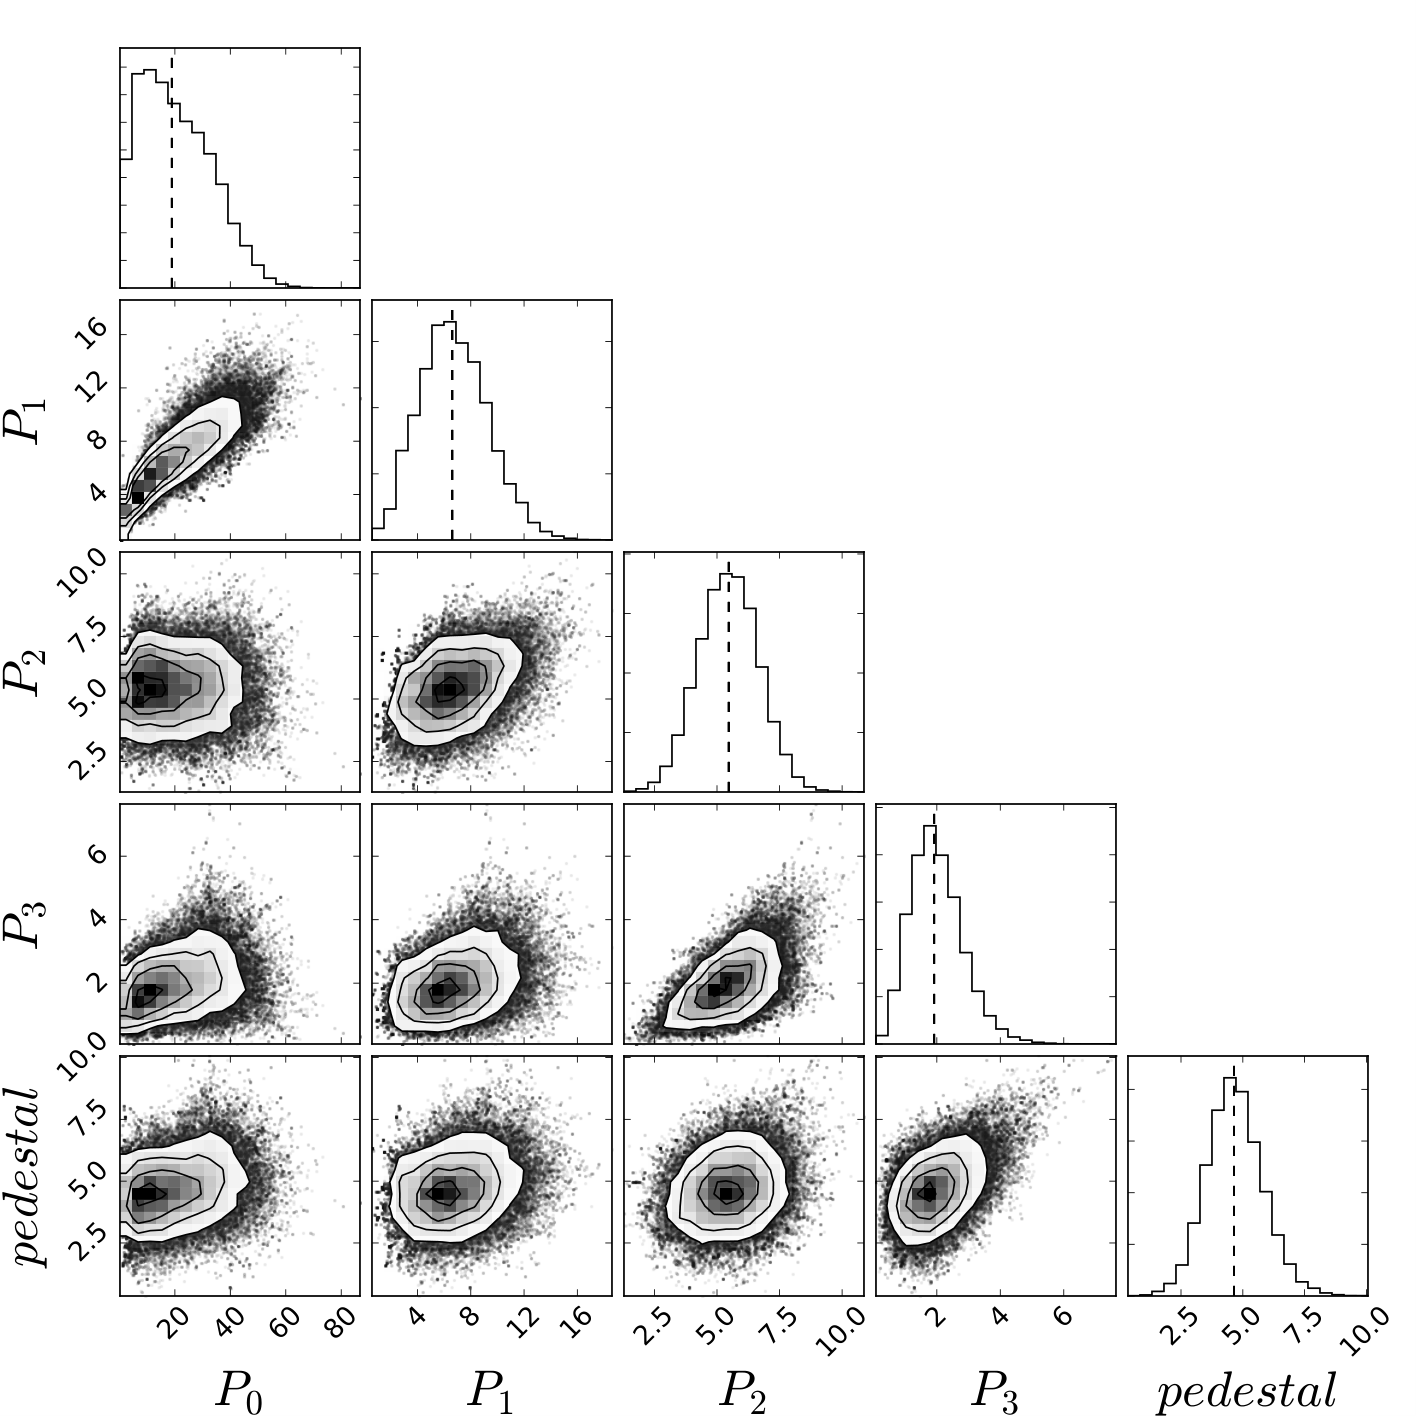
We find eV cm-3, and a pedestal level of K with covariances illustrated in Figure 5. We found a of for 8 degrees of freedom. There is a % probability to observe a larger assuming the model best fit. The two points at and arcsec carry the largest contributions to the total , with the outer radius corresponding to local (negative) maxima in the SZ signal at NE and SW in Fig. 1 likely induced by the cluster merger. Figure 3 shows the best-fit model on top of the observed data. Figure 4 shows the pressure profile as a blue line with 68% uncertainty as the shaded area. This is the most distant cluster with a resolved SZ-based pressure profile, at only marginally larger redshift than the previous record holder IDCS J1426.5+3508 (Andreon et al. 2021).
The JKCS 041 integrated spherical and cylindrical Componization parameter within are Mpc2 and Mpc2, respectively. The JKCS 041 integrated cylindrical Componization parameter within 30 arcsec is Mpc2, consistent with (below) the 95% upper limit of Mpc2 reported in Culverhouse et al. (2010). The latter is based on an inward extrapolation of the (lack of) signal measured on larger scales assuming a radial profile for JKCS 041 close to the universal pressure profile, which however does not fit our data (Figs. 3 and 4).
Fig. 4 shows that JKCS 041 pressure profile is centrally-depressed compared to the universal pressure profile (UPP, Arnaud et al. 2010) being outside the UPP range at several radii (larger significance requires a larger comparison sample). In this comparison, we adopt Arnaud et al. (2010) best fit values, as derived from the X-ray temperature in Andreon et al. (2014) and we fixed the normalization to have a match at . How well (badly) this profile matches the observed data is shown in Fig. 3 (red line). The shapes of the profile do not match: JKCS 041 has a small-size central emission over a faint flat profile, unlike the universal pressure profile, that is spatially larger and slowly changing. Using the weak-lensing mass instead of the one estimated from temperature does not alter our conclusion. This is the third example of a cluster selected independently of the ICM content whose pressure profile turns out to be clearly depressed (with CL2015, Andreon et al. 2019 and IDCS J1426.5+3508 , Andreon et al. 2021), confirming previous claims that were either indirect (Di Mascolo et al. 2019) or of lower significance (Dicker et al. 2020). However, JKCS 041 and IDCS J1426.5+3508 are manifestly observed during their ICM assembly, and perhaps for this reason their ICMs have not yet reach their final configuration, unlike CL2015.
We have investigated whether the observed deviations of the SZ emission from a circular symmetric universal pressure profile centered on the X-ray center might be due to point sources. However, we find this unlikely because an universal pressure profile has an extent much wider than the MUSTANG-2 PSF. In fact, at least four sources would be required to match the extent, but: a) we expect about 0.2 sources on average from number counts; b) there are no sources detected at 90 GHz; and c) there are no sources detected at 1.4 or 855 GHz, which instead would be expected for 90 GHz sources with a non-peculiar spectral energy distributions. In detail, only focusing to the inner 30 arcsec, we need at least four sources all with similar fluxes (70-100 Jy), appropriately spaced apart (about 17 arcsec from each other), and with almost unique spectral energy distributions in order not to be detected in the available VLA data at 1.4 GHz (Bondi et al. 2003) and in SPIRE 855 GHz data (Schulz et al. 2017). In particular, a 70 Jy source at 90 GHz would be detected at 1.4 GHz if its spectral slope is steeper than and at 855 GHz if its spectral emission matches a gray body of 40 K (adopted to estimate the contamination in e.g. Sayers et al. 2013). This large density of ad-hoc sources in a small solid angle (with p-value probability based on the 0.2 sources observed on average in a 30 arcsec aperture by Zavala et al. 2021) and the required characteristics would still not be able to mimic the profile at larger scales nor to make the SZ emission circularly symmetric and co-centered with the X-ray. For the sake of completeness, we also consider the case in which the matching to flux and extent of the universal pressure profile is achieved by contamination by many faint sources. To explore this case, we randomly draw distributions of fluxes from the Zavala et al. (2021) number counts (extrapolated down to 10 Jy) within a solid angle with 30 arcsec radius and we count how many times we obtain a total net flux larger than 320 Jy (to match the missing flux of the universal pressure profile within the considered solid angle) with individual fluxes in the simulated cluster aperture fainter than 70 Jy (to avoid to be detected at 1.4, 90 or 855 GHz). This very rarely happens in our simulations, about twice every times. This computation neglects the fact that we need a peculiar spatial distribution of sources: a higher flux at the center of the aperture (where the SZ signal should be made larger) and an appropriate azimuthal flux distribution to achieve a spherically symmetric profile centered on the X-ray center starting from an observed SZ distribution with a peak 26 arcsec away from it. This configuration is highly unlikely. To summarize, we could not find a reasonable configuration of points sources that could explain the observed mismatch between the X-ray and SZ centers, the asymmetric SZ emission, and the excess at 35 arcsec, given the much larger extent of the cluster emission compared to the PSF. We therefore conclude that point sources are extremely unlikely to alter our results.
3 Plausible evolution
Fig. 6 compares the JKCS 041 pressure profile (blue solid line) to a library of profiles derived for clusters in the nearby Universe (corridors). The red dotted corridor indicates the range as derived by X-COP (Ghirardini et al. 2019) for clusters with JKCS 041 mass. Similarly to Fig. 4, JKCS 041 has a low pressure for its mass in the inner 200 kpc. This comparison, at fixed mass, is in our opinion misleading to study evolution: the mass of JKCS 041 cannot stay constant for about 10 Gy, not even if the cluster acquires zero mass, because the integration radius, corresponding to the overdensity , becomes larger at low redshift as a result of the decrease of the mean density of the Universe (see Andreon et al. 2021 for discussion). To study evolution it is preferable to compare ancestors and descendants (Andreon & Ettori 1999). By selecting the 22 most massive clusters in the closest snapshot () and their descendants in the Magneticum simulation (Dolag et al. 2016, Ragagnin et al. 2017, Hirschmann et al. 2015), we find that by the mass of JKCS 041 will plausibly have grown by dex. This computation actually uses clusters of slightly less mass than JKCS 041 ( vs ) because of the limited volume of the simulation. The comparison of JKCS 041 to its descendants is shown by the green dashed corridor, marked by the range. This, wider, corridor also accounts for the uncertainty on the mass growth. Compared to the library of possible descendants, the JKCS 041 pressure profile is low at all radii by about 0.7 dex.
To quantify the amount of evolution, following Andreon et al. (2021) we compute the evolutionary rate , which is the exponent of in:
| (1) |
where and is the mass of the plausible descendant of the cluster with mass at redshift . Unlike other authors, we compare same radii in kpc, not radii scaled by because the cluster content does not expand with the Universe (see Andreon et al. 2021 for details). As local, comparison, sample, we use the pressure profile derived from the X-COP sample (Ghirardini et al. 2019). Fig. 7 shows the derived evolutionary rate and quantifies what is already visible in Fig. 6: pressure is lacking at high and must increase with a rate at most radii. The figure shows the uncertainty due to measurement errors (yellow shading) and that from the combination of the one coming from the variety of profiles at a fixed mass at and of the scatter in accretion histories (dashed green corridor, marking the range). The large pressure change implied in this comparison indicates that JKCS 041 is in a very active phase, as also shown by the SZ-X offset. Unlike IDCS J1426.5+3508 , the inner 200 kpc display a large evolutionary rate , indicating that even the central part of JKCS 041 is far from the likely final status, in agreement with the SZ-X offset.
One caveat applies: the clusters that we use as a local sample are ICM selected, either in X-ray (Fig. 4) or in SZ (Fig 6), whereas JKCS 041 is selected independently of its ICM content because it was discovered in near-infrared (and then followed-up with Chandra and MUSTANG-2). ICM-selected clusters have, by selection, pressure profiles biased high and with reduced scatter because clusters with low pressure are underrepresented, or absent, in those samples (Andreon et al. 2016, 2019). A cluster with the JKCS 041 Compton parameter , or central Compton parameter , is undetectable in the ACT (Hilton et al. 2021) or SPT (Bocquet et al. 2019) as discussed in Sec. 3.1, and also with Planck (Planck collab. 2016) when . Therefore, if sizeable samples of clusters with depressed profiles exist in the nearby Universe, the range seen in REXCESS or X-COP is reduced and biased, and our estimate of evolution biased high. We have demonstrated that at least one such cluster exists, CL2015 (Andreon et al. 2019). The same caveat applies to estimates of evolution by other authors (e.g. Pratt et al. 2022) that furthermore mix evolution with pseudo-evolution by scaling radii (see Andreon et al. 2021 for details and comments on earlier estimates).
The observed evolutionary rate is similar to values seen in the 22 clusters in the Magneticum simulation at kpc but smaller at smaller radii (rates for individual simulated clusters are shown in Andreon et al. 2021 Fig. 16). In particular, in simulations inner radii are already pressured (i.e., ) and, if any, are over-pressured at high (i.e., ) compared to present day descendants. On the other hand, a similar profile might be missing in the simulation simply because we have only 22 simulated clusters (of slightly lower mass) and major head-on mergers of massive sub-clusters, as JKCS 041 is, are rare (also in samples of one hundred, Wik et a 2008).
3.1 The faintness of JKCS 041
Compared to other clusters with SZ observations, JKCS 041 is extremely faint, as illustrated in Fig. 8 comparing its central central Compton value and literature values. ACT values (small points) are from from Hilton et al. (2021), while the JKCS 041 (red circle) and IDCS J1426.5+3508 (cyan square) values are derived using MUSTANG-2 data following the ACT definition (Hilton et al. 2021): we took the central value of the map, derived by Abel (line of sight) projection of the pressure profile, and filtered with the convolution of an universal pressure profile with scale 2.4 arcmin and the ACT beam. For IDCS J1426.5+3508 we used MUSTANG-2 data in Andreon et al. (2021). We found and for JKCS 041 and IDCS J1426.5+3508 , respectively. JKCS 041 is times fainter than the 10% ACT completeness value, indicated by a dashed line. As a way of comparison, a couple of clusters, denoted as very faint in the papers presenting them (Kéruzoré et al. 2020 and Ricci et al. 2020), are indicated by stars (at ) and they are almost 10 times brighter than JKCS 041 . Fig. 9 repeats the comparison using SPT clusters from Bocquet et al. (2019) and Massive and Distant Clusters of WISE Survey (MaDCoWS) with a SZ detection from Dicker et al. (2020). The faintest of these clusters are brighter by a factor of a few compared to JKCS 041 . JKCS 041 is a really faint cluster and indeed its surface brightness profile is noisier than that of IDCS J1426.5+3508 in spite of a much longer integration time at the same facility (5 vs 28 h). This plot is the common mass-redshift plot except that here we use the observable instead of identifying it with mass which removes any ambiguity.
3.2 The SZ mass-mass plot
Fig. 10 shows the spherical Compton within corrected for the self-similar evolution vs. weak lensing mass for JKCS 041 , IDCS J1426.5+3508 and the ICM-selected clusters in Marrone et al. (2012) and Nagarajan et al. (2019). JKCS 041 mass is about 0.35 dex larger than the mass of IDCS J1426.5+3508 , yet the SZ signal is 0.5 dex lower, i.e. there is a sizeable difference between the mass and the Compton parameter for these two clusters at . Some authors might refer to it as a difference between between SZ mass and mass. This large difference for just two high redshift clusters alone is enough to cast doubts on the identification of mass with the Compton parameter assumed in many past papers. Indirect evidence of this large scatter is seen in richness vs. plane, with identified with mass, of clusters in Di Mascolo et al. (2020). Under the assumption that the Compton parameter measures mass, Brodwin et al. (2016) concluded that JKCS 041 has a much lower mass than IDCS J1426.5+3508 , in spite of its much larger richness of JKCS 041 (Andreon 2013) and of the larger estimate of the weak lensing mass of JKCS 041 .
Fig. 10 shows that JKCS 041 is 0.75 dex below the mean mass vs Compton relation of the ICM-selected clusters from Nagarajan et al. (2019). The low JKCS 041 Compton parameter for its mass is in line with expectations for merging clusters, observed in simulations to scatter below the mean relation (Wik et al. 2008; Krause et al. 2012). Indeed, according to simulations, merger events cause clusters to scatter downward in this plane because the increase is delayed compared the mass growth and because the final is lower than that for a cluster of the same final mass (Wik et al. 2008; Krause et al, 2012). According to simulations, the same downscatter would happen to many high redshift clusters, because at early epochs the fraction of disturbed or merging clusters is high (Krause et al, 2012). Therefore, we expect a large scatter between SZ mass and true mass at high redshift, with SZ surveys becoming more and more biased against merging cluster as redshift increases. According to simulations, JKCS 041 final equilibrium value will be larger by dex (Wik et al. 2008), insufficient to significantly reduce the SZ mass difference between the two high redshift clusters. As for other comparisons with lower redshift samples (Figs. 4, 6, 7, 8, and 9) the relative location of JKCS 041 with respect to the mean relation in Fig. 10) is affected by affected by a hard-to-quantify bias in current low redshift ICM-selected samples.
Fig. 11 shows the same data as previous figure, but with a focus on evolution. The ordinate is the Compton Y distance (at fixed mass) from the mean relation. The line is the self-similar evolution. Errorbars account for, and are dominated by, mass errors. The figure emphasizes the limited knowledge of evolution of this scaling relation at the cosmic noon due to the dearth of at data. JKCS 041 is 0.9 dex below the self-similar prediction, although with a large error. Also in this plot, the relative JKCS 041 location compared to other samples is partially amplified by a hard-to-quantify bias in current low redshift ICM-selected samples. Furthermore, we note that the observed mass at the cluster redshift is used to estimate the predicted using the relation ignoring mass growth and pseudo-evolution between the two considered redshifts (see Andreon et al. 2021).
3.3 Summary
We present a 28h long Sunyaev-Zel’dovich (SZ) observation of the JKCS 041 cluster taken with MUSTANG-2 at the Green Bank Telescope. This very long exposure allows us to detect JKCS 041 , even if the cluster is intrinsically extremely weak compared to other SZ-detected clusters.
We found that the SZ peak is offset from the X-ray center by about 220 kpc in the direction of the brightest cluster galaxy, which we interpret as due to the cluster being observed just after a major merger, as a part of the emergence of the first massive clusters from the cosmic web at early times.
We found that JKCS 041 has a low central pressure compared to local ICM-selected clusters and a low Compton Y for its mass, likely because the cluster is still in the process of assembly, but also amplified by a hard-to-quantify bias in current low redshift ICM-selected samples. These observations provide us with the measurement of the most distant resolved pressure profile. Comparison with a library of plausibly descendants shows that JKCS 041 pressure profile will likely increase by about 0.7 dex in the next 10 Gyr at all radii.
JKCS 041 has an SZ mass dex lower than the lower-mass IDCS J1426.5+3508 cluster, exemplifying at how much different true mass and SZ mass can be.
Acknowledgements
SA thanks Sharon Felix, James Jee, Jinhyub Kim, and Lindsay King for useful discussion and for sharing results in advance of publication. The Green Bank Observatory is a facility of the National Science Foundation operated under cooperative agreement by Associated Universities, Inc. MUSTANG-2 data was taken under the project ID AGBT18B-111, AGBT19B-003, AGBT20B-020. CS was supported in part by NASA Chandra grant G01-22120X and XMM Grant 80NSSC22K0857.
Data Availability
Raw Chandra data are public available in the Chandra archive, obs ID 15168 and 16321. SZ derived products (beam, transfer function, and map) are available at https://doi.org/10.7910/DVN/AYSGA3.
References
- Adam et al. (2018) Adam, R., Adane, A., Ade, P. A. R., et al. 2018, A&A, 609, A115.
- Andreon (2013) Andreon, S. 2013, A&A, 554, A79.
- Andreon (2016) Andreon, S. 2016, A&A, 587, A158.
- Andreon et al. (2009) Andreon, S., Maughan, B., Trinchieri, G., et al. 2009, A&A, 507, 147
- Andreon et al. (2014) Andreon, S., Newman, A. B., Trinchieri, G., et al. 2014, A&A, 565, A120.
- Andreon et al. (2019) Andreon, S., Moretti, A., Trinchieri, G., et al. 2019, A&A, 630, A78.
- Andreon et al. (2021) Andreon, S., Romero, C., Castagna, F., et al. 2021, MNRAS, 505, 5896.
- Andreon et al. (2011) Andreon, S., Trinchieri, G., & Pizzolato, F. 2011, MNRAS, 412, 2391.
- Arnaud et al. (2009) Arnaud, M., Bohringer, H., Jones, C., et al. 2009, Astro2020 Decadal Survey (arXiv:0902.4890)
- Arnaud et al. (2010) Arnaud, M., Pratt, G. W., Piffaretti, R., et al. 2010, A&A, 517, A92
- Bocquet et al. (2019) Bocquet, S., Dietrich, J. P., Schrabback, T., et al. 2019, ApJ, 878, 55.
- Bondi et al. (2003) Bondi, M., Ciliegi, P., Zamorani, G., et al. 2003, A&A, 403, 857.
- Brodwin et al. (2016) Brodwin, M., McDonald, M., Gonzalez, A. H., et al. 2016, ApJ, 817, 122.
- Castagna & Andreon (2020) Castagna, F. & Andreon, S. 2020, A&A, 639, A73
- Castagna & Andreon (2019) Castagna, F., & Andreon, S. 2019, A&A, 632, A22
- Champagne et al. (2021) Champagne, J. B., Casey, C. M., Zavala, J. A., et al. 2021, ApJ, 913, 110.
- Culverhouse et al. (2010) Culverhouse, T. L., Bonamente, M., Bulbul, E., et al. 2010, ApJ, 723, L78.
- Dicker et al. (2014) Dicker, S. R., Ade, P. A. R., Aguirre, J., et al. 2014, Proc. SPIE, 91530J
- Dicker et al. (2020) Dicker, S. R., Romero, C. E., Di Mascolo, L., et al. 2020, ApJ, 902, 144.
- Diemer & Joyce (2019) Diemer, B. & Joyce, M. 2019, ApJ, 871, 168.
- Di Mascolo et al. (2019) Di Mascolo, L., Mroczkowski, T., Churazov, E., et al. 2019, A&A, 628, A100
- Di Mascolo et al. (2020) Di Mascolo, L., Mroczkowski, T., Churazov, E., et al. 2020, A&A, 638, A70.
- Di Mascolo et al. (2023) Di Mascolo, L., Saro, A., Mroczkowski, T., et al. 2023, Nature, 615, 809.
- Dolag et al. (2016) Dolag, K., Komatsu, E., & Sunyaev, R. 2016, MNRAS, 463, 1797
- Ebeling et al. (2006) Ebeling, H., White, D. A., & Rangarajan, F. V. N. 2006, MNRAS, 368, 65.
- Fakhouri et al. (2010) Fakhouri, O., Ma, C.-P., & Boylan-Kolchin, M. 2010, MNRAS, 406, 2267.
- Felixet al. (2022) Felix et al., 2023, in preparation.
- Fomalont et al. (2014) Fomalont, E., van Kempen, T., Kneissl, R., et al. 2014, The Messenger, 155, 19
- Ghirardini et al. (2017) Ghirardini, V., Ettori, S., Amodeo, S., et al. 2017, A&A, 604, A100.
- Ghirardini et al. (2019) Ghirardini, V., Eckert, D., Ettori, S., et al. 2019, A&A, 621, A41.
- Hilton et al. (2021) Hilton, M., Sifón, C., Naess, S., et al. 2021, ApJS, 253, 3.
- Hirschmann et al. (2014) Hirschmann, M., Dolag, K., Saro, A., et al. 2014, MNRAS, 442, 2304
- Jee et al. (2017) Jee, M. J., Ko, J., Perlmutter, S., et al. 2017, ApJ, 847, 117.
- Kéruzoré et al. (2020) Kéruzoré, F., Mayet, F., Pratt, G. W., et al. 2020, A&A, 644, A93.
- kim et al. (2022) Kim et al., 2023, in preparation.
- Madau & Dickinson (2014) Madau, P. & Dickinson, M. 2014, ARA&A, 52, 415.
- Mantz et al. (2018) Mantz, A. B., Abdulla, Z., Allen, S. W., et al. 2018, A&A, 620, A2.
- Marrone et al. (2012) Marrone, D. P., Smith, G. P., Okabe, N., et al. 2012, ApJ, 754, 119.
- Massardi et al. (2010) Massardi, M., Ekers, R. D., Ellis, S. C., et al. 2010, ApJ, 718, L23.
- McDonald et al. (2014) McDonald, M., Benson, B. A., Vikhlinin, A., et al. 2014, ApJ, 794, 67.
- McNamara et al. (2005) McNamara, B. R., Nulsen, P. E. J., Wise, M. W., et al. 2005, Nature, 433, 45.
- Menanteau et al. (2012) Menanteau, F., Hughes, J. P., Sifón, C., et al. 2012, ApJ, 748, 7.
- Nagai et al. (2007) Nagai, D., Kravtsov, A. V., & Vikhlinin, A. 2007, ApJ, 668, 1.
- Navarro et al. (1997) Navarro, J. F., Frenk, C. S., & White, S. D. M. 1997, ApJ, 490, 493
- Newman et al. (2014) Newman, A. B., Ellis, R. S., Andreon, S., et al. 2014, ApJ, 788, 51.
- Planck Collaboration et al. (2016) Planck Collaboration, Ade, P. A. R., Aghanim, N., et al. 2016, A&A, 594, A27.
- Pratt et al. (2022) Pratt, G. W., Arnaud, M., Maughan, B. J., et al. 2022, A&A, 665, A24.
- Prichard et al. (2017) Prichard, L. J., Davies, R. L., Beifiori, A., et al. 2017, ApJ, 850, 203.
- Ragagnin et al. (2017) Ragagnin, A., Dolag, K., Biffi, V., et al. 2017, Astronomy and Computing, 20, 52
- Ragagnin et al. (2021) Ragagnin, A., Saro, A., Singh, P., et al. 2021, MNRAS, 500, 5056.
- Ricci et al. (2020) Ricci, M., Adam, R., Eckert, D., et al. 2020, A&A, 642, A126.
- Romero et al. (2018) Romero, C., McWilliam, M., Macías-Pérez, J.-F., et al. 2018, A&A, 612, A39.
- Romero et al. (2020) Romero, C. E., Sievers, J., Ghirardini, V., et al. 2020, ApJ, 891, 90
- Sayers et al. (2013) Sayers, J., Mroczkowski, T., Zemcov, M., et al. 2013, ApJ, 778, 52.
- Scharf (2002) Scharf, C. 2002, ApJ, 572, 157
- Schulz et al. (2017) Schulz, B., Marton, G., Valtchanov, I., et al. 2017, arXiv:1706.00448.
- Smith et al. (2001) Smith, R. K., Brickhouse, N. S., Liedahl, D. A., et al. 2001, ApJ, 556, L91.
- Sunyaev & Zel’dovich (1972) Sunyaev R. A., Zel’dovich Y. B., 1972, A&A, 20, 189
- Tozzi et al. (2022) Tozzi, P., Gilli, R., Liu, A., et al. 2022, A&A, 667, A134.
- van Kempen et al. (2014) van Kempen, T., Kneissl, R., Marcelino, N., et al. 2014, ALMA Memo 598
- Voit et al. (2003) Voit, G. M., Balogh, M. L., Bower, R. G., et al. 2003, ApJ, 593, 272.
- Wik et al. (2008) Wik, D. R., Sarazin, C. L., Ricker, P. M., et al. 2008, ApJ, 680, 17.
- Willis et al. (2020) Willis, J. P., Canning, R. E. A., Noordeh, E. S., et al. 2020, Nature, 577, 39.
- Zavala et al. (2021) Zavala, J. A., Casey, C. M., Manning, S. M., et al. 2021, ApJ, 909, 165.
- Zhang et al. (2014) Zhang, C., Yu, Q., & Lu, Y. 2014, ApJ, 796, 138.