2023
Explanatory systems make machine learning models more transparent. However, they are often inconsistent. In order to quantify and isolate possible scenarios leading to this discrepancy, this paper compares two explanatory systems, SHAP and LIME, based on the correlation of their respective importance scores using 14 machine learning models (7 regression and 7 classification) and 4 tabular datasets (2 regression and 2 classification). We make two novel findings. Firstly, the magnitude of importance is not significant in explanation consistency. The correlations between SHAP and LIME importance scores for the most important features may or may not be more variable than the correlation between SHAP and LIME importance scores averaged across all features. Secondly, the similarity between SHAP and LIME importance scores cannot predict model accuracy. In the process of our research, we construct an open-source library, XAISuite, that unifies the process of training and explaining models. Finally, this paper contributes a generalized framework to better explain machine learning models and optimize their performance.
The XAISuite framework and the implications of explanatory system dissonance
keywords
Explainable AI, Comparison, Machine Learning Algorithms, Error Analysis1 Introduction
From self-driving cars to customer support chat-bots, machine learning models have become pervasive in our daily lives. nirmal_2017 The problem is that these machine learning models are opaque - that is, the mechanisms by which a model arrives at a particular result are not known by humans. When these opaque systems are being entrusted with human-level decision, e.g., handing down sentences to convicts or driving a car, they will need to be able to explain themselves to justify their behavior. lakshmanan_2021
This is especially pertinent when such opaque models fail. In 2016, a ProPublica article revealed that Northpointe, a widely used criminal risk assessment tool, incorrectly rated incarcerated African Americans as more likely to commit future crimes than Caucasians. angwin_larson_kirchner_mattu_2016 And in 2018, a self-driving car hit and tragically killed a cyclist. wakabayashi2018self The machine learning model in the car was unable to reconcile contrasting information from various sensors, and thus failed to make the right decision. jones_2018
Explanatory systems produce explanations, or model-dependent justifications. rose2019 They provide one way to understand machine learning models. However, for explanations to be trustworthy, it is essential that they are consistent and accurate. gilpin_2018 We define consistency as having two components. The first part is reproducibility - applying explanation methods repeatedly should yield the same results. Secondly, the results of different explanatory methods using the same dataset and model should be similar. By accurate, we mean that the justifications provided by explanation systems are correct. In this paper, we examine two state of the art explanatory systems: SHAP NIPS2017_7062, based on the game theory concept of Shapley values, and LIME lime, which stands for local interpretable model-agnostic explanations. We propose an approach to compare SHAP and LIME explanations and to automatically analyze cases where they are inconsistent.
Furthermore, by highlighting the inconsistencies between explanatory systems, this paper contributes to making explanations for machine learning models more consistent and accurate. This will provide users and stakeholders a supported reason behind system malfunctions, preventing incidents like the one involving the self-driving car and the cyclist. In addition, system debugging and diagnosis will be more efficient.
Explanations that users can trust are essential. Without trustworthy explanations, we are effectively blind to the operation of machine learning models and cannot mitigate their flaws. Our work answers the following research questions:
- •
How can users trust explanatory systems?
- •
How can accuracy of explanation methods be measured?
- •
And, finally, how can we develop such trustworthy explainers for machine learning?
In this paper, we present a XAISuite framework that attempts to answer these questions.
XAISuite provides an interface to compare different explanatory systems. Users can trust explanations more if they see that there is a consensus among different explanatory systems.
Using the XAISuite framework, our research concludes that correlation between explanatory systems is not necessarily associated with the performance of a machine learning model. By showing that explanatory systems may agree even in cases where the model fails, we caution users of the accuracy of explanation methods in such cases and open research into other possible indicators of explanation accuracy.
And as we seek to progress towards more trustworthy explainers, we expect the results of different explanatory systems to converge to a single correct justification of a particular model’s performance. XAISuite’s explanation generation and comparison utilities will help in this process by highlighting cases where different explanatory systems differ.
2 Background/Related Work
Our paper builds on previous work in explanations, failure analysis, and machine learning error.
Bases for Explanation Accuracy
In the introduction, we defined explainer accuracy as how similar the justifications produced by explanation systems are to reality. But what is the baseline by which reality is defined?
A research paper published by DeepMind https://doi.org/10.48550/arxiv.1706.08606 suggests that the answer lies in human thought. The paper explores the use of cognitive psychology to explain the decisions of machine learning models, drawing parallels between biases humans develop during their maturation and those acquired by machine learning. By likening machine learning models to humans, the paper provides a framework to determine which explanations have a higher probability of being accurate. Since explanations are ultimately meant for human understanding, we find the use of psychology in explanation generation promising and perhaps capable of resolving the discrepancies between explanatory systems outlined in this paper.
Gilpin et al. gilpin_2018 believe that what is defined as accurate might depend on user requirements. They note a tradeoff between completeness and interpretability that all explanatory systems must follow - the more accurate explanations are, the less likely they are to be understandable by humans. This tradeoff may affect the discrepancies between different explanatory models. Thus, a key part of future explanatory system research is creating explainers that gain the user’s trust. goel_sindhgatta_kalra_goel_mutreja_2022 We see our work in proposing an automated system to ensure the consistency and accuracy of explanatory systems as essential to that effort. Research on user requirements for explanations is elaborated on further later in this section.
Han et al. han2022 propose that different explanatory systems are optimal for different scenarios, and an “adversarial” sample exists that will lead to a large error for any given explanatory system. For example, while SHAP and LIME are both based on local function approximation (LFA), they differ in their optimal intervals due to their noise functions. This can help explain the discrepancies between SHAP and LIME that we observe in our research. It also suggests that the “perfect” explainer can be created by joining different explainers over many different corresponding optimal intervals. Thus, if the correlations between SHAP and LIME found in this paper indicate that SHAP performs poorly where LIME performs well, and vice versa, it would be a big step towards improving explainer accuracy. Research on explanation comparison is explored later in this section.
On user requirements for explanations
Numerous papers riveiro2021 10.1145/1943403.1943424 10.1145/3503252.3531306 have highlighted the importance of user expectations in explanation utility. Since user expectations are often implicit, determining what type of explanations users are looking for is difficult. The XAISuite framework that we propose in this paper attempts to alleviate this problem by providing users with the option to use multiple explanatory systems, compare them, and choose the explanations most suitable to their scenario.
Chazette et al. 9920064 go further to propose and test a framework for explanatory systems focused on usage frequency and user frequency. We design XAISuite keeping the requirements outlined in the paper in mind.
If machine learning is to be used in lieu of human-level decision making, machine learning models need to be safe and trustworthy 10.1007/978-3-642-32378-2_8. One way to ensure safety is to have stricter requirements and guarantees. In 2021, Nadia Burkart and Marco Huber burkart_2021 laid out the requirements of explainable supervised machine learning models. Our paper implements two of their requirements: (1) We make explanation of machine learning models easier and more accessible through our open source XAISuite library and (2) We ensure explanatory methods are consistent and easy to follow for humans.
Sometimes user requirements for explanations may vary in specialized fields. Ghassemi et al. Ghassemi2021 argue against the use of explainers in the medical profession, claiming that the many failures of explanatory systems endanger the trust of healthcare professionals and the lives of patients. They propose that machine learning models be rigorously tested instead. However, we believe that the solution to explainer error is not abandoning explanatory systems altogether, but to improve them until they are trustworthy. XAISuite is an attempt in that direction.
On comparing explanatory systems
Comparing explanatory models is an open area of research. This is sometimes known as the “disagreement problem” https://doi.org/10.48550/arxiv.2202.01602.
In their paper, Covert et al. covert2022 point out that while there are many different explanatory methods, it remains unknown how “most methods are related or when one method is preferable to another.” The authors propose a new class of similar explanations supported by cognitive psychology called removal-based explanations. These systems determine the importance of a feature by analyzing the impact of its removal. The paper specifically highlights that as SHAP and LIME are both part of the removal-based explanatory framework, they share a resemblance. The discrepancies between SHAP and LIME shown in our paper therefore have added value as markers of where two very similar explanatory systems with related internal mechanisms can differ.
Roy et al. 9978217 in “Why Don’t XAI Techniques Agree?” acknowledged that SHAP and LIME explanations often disagree and that users don’t know which one to trust. They proposed an aggregate explainer that focuses on the similarities between SHAP and LIME and disregarded discrepancies. But the authors of that paper do not set forth a way to find and resolve the discrepancies. We contribute a method to empower users to better understand the reasons to trust SHAP and LIME.
van der Waa et al. VANDERWAA2021103404 extended explanatory system comparison further with a detailed analysis of rule-based versus example-based explanations, with implications on user trust and accuracy. Our framework allows users to validate this analysis by seeing for themselves the difference between different types of explanatory systems rather than having to trust only one of them.
Duell et al. 9508618 specifically compares the results of explanatory systems such as SHAP and LIME on electronic health records. They note significant differences in importance scores between the explanatory systems, stating that “studied XAI methods circumstantially generate different top features; their aberrations in shared feature importance merit further exploration from domain-experts to evaluate human trust towards XAI.” While this aligns perfectly with the results of our paper, we extend the study to different types of data outside of health records. We also create a generalized framework to help in the ”further exploration” Duell et al. deemed necessary.
The in-depth comparison that we perform between two explanatory systems has been previously explored. A paper published by Lee et al. Lee2022 compares breakDown (BD) and SHAP explainers in the specific case of classification of multi-principal element alloys. However, their work is not generalizable to all tabular data and all machine learning models, which XAISuite is. That paper also does not delve deeply into specific circumstances causing the differences between SHAP and BD explanations, which we do. In our work, we use various models on data of different types to allow us to have a better picture of exactly what factors affect explainer consistency. Furthermore, we compare SHAP and LIME, two of the most commonly used machine learning models in the field, and thus our results are applicable to more applications of machine learning.
Related Software
Various tools similar to XAISuite also exist:
- 1.
Agarwal et al. agarwal2022openxai created a tool, OpenXAI, for evaluating and benchmarking post-hoc explanation systems, comparable in functionality and user interface to our XAISuite. While OpenXAI focuses more on accuracy of explanatory systems over one another in specific tasks, we put a heavier emphasis on consistency for all tasks. Furthermore, we set forth a fully-interactive graphical user interface that requires no code from the user-end.
- 2.
Yang et al. wenzhuo2022-omnixai created the OmniXAI library for explainable AI that allows easy access to numerous explainers for a particular machine learning model. The OmniXAI library serves as part of the backend of the XAISuite library by helping to fetch explanatory systems that the user requests.
- 3.
Captum, similar to OmniXAI, was proposed by Kohklikyan et al. 2009.07896. In their implementation of the XAISuite library, the authors believed that OmniXAI was more compatible and easier to work with, but any future library that follows the XAISuite framework presented in this paper could use Captum to fetch explanatory importance scores.
3 Methods
We divide the methodology into two parts: (1) creating the XAISuite framework and (2) using the framework to compare SHAP and LIME values, an example of which is shown in Fig.1. The latter part consists of two observational studies that constitute the basis of our findings. One concludes that correlation between SHAP and LIME importance scores cannot be used to predict model accuracy. The other shows that the correlations between SHAP and LIME importance scores for the most important features are consistently more variable than the correlation between average SHAP and LIME importance scores across all features, and therefore are not as reliable of a metric to test explainer similarity.

3.1 Framework for training and explaining models
We now present the XAISuite framework, a unified tool for comparing explanatory systems. It forms the basis of the XAISuite library, which enables users to train and explain models with minimal input. In constructing this library, we build on OmniXAI wenzhuo2022-omnixai, which allows direct access to different explainers and helps us save the importance values generated by these explainers.
A brief overview of the XAISuite framework is presented on the next page. The framework consists of three components: data retrieval, machine learning model creation and training, and explanation generation. A more detailed version with implementation suggestions is found in Appendix 7.
See pages 1 of XAISuiteDetailedFramework.pdf
We contribute the XAISuite framework with the intention for it to be a standard platform for training, explaining, and analyzing models. The framework was constructed with an eye on five key factors:
- 1.
Simplicity: Containing just three parts which depend on data retrieval, function calls, and writing to output files, XAISuite provides guiding principles for any implementation to enhance code changes and user convenience.
- 2.
Integratablity: A library is limited if it cannot be used with other libraries. Core functionalities, like model training, explanation generation, and graphics creation, are designed to use external libraries. However, the framework is flexible and not based on any specific external dependency, so there is flexibility in the way in which the model is trained or explanations are generated.
- 3.
Flexibility: A key feature of XAISuite is flexibility. This is enabled by the lack of specifics and the use of general terms. Note that any dataset can be used, any model can be trained, any explanatory system can be initialized, depending on the implementation. The processing templates have no fixed form, nor is the form of data storage specified. As mentioned in the previous point, the XAISuite framework is compatible with any potential provider of its constituent parts, whether they be model libraries(sk-learn, XGBoost, etc.), transform function types (Logarithmic, Exponential, etc.), or different data storage options (Dataframe, Numpy, Files, etc.).
- 4.
Usability: Users are the center of explainability research riveiro2021, and so any interface that facilitates interactions between the user and explanatory system must be user-centric. XAISuite achieves this by ensuring that results are understandable in a readable table or graphical format. Again, individual implementations of data or graph generation may vary, but by enforcing the requirement of converting data into a portable and visualizable medium, XAISuite reinforces the human-centric approach that is a hallmark of explainability research.
- 5.
Expandability: XAISuite is not designed to be a closed system. There are ample spaces provided for users to extend existing functionalities or link XAISuite with other existing frameworks. For example, the additional data that can be inserted at the Analyzer stage can be generated by other frameworks or modules. In fact, the XAISuite library provides two points of data generation that can be used at this stage.
Algorithms and code for the implementation of the XAISuite Framework’s machine learning model training and explanation utilities is included in Appendix 8.
3.2 Using the XAISuite framework to compare SHAP and LIME explanations
Here, we describe the process of using the XAISuite framework and library to achieve the results detailed in this paper. The results themselves are in the Results section and the interpretation of the results are in the Discussion/Conclusions section.
First, let’s start with some definitions that will be further elaborated on in later sections:
Definition 1.
: First-Level Model A model that is trained and explained using a given dataset.
Definition 2.
: Second-Level Model A model that is trained and explained on the explanatory importance scores, accuracy, or other output of a First-Level model. A Second-Level Model does not need to be the same type of model as the corresponding First-Level Model.
3.2.1 Preliminary Steps
The following steps should be followed before moving onto any of the specific procedures in the following sections:
| Data11 1 For each task, we use a relatively simple dataset and complex dataset to account for the effect of data complexity in model training. | Type | Models22 2 Selected for variety in complexity from list of available supervised sk-learn models: See source here | Source |
|---|---|---|---|
| Diabetes | Regression | Linear Regression, SGD Regressor, Kernel Ridge Elastic Net, Bayesian Ridge, Gradient Boosting Regressor, SVR | Sk-learn |
| Energy Efficiency | UC Irvine ML Repository | ||
| Iris | Classification | Logistic Regression, Gaussian NB, K Neighbors Classifier, Decision Tree Classifier, Random Forest Classifier Gradient Boosting Classifier, Multinomial NB | Sk-learn |
| Digits | Sk-learn |
For the steps below and in the steps in the following sections, we use n = 10, p = 0.5, and m = 5.
- 1.
Install and import the XAISuite library 33 3 Documentation and Installation Directions found here: XAISuite Page
- 2.
Import the necessary datasets. Refer to Table 1 (next page). For CSV files, download the file and place it in the current working directory. For sk-learn datasets, simply import the sklearn.datasets module
- 3.
Use the XAISuite library to train and explain the models listed in Table 1 for each dataset using SHAP and LIME. 44 4 For the Energy Efficiency Dataset, the authors chose Heating Load as the target variable and disregarded Cooling Load. These models are our first-level models. Repeat this step n times and calculate (1) the average SHAP-LIME correlation across all features of a dataset per model and (2) accuracy of these models on each dataset.
The preliminary steps can be executed by the setup script in Appendix 10.
3.2.2 Implications of correlation between SHAP and LIME on model accuracy
We hypothesize that for higher disagreement between SHAP and LIME explanatory systems , i.e. lower correlations between SHAP and LIME importance scores, there will be more room for error and the machine learning model will be less accurate. Conversely, when there is higher agreement between SHAP and LIME explanatory systems, the model will be more accurate. We test our hypothesis by following the procedure below after execution of the preliminary steps:
- 1.
For each dataset, use the 7 regression models listed in Table 1 (Linear Regression, SGD Regressor, Kernel Ridge, Elastic Net, Bayesian Ridge, Gradient Boosting Regressor, and SVR) with XAISuite to predict first-level model accuracy from SHAP and LIME correlation, as computed in the preliminary steps. Record the performance scores of these second-level models. Values above p are taken to support the hypothesis. 55 5 We understand that low accuracies of second-level models could be attributed to the small size of the dataset generated from the first-level models (there are only 7 instances because there are 7 models). We leave it to others to determine if our results hold for larger training sizes for second-level models, i.e. use of more first-level models, and for non-tabular datasets.
Repeat the preliminary steps and the above step m times to ensure consistency of results. Recall from the preliminary steps that we took m = 5.
We now present a possible algorithm to implement this step in Pythonic language, but this algorithm can be generalized to support other programming languages as well. Implementations of the train, Corr, and getExplanations functions are not shown because they are not contributions of this paper. 66 6 In the case of Python, Train is implemented in sklearn, Corr is implemented in pandas, and getExplanations is implemented in OmniXAI.
While the getExplanations is not a contribution of this paper, we give a representative image of its output below, as we believe it will help in understanding the algorithm. We use the function provided by OmniXAI library’s utilities as an example.

3.2.3 Does using maximum importance scores per instance instead of feature-specific importance scores provide more consistent correlation between explanatory systems?
We hypothesize that if we use the maximum importance score, i.e. the magnitude of the score of the most important feature in each instance, the explanatory results will be more consistent than if we use the average correlation across all features. We test our hypothesis by following the preliminary procedure and the following step:
- 1.
For each dataset, compare the variance of the list of correlations for only the most important feature for each model versus the variance for the average correlation of feature importance scores across all features for these same models.
Repeat the above steps m times to ensure consistency of results. Recall from the preliminary steps that we took m = 5.
4 Results
Because we cannot include all generated graphs, we use this space to show the visuals and numbers we feel are the most important in supporting the conclusions of the paper. All data and figures can be found in Appendix 9. Furthermore, since the results of all 10 of our trials were identical, we present the results of a single representative trial.


In the correlation heatmaps below, each column is a feature (not labeled).


Below, we present the correlation and accuracy data used in analyzing the results of our study. These values are rounded to three decimal places.
Note: An X in Tables 2-5 indicates that the correlation was undefined. For the purpose of this paper, we take undefined correlations to be equivalent to zero correlation. Since the focus is on the relationship between model and correlation and not on features, the specific feature names are not listed in this table. Each row in Tables 2-5 represents a particular feature.
| Linear | SGD | Kernel Ridge | Elastic Net | Bayesian Ridge | Gradient Boosting | SVR |
|---|---|---|---|---|---|---|
| 0.757 | 0.862 | 0.779 | X | 0.774 | 0.563 | 0.844 |
| 0.932 | 0.933 | 0.933 | 0.933 | 0.931 | 0.867 | 0.934 |
| 0.943 | 0.945 | 0.943 | 0.947 | 0.943 | 0.817 | 0.945 |
| 0.914 | 0.896 | 0.913 | 0.705 | 0.909 | 0.521 | 0.699 |
| 0.926 | 0.919 | 0.925 | 0.915 | 0.878 | 0.679 | 0.510 |
| 0.646 | 0.887 | 0.779 | 0.899 | 0.882 | 0.823 | 0.945 |
| 0.955 | 0.944 | 0.947 | 0.957 | 0.949 | 0.574 | 0.976 |
| 0.943 | 0.943 | 0.941 | 0.941 | 0.940 | 0.931 | 0.945 |
| 0.774 | 0.852 | 0.841 | 0.905 | 0.847 | 0.537 | 0.929 |
| 0.993 | 0.997 | 0.994 | 0.992 | 0.997 | 0.949 | 0.950 |
| Linear | SGD | Kernel Ridge | Elastic Net | Bayesian Ridge | Gradient Boosting | SVR |
|---|---|---|---|---|---|---|
| 0.981 | 0.982 | 0.981 | 0.982 | 0.981 | 0.935 | 0.957 |
| 0.846 | 0.917 | 0.874 | X | 0.845 | 0.309 | 0.728 |
| 0.210 | 0.199 | 0.210 | X | 0.271 | 0.305 | 0.421 |
| 1.000 | 1.000 | 1.000 | 1.000 | 1.000 | 0.995 | 0.992 |
| 0.954 | 0.954 | 0.954 | 0.953 | 0.955 | 0.977 | 0.959 |
| 0.968 | 0.968 | 0.969 | 0.968 | 0.968 | 0.991 | 0.991 |
| 0.954 | 0.952 | 0.954 | 0.955 | 0.954 | 0.719 | 0.930 |
| 0.914 | 0.922 | 0.920 | 0.922 | 0.917 | 0.956 | 0.922 |
| Log. | Gauss.NB | KNeighbors | Dec.Tree | Ran.Forest | GradBoost | Multi.NB |
|---|---|---|---|---|---|---|
| X | X | X | X | X | X | X |
| 0.115 | 0.610 | 0.351 | 0.092 | -0.000 | 0.191 | 0.005 |
| 0.741 | 0.014 | 0.432 | 0.501 | -0.012 | 0.599 | 0.326 |
| 0.525 | -0.053 | X | X | X | X | 0.454 |
| 0.757 | -0.045 | X | 0.100 | -0.006 | X | 0.364 |
| 0.553 | 0.085 | 0.363 | 0.677 | 0.155 | 0.248 | 0.193 |
| 0.522 | 0.107 | 0.496 | 0.431 | -0.046 | 0.032 | 0.401 |
| 0.250 | 0.521 | 0.450 | 0.257 | 0.022 | 0.506 | 0.303 |
| 0.207 | 0.013 | 0.125 | 0.029 | -0.128 | 0.252 | 0.069 |
| 0.279 | -0.113 | 0.414 | 0.131 | X | X | 0.287 |
| 0.777 | 0.030 | 0.676 | 0.467 | -0.020 | 0.701 | 0.722 |
| 0.288 | -0.006 | X | 0.281 | X | X | 0.070 |
| 0.775 | 0.046 | X | 0.062 | 0.029 | 0.579 | 0.662 |
| 0.642 | 0.024 | 0.749 | 0.480 | 0.236 | 0.756 | 0.291 |
| 0.156 | -0.112 | 0.147 | 0.144 | 0.000 | X | 0.052 |
| 0.158 | 0.598 | 0.292 | 0.188 | 0.012 | 0.434 | 0.086 |
| 0.192 | 0.026 | 0.059 | 0.003 | 0.124 | -0.464 | X |
| 0.046 | -0.081 | 0.118 | -0.007 | 0.232 | X | -0.015 |
| 0.837 | 0.008 | 0.676 | 0.669 | -0.113 | 0.731 | 0.751 |
| 0.820 | 0.029 | 0.618 | 0.510 | 0.125 | 0.765 | 0.709 |
| 0.776 | 0.079 | 0.759 | 0.436 | 0.100 | 0.738 | 0.815 |
| 0.496 | -0.157 | 0.820 | 0.372 | -0.025 | 0.119 | -0.016 |
| 0.185 | -0.165 | 0.488 | 0.070 | 0.032 | X | -0.004 |
| 0.294 | 0.366 | 0.284 | 0.259 | X | 0.164 | 0.003 |
| -0.001 | -0.065 | -0.004 | 0.115 | -0.058 | X | -0.042 |
| 0.162 | 0.063 | 0.552 | 0.370 | -0.005 | -0.035 | -0.014 |
| 0.667 | 0.057 | 0.803 | 0.664 | 0.427 | 0.826 | 0.635 |
| 0.753 | 0.086 | 0.449 | 0.450 | -0.008 | 0.780 | 0.581 |
| 0.784 | -0.050 | 0.919 | 0.621 | 0.817 | 0.868 | 0.932 |
| 0.748 | -0.100 | 0.576 | 0.685 | X | 0.854 | 0.763 |
| 0.724 | -0.122 | 0.793 | 0.325 | X | 0.599 | 0.388 |
| 0.065 | 0.157 | 0.186 | 0.191 | X | 0.279 | 0.142 |
| X | X | X | X | X | X | X |
| 0.301 | -0.206 | 0.676 | 0.428 | 0.771 | 0.693 | 0.850 |
| 0.468 | -0.011 | 0.622 | 0.266 | -0.010 | 0.304 | 0.455 |
| 0.708 | 0.030 | 0.552 | 0.579 | X | 0.800 | 0.756 |
| 0.840 | 0.029 | 0.828 | 0.660 | 0.230 | 0.825 | 0.507 |
| 0.652 | -0.094 | 0.549 | 0.454 | -0.023 | 0.544 | 0.709 |
| 0.474 | -0.114 | 0.746 | 0.379 | 0.168 | X | 0.072 |
| X | X | X | X | X | X | X |
| -0.004 | 0.262 | 0.275 | 0.295 | 0.086 | X | 0.036 |
| 0.729 | -0.062 | 0.596 | 0.424 | -0.012 | 0.113 | 0.617 |
| 0.324 | -0.079 | 0.841 | 0.158 | 0.304 | 0.713 | 0.493 |
| 0.267 | -0.123 | 0.759 | 0.128 | 0.085 | 0.146 | 0.231 |
| 0.687 | -0.065 | 0.696 | 0.274 | 0.193 | 0.779 | 0.706 |
| 0.661 | 0.049 | 0.675 | 0.534 | 0.055 | 0.808 | 0.820 |
| 0.312 | -0.013 | 0.637 | 0.558 | 0.016 | 0.707 | 0.497 |
| 0.126 | 0.527 | 0.184 | 0.074 | -0.087 | 0.036 | 0.021 |
| X | X | X | X | X | X | X |
| 0.019 | 0.080 | 0.078 | X | 0.014 | X | X |
| 0.310 | 0.027 | 0.443 | 0.099 | -0.036 | 0.200 | 0.309 |
| 0.749 | -0.031 | 0.096 | 0.259 | 0.043 | 0.809 | 0.700 |
| 0.696 | -0.012 | X | 0.177 | X | 0.082 | 0.623 |
| 0.757 | -0.170 | 0.956 | 0.599 | 0.563 | 0.920 | 0.851 |
| 0.481 | -0.133 | 0.654 | 0.582 | X | 0.348 | 0.146 |
| 0.268 | 0.644 | 0.224 | 0.188 | 0.058 | 0.538 | 0.328 |
| X | X | X | X | X | X | X |
| 0.059 | 0.726 | 0.472 | 0.344 | 0.040 | 0.058 | -0.033 |
| 0.776 | 0.116 | 0.466 | 0.458 | -0.009 | 0.448 | 0.472 |
| 0.486 | -0.037 | X | X | 0.114 | X | 0.019 |
| 0.862 | 0.078 | 0.897 | 0.847 | 0.507 | 0.843 | 0.834 |
| 0.201 | -0.164 | 0.888 | 0.019 | -0.025 | -0.007 | 0.039 |
| 0.604 | -0.112 | 0.516 | 0.487 | -0.028 | 0.236 | 0.856 |
| 0.447 | 0.809 | 0.391 | 0.249 | -0.006 | 0.182 | 0.317 |
| Log. | Gauss.NB | KNeighbors | Dec.Tree | Ran.Forest | GradBoost | Multi.NB |
|---|---|---|---|---|---|---|
| 0.666 | 0.522 | 0.903 | 0.569 | 0.418 | 0.283 | 0.603 |
| 0.695 | 0.633 | 0.886 | 0.430 | 0.394 | 0.230 | 0.039 |
| 0.901 | 0.747 | 0.793 | 0.592 | 0.512 | 0.565 | 0.871 |
| 0.806 | 0.701 | 0.800 | 0.653 | X | 0.644 | 0.693 |
In the tables and graphs below, Correlation Max is referenced. This is the correlation between the maximum importance scores regardless of feature for each instance in a dataset. For the purpose of conciseness, we do not attach tables of instance-specific maximum importance scores, nor do we mention what features correspond to specific maximum importance scores. These tables and graphs were essential to our comparison of average explainer correlation with correlation of maximum importance scores and model accuracy.
We now focus on each dataset.
Diabetes Regression Analysis
| First Level Model | Avg. Correlation | Correlation Max | Accuracy |
|---|---|---|---|
| Linear | 0.878 | 0.335 | 0.332 |
| SGD | 0.918 | 0.832 | 0.323 |
| Kernel Ridge | 0.900 | 0.492 | -4.043 |
| Elastic Net | 0.819 | 0.851 | 0.357 |
| Bayesian Ridge | 0.905 | 0.844 | 0.332 |
| Gradient Boosting | 0.726 | 0.743 | 0.203 |
| SVR | 0.868 | 0.805 | 0.128 |


| Second Level Model | Accuracy |
|---|---|
| Linear | -1.212 |
| SGD | -0.981 |
| KernelRidge | -0.904 |
| ElasticNet | -1.182 |
| BayesianRidge | -1.207 |
| GradientBoostingRegressor | -1.206 |
| SVR | -1.152 |
Energy Efficiency Regression Analysis
| First Level Model | Avg. Correlation | Correlation Max | Accuracy |
|---|---|---|---|
| Linear | 0.853 | 0.666 | 0.909 |
| SGD | 0.862 | 1.000 | 0.905 |
| Kernel Ridge | 0.858 | 0.294 | -3.618 |
| Elastic Net | 0.723 | 0.989 | 0.799 |
| Bayesian Ridge | 0.861 | 0.449 | 0.908 |
| Gradient Boosting | 0.773 | 0.854 | 0.997 |
| SVR | 0.863 | 0.732 | 0.917 |


| Second Level Model | Accuracy |
|---|---|
| Linear | -1.003 |
| SGD | -0.767 |
| KernelRidge | -0.362 |
| ElasticNet | -0.988 |
| BayesianRidge | -0.989 |
| GradientBoostingRegressor | -0.992 |
| SVR | -0.983 |
Digits Classification Analysis
| First Level Model | Avg. Correlation | Correlation Max | Accuracy |
|---|---|---|---|
| Logistic Regression | 0.467 | 0.138 | 0.961 |
| GaussianNB | 0.0644 | 0.199 | 0.778 |
| KNeighbors | 0.515 | 0.210 | 0.969 |
| DecisionTree | 0.341 | 0.0167 | 0.842 |
| RandomForest | 0.100 | 0.0496 | 0.975 |
| GradientBoosting | 0.461 | 0.200 | 0.956 |
| MultinomialNB | 0.389 | 0.036 | 0.914 |


| Second Level Model | Accuracy |
|---|---|
| Linear | 0.675 |
| SGD | -111.835 |
| KernelRidge | -1080.793 |
| ElasticNet | -2.016 |
| BayesianRidge | -1.326 |
| GradientBoostingRegressor | -2.425 |
| SVR | -5.522 |
Iris Classification Task
| First Level Model | Avg. Correlation | Correlation Max | Accuracy |
|---|---|---|---|
| Logistic Regression | 0.767 | 0.544 | 1.000 |
| GaussianNB | 0.651 | 0.613 | 0.967 |
| KNeighbors | 0.845 | 0.930 | 1.000 |
| DecisionTree | 0.561 | 0.384 | 1.000 |
| RandomForest | 0.442 | 0.444 | 1.000 |
| GradientBoosting | 0.431 | 0.155 | 1.000 |
| MultinomialNB | 0.552 | 0.279 | 0.567 |


| Second Level Model | Accuracy |
|---|---|
| Linear | -0.863 |
| SGD | -0.092 |
| KernelRidge | -13.159 |
| ElasticNet | -0.939 |
| BayesianRidge | -0.919 |
| GradientBoostingRegressor | -1.000 |
| SVR | -0.852 |
Below, we present a table of the variances of Avg Correlation and Correlation Max for all datasets. This data contradicts our hypothesis that Correlation Max will be less variable and therefore a more reliable indicator of SHAP-LIME correlations for all tasks.
| Dataset | ||
|---|---|---|
| Diabetes | 0.004 | 0.042 |
| Energy Efficiency | 0.003 | 0.071 |
| Digits | 0.033 | 0.007 |
| Classification | 0.032 | 0.063 |
5 Discussion
Both our hypotheses were not supported by the results of the study. Before we delve into the implications of the results, we first address some aspects of our data collection.
The undefined correlation values (indicated by X) occur when one explanatory system believes a feature is completely irrelevant to the model’s predictions, while the other explanatory system disagrees. We leave further study of the implications of these undefined correlations to the readers. We do note however that some models, such as Elastic Net, are more likely to result in undefined correlations than others.
Correlations predict model accuracy? The results showed that correlation between SHAP and LIME importance scores cannot be used to deduce the accuracy of a given model, as the performance of all second-level models except for Linear Regression in the digits classification task was negative or otherwise below p = 0.5. This is an important finding, which we use to postulate the following axiom that should be used for caution in future studies involving explanatory systems and machine learning models:
Proposition 1 (Relationship between explanation correlation between two different explainers and model accuracy).
Let be an interval. Define and to be two explanatory monitors. Let be the accuracy achieved by some machine learning model over interval . Furthermore, let and be the importance scores of and , respectively.
Assume that and are given. We cannot infer based on the correlation between and .
Use of maximum importance scores for each feature in a dataset presents a more consistent explanatory comparison method than using all importance scores? The results showed that this is not true. Using only the maximum importance scores sometimes led to more variance in correlations between explanatory systems and therefore is not more reliable. This is an important finding, which we use to postulate the following axiom that should be used for caution in future studies involving explanatory systems and machine learning models:
Proposition 2 (Correlation between maximum importance scores is not more consistent than correlation for all importance scores).
Consider and , which are two importance scores defined over a set, of features: for each instance. Define as the correlation between the importance scores and across all instances for a particular feature . And let be the correlation between the maximum importance scores, and , across all instances for each model.
i and , variance( is not necessarily less than
Additional Work In addition to the XAISuite Framework and the result of our study, we would also like to briefly mention several related projects that we believe have relevance to a discussion about the XAISuite framework. Images of these tools in action can be found in Appendix 11.
- 1.
XAISuiteCLI: A comprehensive machine learning explainability command-line tool keeping with the XAISuite framework’s emphasis on usability. This utility allows users to train and explain machine learning models using shell commands.
- 2.
XAISuiteGUI: A comprehensive graphical user interface that allows users without coding experience to train, explain, and compare machine learning models.
- 3.
XAISuiteBlock: A block-based site inspired by Scratch for machine learning model training and explanation. This is meant to offer machine learning utilities to those without coding experience. This is a great step forward in making machine learning explainability available to everyone regardless of age or coding experience. We envision it as a potential educational tool.
Future Work Our work opens up new areas of possible research. While we performed our analysis with 4 datasets and 7 models for each type of learning task, we encourage others to replicate our work with more datasets and models to confirm our results. Furthermore, we understand that SHAP and LIME are inherently mathematical models, and we look forward to a mathematical basis for the results of our study. Finally, our goal is that the results of this paper, along with the framework we outline, will facilitate further efforts to resolve discrepancies between explanatory systems so that humans can gain a clearer understanding of how machine learning models work. This will lead, in turn, to a greater ability to fine tune these models to prevent error.
Supplementary information
Additional files with all LIME and SHAP importance scores calculated by the authors for the purpose of this paper are included in Appendix 9, except those that are presented in the Results section.
Additional graphs can also be found in Appendix 9.
6 Conclusions
Explanatory systems allow users to look through the “black box” of machine learning models. This is not only useful in understanding the internal mechanisms of machine learning models but also is essential in diagnosing model malfunctions. However, when multiple explanatory systems differ, users do not know which one to trust.
This paper attempts to quantify and isolate scenarios leading to discrepancies between two widely used, open source machine learning explanatory systems, SHAP and LIME. By comparing importance scores for 14 models on a total of 4 varied tabular datasets, we gain important insights into the variability of importance scores and their implication on model accuracies. In the process, we construct the XAISuite framework, an important step towards making explanatory systems more accurate and understandable in the future.
Our paper finds that explanatory correlations cannot be used to predict model accuracy. Thus, if two explanatory systems differ, we cannot conclude that a model is necessarily less accurate, and vice versa. This has implications for user trust. Because users are often only supplied with model accuracy and explainer importance scores, this means that users do not have any information for determining which explanatory system is more accurate.
Our paper also finds that the most important feature as determined by explanatory systems differs from explainer to explainer. More importantly, simply looking at the correlations between two explainers’ top importance scores does not provide a more consistent way to compare explainers. Correlations vary from model to model and dataset to dataset, with no obvious pattern.
Machine learning is a powerful tool. By arming users of machine learning with the information they need to make decisions, XAISuite increases trust. Furthermore, through its contribution of several interfaces catered to people regardless of age or coding experience, XAISuite empowers the use of machine learning among those that would be previously unable to do so. Finally, by setting the example for a comprehensive framework on machine learning explainability, XAISuite makes the entire process of machine learning more transparent and understandable.
Declarations
- •
Funding Not applicable
- •
Conflict of interest Not applicable
- •
Ethics approval Not applicable
- •
Consent to participate Not applicable
- •
Consent for publication Not applicable
- •
Availability of data and materials All datasets used in this paper are on the public domain. All datasets except for the Energy Efficiency Dataset can be found on sk-learn’s website. The Energy Efficiency Dataset can be found in UC Irvine’s machine learning repository.energyefficiency
- •
Code availability Any code used in this paper is the authors’ own. See Appendix 8 for more details
- •
Authors’ contributions This paper was mainly written by Shreyan Mitra. Leilani Gilpin served in advisory capacity.
7 Elaborated Framework for Users
Starting from the next page, we include a simplified version of our framework with helpful implementation tips.
See pages 1 of XAISuiteFlowchart.pdfSee pages 2 of XAISuiteFlowchart.pdfSee pages 3 of XAISuiteFlowchart.pdf
8 Algorithm and Demo Code for Model Training and Explanation Generation (Online)
An example of implementation for the XAISuite framework can be found in the XAISuite library public repository on Github: XAISuite
This link also contains additional utilities, like a command-line tool, a graphical user interface, and a block-coding site for beginners. Learn more at the XAISuite website.
9 Database, Supplementary Tables, and Graphs (Online)
Go the link: Full Experimental Results This contains an entire database of collected importance scores, along with visuals that supplement this paper.
10 Additional Code
Setup Script
11 Additional User Tools
XAISuiteCLI

XAISuiteBlock

XAISuiteGUI
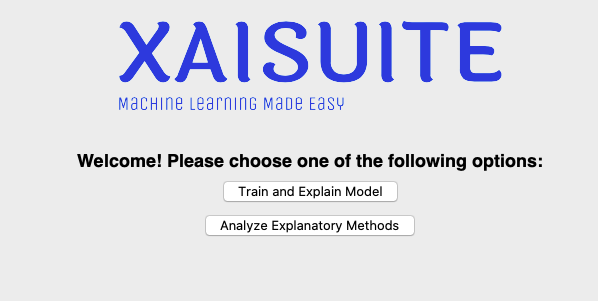
XAISuiteWeb XAISuite’s website provides access to the codebase, package, various user tools, and a coding playground to test XAISuite out.

References
- (1) Nirmal, D.: Machine learning is everywhere: Preparing for the future (2017). https://www.datanami.com/2017/07/03/machine-learning-everywhere-preparing-future/
- (2) Lakshmanan, L.: Why you need to explain machine learning models google cloud blog. Google (2021). https://cloud.google.com/blog/products/ai-machine-learning/why-you-need-to-explain-machine-learning-models
- (3) Angwin, J., Larson, J., Kirchner, L., Mattu, S.: Machine bias (2016). https://www.propublica.org/article/machine-bias-risk-assessments-in-criminal-sentencing
- (4) Wakabayashi, D.: Self-driving uber car kills pedestrian in arizona, where robots roam. The New York Times 19(03) (2018)
- (5) Jones, R.: Report: Uber’s self-driving car sensors ignored cyclist in fatal accident. Gizmodo (2018). https://gizmodo.com/report-ubers-self-driving-car-sensors-ignored-cyclist-1825832504
- (6) Rose, C., McLaughlin, E., Liu, R., Koedinger, K.: Explanatory learner models: Why machine learning (alone) is not the answer. BERA doi: https://doi.org/10.1111/bjet.12858 (2019)
- (7) Gilpin, Bau, Yuan, Specter, Kagal: Explaining explanations: An overview of interpretability of machine learning. In: 2018 IEEE 5th International Conference on Data Science and Advanced Analytics (DSAA) (2019)
- (8) Lundberg, S.M., Lee, S.-I.: A unified approach to interpreting model predictions. In: Guyon, I., Luxburg, U.V., Bengio, S., Wallach, H., Fergus, R., Vishwanathan, S., Garnett, R. (eds.) Advances in Neural Information Processing Systems 30, pp. 4765–4774. Curran Associates, Inc., ??? (2017). http://papers.nips.cc/paper/7062-a-unified-approach-to-interpreting-model-predictions.pdf
- (9) Ribeiro, M.T., Singh, S., Guestrin, C.: ”why should I trust you?”: Explaining the predictions of any classifier. In: Proceedings of the 22nd ACM SIGKDD International Conference on Knowledge Discovery and Data Mining, San Francisco, CA, USA, August 13-17, 2016, pp. 1135–1144 (2016)
- (10) Ritter, S., Barrett, D.G.T., Santoro, A., Botvinick, M.M.: Cognitive Psychology for Deep Neural Networks: A Shape Bias Case Study. arXiv (2017). https://doi.org/10.48550/ARXIV.1706.08606. https://arxiv.org/abs/1706.08606
- (11) Goel, K., Sindhgatta, R., Kalra, S., Goel, R., Mutreja, P.: The effect of machine learning explanations on user trust for automated diagnosis of COVID-19. U.S. National Library of Medicine (2022). https://www.ncbi.nlm.nih.gov/pmc/articles/PMC9080676/
- (12) Han, T., Srinivas, S., Lakkaraju, H.: Which explanation should i choose? a function approximation perspective to characterizing post hoc explanations. arXiv preprint arXiv: 2206.01254.pdf (2022)
- (13) Riveiro, M., Thill, S.: “that’s (not) the output i expected!” on the role of end user expectations in creating explanations of ai systems (2021)
- (14) Ehrlich, K., Kirk, S.E., Patterson, J., Rasmussen, J.C., Ross, S.I., Gruen, D.M.: Taking advice from intelligent systems: The double-edged sword of explanations. In: Proceedings of the 16th International Conference on Intelligent User Interfaces. IUI ’11, pp. 125–134. Association for Computing Machinery, New York, NY, USA (2011). https://doi.org/10.1145/1943403.1943424. https://doi.org/10.1145/1943403.1943424
- (15) Riveiro, M., Thill, S.: The challenges of providing explanations of ai systems when they do not behave like users expect. In: Proceedings of the 30th ACM Conference on User Modeling, Adaptation and Personalization. UMAP ’22, pp. 110–120. Association for Computing Machinery, New York, NY, USA (2022). https://doi.org/10.1145/3503252.3531306. https://doi.org/10.1145/3503252.3531306
- (16) Chazette, L., Klös, V., Herzog, F., Schneider, K.: Requirements on explanations: A quality framework for explainability. In: 2022 IEEE 30th International Requirements Engineering Conference (RE), pp. 140–152 (2022). https://doi.org/10.1109/RE54965.2022.00019
- (17) Otte, C.: Safe and interpretable machine learning: A methodological review. In: Moewes, C., Nürnberger, A. (eds.) Computational Intelligence in Intelligent Data Analysis, pp. 111–122. Springer, Berlin, Heidelberg (2013)
- (18) Burkart, Huber: A survey on the explainability of supervised machine learning. (2021). https://doi.org/10.1613/jair.1.12228
- (19) Ghassemi, M., Oakden-Rayner, L., Beam, A.L.: The false hope of current approaches to explainable artificial intelligence in health care. The Lancet Digital Health 3(11), 745–750 (2021). https://doi.org/10.1016/s2589-7500(21)00208-9
- (20) Krishna, S., Han, T., Gu, A., Pombra, J., Jabbari, S., Wu, S., Lakkaraju, H.: The Disagreement Problem in Explainable Machine Learning: A Practitioner’s Perspective. arXiv (2022). https://doi.org/10.48550/ARXIV.2202.01602. https://arxiv.org/abs/2202.01602
- (21) Covert, I., Lundberg, S., Lee, S.-I.: Explaining by removing: A unified framework for model explanation. arXiv preprint arXiv:2011.14878.pdf (2022)
- (22) Roy, S., Laberge, G., Roy, B., Khomh, F., Nikanjam, A., Mondal, S.: Why don’t xai techniques agree? characterizing the disagreements between post-hoc explanations of defect predictions. In: 2022 IEEE International Conference on Software Maintenance and Evolution (ICSME), pp. 444–448 (2022). https://doi.org/10.1109/ICSME55016.2022.00056
- (23) van der Waa, J., Nieuwburg, E., Cremers, A., Neerincx, M.: Evaluating xai: A comparison of rule-based and example-based explanations. Artificial Intelligence 291, 103404 (2021). https://doi.org/10.1016/j.artint.2020.103404
- (24) Duell, J., Fan, X., Burnett, B., Aarts, G., Zhou, S.-M.: A comparison of explanations given by explainable artificial intelligence methods on analysing electronic health records. In: 2021 IEEE EMBS International Conference on Biomedical and Health Informatics (BHI), pp. 1–4 (2021). https://doi.org/10.1109/BHI50953.2021.9508618
- (25) Lee, K., Ayyasamy, M.V., Ji, Y., Balachandran, P.V.: A comparison of explainable artificial intelligence methods in the phase classification of multi-principal element alloys. Scientific Reports 12(1), 11591 (2022). https://doi.org/10.1038/s41598-022-15618-4
- (26) Agarwal, C., Saxena, E., Krishna, S., Pawelczyk, M., Johnson, N., Puri, I., Zitnik, M., Lakkaraju, H.: Openxai: Towards a transparent evaluation of model explanations. arXiv preprint arXiv:2206.11104 (2022)
- (27) Yang, W., Le, H., Savarese, S., Hoi, S.: Omnixai: A library for explainable ai (2022) arXiv:206.01612. https://doi.org/10.48550/ARXIV.2206.01612
- (28) Kokhlikyan, N., Miglani, V., Martin, M., Wang, E., Alsallakh, B., Reynolds, J., Melnikov, A., Kliushkina, N., Araya, C., Yan, S., Reblitz-Richardson, O.: Captum: A unified and generic model interpretability library for PyTorch (2020)
- (29) Xifara, A., Tsanas, A.: Energy Efficiency Dataset (2012). https://archive.ics.uci.edu/ml/datasets/energy+efficiency