Ab-initio Simulations of Coherent Phonon-Induced Pumping of Carriers in Zirconium Pentatelluride
Abstract
Abstract
Laser-driven coherent phonons can act as modulated strain fields and modify the adiabatic ground state topology of quantum materials. Here we use time-dependent first-principles and effective model calculations to simulate the effect of the coherent phonon induced by strong terahertz electric field on electronic carriers in the topological insulator ZrTe5. We show that a coherent Raman mode modulation can effectively pump carriers across the band gap, even though the phonon energy is about an order of magnitude smaller than the equilibrium band gap. We reveal the microscopic mechanism of this effect which occurs via Landau-Zener-Stückelberg tunneling of Bloch electrons in a narrow region in the Brillouin zone center where the transient energy gap closes when the system switches from strong to weak topological insulator. The quantum dynamics simulation results are in excellent agreement with recent pump-probe experiments in ZrTe5 at low temperature.
I Introduction
Coherent phonons that are excited by laser pulses in the THz or mid-infrared frequency range Först et al. 2011; Merlin 1997; Dhar et al. 1994 can provide nonthermal pathways for the dynamical control of quantum phases of condensed matter Basov et al. 2017; Mankowsky et al. 2016; de la Torre et al. 2021; Disa et al. 2021. Recent experimental demonstrations include ultrafast phononic manipulation of magnetic orders Stremoukhov et al. 2022; Stupakiewicz et al. 2021; Nova et al. 2017, of insulator to metal phase transitions Rini et al. 2007; Caviglia et al. 2012; Horstmann et al. 2020, and a transient enhancement of martensitic phase Song et al. 2023 and superconducting correlations Kaiser et al. 2014; Hu et al. 2014; Mankowsky et al. 2014; Mitrano et al. 2016. In topological quantum materials, coherent phonon excitations were shown to induce dynamical switching between different topological phases by modifying the crystal symmetry and by tuning strain fields Garate 2013; Saha and Garate 2014; Kim and Jhi 2015; Wang et al. 2017; Weber et al. 2018; Sie et al. 2019; Vaswani et al. 2020; Luo et al. 2021; Wang 2021. Particularly, recent coherent phonon pumping work provides compelling evidence of light-induced Dirac points Vaswani et al. 2020, Weyl nodes Luo et al. 2021 and enhanced stability of topological systems Yang et al. 2020; Yang et al. 2018.
The theoretical understanding and first-principles simulations of light-excited electron-ion quantum systems are challenging, but significant progress has been achieved in recent years Prezhdo 2021; Lindh and González 2020; Nelson et al. 2020; Curchod and Martínez 2018; Caruso and Zacharias 2023. Specifically to describe the ultrafast electronic and spin dynamics associated with phonon excitations, microscopic theories have been developed for the light-induced insulator-to-metal structural phase transition Subedi et al. 2014, the switching of magnetic orders Gu and Rondinelli 2018, and the enhancement of superconducting correlations through symmetry-allowed electron-phonon coupling Raines et al. 2015; Komnik and Thorwart 2016; Knap et al. 2016; Patel and Eberlein 2016; Kennes et al. 2017; Babadi et al. 2017; Mazza and Georges 2017; Murakami et al. 2017; Sentef 2017; Schütt et al. 2018. Here, we theoretically investigate the switching between strong and weak topological insulators (STI and WTI) induced by THz-driven coherent Raman phonon excitations in the model Dirac system ZrTe5 Vaswani et al. 2020. Although a qualitative picture has previously been established using static density functional theory (DFT) calculations Vaswani et al. 2020, the ultrafast dynamics of the laser-driven system such as the observed continuous increase of electronic carrier density after the THz pump and the underlying mechanism, calls for a more in-depth quantum dynamics simulations. The progress in this direction is highly appealing to the experimental community, who have been actively pursuing THz-driven quantum dynamics in various quantum materials recently Luo et al. 2023; Kim et al. 2021a; Liu et al. 2020a; Liu et al. 2020b.
In this paper, we simulate the coherent phonon-induced carrier dynamics in ZrTe5 in the framework of time-dependent Schrödinger equation with DFT basis functions. We complement the DFT-based dynamics simulations by an effective model calculations that captures the essentials of the microscopic mechanism. Our detailed numerical analysis shows that the switching between STI and WTI, which necessarily involves the closing of the bulk gap, creates a small but finite volume in momentum space, where effective two-level systems (TLSs) undergo avoided level crossings. This results in Landau-Zener-Stückelberg (LZS) tunnelling Landau 1932; Zener 1932; Stückelberg 1932; Majorana 1932; Shevchenko et al. 2010; Ivakhnenko et al. 2023 and leads to an increase of the carrier concentration during several cycles of the coherent phonon modulation. Our time-dependent Schrödinger equation simulations predict the dynamics of the phonon-induced carrier concentration in quantitative agreement with experiment.
II Results and discussion
II.1 Summary of previous pump-probe experimental results
To facilitate the presentation, we summarize the key results of the THz pump-THz probe experiment on ZrTe5 at K, which is described in detail in Ref. Vaswani et al. 2020. These results motivate the numerical simulations in this work. In the experiment, an intense THz-pump pulse with an -field trace plotted in Fig. 1(a) is incident normally on the ZrTe5 single crystal. The THz pump-induced coherent phonon emission from the sample is observed after the pump pulse between ps ps, as highlighted in Fig. 1(b). The coherent phonon emission lasts for about five full cycles and its dominant spectral peak at THz after Fourier transformation matches the Raman mode at the Brillouin zone center. By performing THz pump and THz probe measurements using the same pump pulse, the THz probe differential transmission , which is proportional to the change of carrier density , is obtained and plotted in Fig. 1(c). The carrier density continuously increases after the pump pulse as long as the coherent phonon emission is observed. It saturates for ps, which coincides with the loss of phonon coherence. decays back to zero after about ps Vaswani et al. 2020.
In this paper, we focus on simulating this intriguing carrier excitation dynamics for the time period ps ps, where the coherent phonon excitation is present. The residual pump pulse is negligible during this time period, and the coherent phonon excitation can be treated as preexisting, i.e., without explicitly modelling the light-driven phonon generation process. The strong correlation between the carrier generation and the coherent phonon emission suggests a charge excitation mechanism assisted by a coherent Raman vibration. Indeed, by adiabatically following the phonon trajectory, static DFT calculations have revealed that the electronic state of the system undergoes a topological transition between STI to critical Dirac point (DP) to WTI Vaswani et al. 2020 (see also Appendix IV). This suggests the importance of the associated closing of the bulk band gap and potentially further topological effects in the carrier pumping process Vaswani et al. 2020. This makes a detailed quantum dynamics simulations of the physical process highly desirable.
II.2 Effective model description
Model setup. We first study a toy model that qualitatively captures the dynamical carrier generation observed experimentally in ZrTe5. This model includes the essential physics underlying this phenomenon which is the topological phase transition (driven by coherent phonon oscillations) and a resulting inter-band charge excitation. For simplicity, we consider a Kitaev chain model Akhmerov et al., which in momentum space is represented by the following two-orbital spinless fermion Bogoliubov-de Gennes (BdG) Hamiltonian:
| (1) |
Here are the Pauli matrices and the Hamiltonian parameters include onsite energy , nearest-neighbor hopping and a superconducting pairing amplitude . The momentum lies in the range . The model obeys particle hole symmetry .
With the chemical potential fixed at zero, the model exhibits a topological phase transition from a gapped superconductor that is trivial (NI) to one that is topological (TI) by tuning . The corresponding BdG band structures together with the orbital () projections of the wavefunction are shown in Fig. 2(a-e). This evolution of the band energies is qualitatively similar to the phonon-induced topological phase transition in ZrTe5 obtained from DFT calculations Vaswani et al. 2020; Aryal et al. 2021. The band structure in panels (a) to (d) are obtained for equal to , , to (a-d). The evolution of the band gap as a function of is shown in panel (e). The bands in panels (a-d) are plotted together with weight of the projection of the Bloch wave function onto the first basis orbital , as given by the size of the red circles. Clearly, a band inversion occurs when the system transforms from the trivial phase () to the topological phase (). At , the band gap closes and a nodal point forms at point. Consistently, the topological index, which can be defined as Akhmerov et al., is in the trivial and in the topological phase, as labelled in panels (a,c,d). For the numerical simulations, we set eV, and , which results in a mode speed at the Dirac point () that is in qualitative agreement with the Fermi velocity in ZrTe5.
To model the effect of the coherent phonon excitation in ZrTe5, we consider a periodic modulation of the onsite energy which resembles the treatment of electron-phonon coupling in the Holstein model Holstein 1959:
| (2) |
resulting in the time-dependent Hamiltonian
| (3) |
We choose THz ( fs, meV) to match the experimental value of the Raman mode frequency. We set and , such that the gap variation at the point is approximately the same as in ZrTe5 Vaswani et al. 2020, as shown in Fig. 2(e). Because the zone-center phonon carries zero momentum () it does not mix different Bloch momenta and the Hamiltonian thus remains block diagonal in momentum space. The quantum dynamics simulation can therefore be performed by solving the time-dependent Schrödinger equation separately at each -point:
| (4) |
We adopt a discrete-time propagator based on a Trotter decomposition of the state evolution Trotter 1959; Nielsen and Chuang 2011
| (5) |
where the time step is chosen sufficiently small compared to the variation of the onsite energy.
Dynamics simulation results. The simulation starts at time and evolves until time to agree with the experimental situation (see Fig. 1). We monitor the time-dependent excited state population , which corresponds to the excited carrier density in the experiment and is tied to the differential emission that is measured experimentally. In our simulations we obtain as a weighted sum of contributions at each -point in the Brillouin zone . The weight is obtained as with the total number of -points uniformly sampled in the Brillouin zone. Here we define
| (6) |
which is the size of the projection of the one-electron wavefunction on the adiabatic conduction band , an eigenstate of with eigenvalue . We use a step size fs and a uniform -mesh with points, and find that converges to a precision of .
In Fig. 2(f) we plot the excited state population as a function of time . We consider five modulation cycles of the onsite energy starting with . The black line represents the data at a momentum point close to the zone center , and the orange line is for momentum . The corresponding (instantaneous) energy gap at the respective -points versus is shown in Fig. 2(g). Sharp variations of are observed whenever the energy gap is minimal. In total we observe a substantial increase of from zero to a finite value at the two representative -points during the dynamical process. We note that the definition of (6) may not be unique. In Supplementary Note 1, we compare the numerical result with that based on an alternative definition, and show that the definition (6) gives more physically reasonable results.
The excited state population per unit cell, , is plotted as a black line in Fig. 2(h). It shows a similar behavior as at the two individual -points shown in Fig. 2(f). By the end of the simulation, has increased from zero to about . To account for the experimentally unknown initial phase of the coherent phonon oscillation, we also provide results that are averaged over that is uniformly sampled within the interval . The averaged results are shown in orange in Fig. 2(h) and also increase from zero to about during the simulations.
Discussion of toy model results. The dynamics of the wavefunction at different -points is completely independent from each other [see Eq. (4)]. The above calculation is thus composed of a collection of independent and periodically-driven two-level systems (TLSs), which resembles the well-known problem of LZS tunneling of a driven TLS in the presence of an avoided crossing Shevchenko et al. 2010; Ivakhnenko et al. 2023. The behavior of the TLS is largely determined by the potential ramp speed (i.e. the oscillation frequency of the drive) and the minimal energy gap in the avoided crossing. While the ramp speed is set by the phonon frequency ( THz), the minimal energy gap and the nature of the diabatic level crossing is strongly -point dependent. In Fig. 2 (i), we show the minimal gap versus in the range . The minimal gap changes almost linearly from to zero in the zone center () to about meV at . For reference, we also plot the THz phonon mode energy ( meV) as a dotted horizontal line. These findings suggest that the contribution to the excited carrier density arises from a small part in momentum space around the zone center.
To obtain a more quantitative analysis, we define the following time-averaged and -resolved excited state density:
| (7) |
We plot in Fig. 2 (j) for a simulation with , and find that it peaks in a -centered narrow -region. Interestingly, peaks occur in a wider range than naively expected by the condition that . This shows that higher order LZS resonances are important, where excitations occur across a minimal band gap that is a multiple of the driving frequency. Following the analysis of LZS tunneling, we define diabatic states . We find that the -range, where a diabatic level crossing occurs, , at some time , matches well with the region of significant as highlighted in blue. We observe several distinct peaks of in this region: the location of the peak closest to -point () and that of the peak furthest away () are close to the -points chosen for the presentation of in (f, g). The peaks can be understood by considering resonance condition of the multi-cycle LZS problem as detailed in the following paragraph.
Although there is no closed form for the solution of the general LZS problem, some analytical understanding can corroborate the numerical results Shevchenko et al. 2010; Ivakhnenko et al. 2023. To facilitate the discussion, we cast the time-dependent Hamiltonian (3) into the following form adopted in references Shevchenko et al. 2010; Ivakhnenko et al. 2023:
| (8) |
where we apply a rotation around -axis, and define , , with the offset:
| (9) |
and the amplitude . The level crossing of the diabatic states (eigenstates of ) occurs at , which requires for the specific parameters of the model we set. Since the occupation probability of the upper adiabatic state is known to be negligibly small if no diabatic level crossing occurs Shevchenko et al. 2010; Ivakhnenko et al. 2023, this is consistent with the narrow -range with significant electron population transfer as shown in Fig. 2 (j). The minimal energy gap between the two adiabatic (i.e. instantaneous) levels reads . It is reached simultaneously with the diabatic state level crossing, and shows a linear behavior at small as plotted in Fig. 2 (i). As detailed in references Shevchenko et al. 2010; Ivakhnenko et al. 2023, one can obtain an approximate analytic solution of the LZS problem, in the slow and the fast-passage limits. These limits are characterized by the dimensionless parameter , which characterizes the ratio of the minimal gap and the velocity at the minimal gap. The velocity is finite and only weakly varying in the region of interest close the before it rapidly drops to zero as . As a result, we find at small and at (see Fig. 2 (k)). In terms of this parameter, the LZ transition probability for a single passage reads . In the fast-passage limit at , we have and ; while in the slow-passage limit, we have and . In Fig. 2 (k) we plot these driving speed indicators in the -region with significant excited state occupation. The fast-passage regime extends from the -point (), where the minimal gap vanishes, roughly to the position of the first peak of at [see Fig. 2 (k)], where and . The resonance condition in the diabatic regime reads with integer . This condition is fulfilled at for and at for as shown in by the black vertical dashed lines in Fig. 2 (i), which explains the two dominant peaks seen in Fig. 2 (j). Note that we have and , which implies that is near the crossover from fast to slow passage. In fact, the resonance condition with gives as shown by a gray vertical dashed line in Fig. 2 (i), which is off from the peaks in Fig. 2 (j) due to being located close to the crossover region with and . At larger , the crossover from fast to slow passage occurs and one needs to use a more general resonance condition (see Eq. (56) in Ref. Ivakhnenko et al. 2023). Finally, for and beyond the slow-passage regime is reached, where we find a small adiabatic state probability. The resonance condition in the adiabatic regime reads with integer , which is not exactly fulfilled for our choice of parameters . One should also take into account that the dynamics only involves five LZS oscillations due to damping effects in experiments, which limits the total transfer into the upper adiabatic state (even on resonance) when . We conclude that the majority of the excited state population dynamics in our model occurs in the fast-passage region and the crossover regime between the fast and the slow-passage limits, and that the main peaks can be understood as arising from resonances in the diabatic regime.
To summarize, our analysis demonstrates the crucial role of the phonon-induced topological band closing for carrier excitation. This creates a finite momentum space volume where effective TLSs experience an avoided level crossing with a sufficiently small band gap such that carriers can be excited through LZS tunneling.
II.3 First-principles quantum dynamics simulations
Model and ab initio simulation method. To gain a more material-specific understanding of the carrier excitation dynamics of the phonon-modulated ZrTe5 system, we carry out first-principles simulations based on time-dependent Schrödinger equation with DFT basis functions. The time-dependence of the KS Hamiltonian is encoded in the ionic trajectory that is set by the coherent phonon. In the implementation of DFT for periodic systems one often adopts a basis set with large dimension, such as plane waves. This renders a direct manipulation of the DFT Hamiltonian cumbersome. Note that generally covers higher-energy unoccupied states and deeper occupied states, which are likely irrelevant for the carrier excitation dynamics in phonon-modulated ZrTe5, which we expect to be dominated by states close to the chemical potential. Standard tight-binding downfolding approaches, such as maximally localized Wannier function Marzari et al. 2012 and quasi-atomic minimal basis-set orbitals method Chan et al. 2007; Qian et al. 2008, can be useful; but the downfolding calculation for many snapshots along the trajectory in the simulation time period can be time-consuming, and the time-dependence of the downfolded orbitals introduces additional complexity. Here we adopt an alternative representation where the component of the dynamical electronic state is approximated as a linear combination of adiabatic states generalized to a generic -point from Ref. Granucci et al. 2012; Li et al. 2018:
| (10) |
where is a noninteracting single Slater determinant state defined by a set of occupied KS orbitals , which satisfies . Here the crystal momentum is conjugate to the position vector of the simulation unit cell.
The propagation of is encoded in the time-dependent complex amplitudes and the adiabatic states . Substituting Eq. (10) into the time-dependent Schrödinger equation leads to the equation of motion (EOM) of the amplitudes
| (11) |
The vibronic Hamiltonian is given by
| (12) |
Here, we define . The complex nonadiabatic coupling (NAC) coefficient between a pair of distinct states is given by , which is nonzero only if there is exactly one distinct occupied KS orbital between and due to the single Slater determinant nature Hammes-Schiffer and Tully 1994; Akimov and Prezhdo 2013. The NAC can be conveniently evaluated using the finite-difference method Hammes-Schiffer and Tully 1994:
| (13) | |||||
which is completely determined by the state overlap matrix between consecutive time steps.

Technical details of the simulation. The computational complexity of the simulation is tied to the number of adiabatic states that are used in Eq. (10). The Raman phonon in ZrTe5 has a frequency of THz, which is one order of magnitude smaller than the equilibrium band gap. We can thus truncate the expansion at the level of single-electron excitations between low energy bands. We include configurations with one electron excited from the top valence band to one of the four lowest conduction bands. We thus keep adiabatic states in the expansion at each -point. Each differs by exactly one occupied KS orbital, which therefore can also be labelled by the same index , with corresponding to the top valence band, and to the conduction bands in ascending order of energy. The vibronic Hamiltonian (12) can be simplified by setting as a rigid potential shift. The evaluation of the NAC (13) can also be reduced to
| (14) | |||||
which depends only on the KS orbitals that are kept at each -point.
The EOM (11) assumes the continuity of the time dependent basis with . Therefore, it is crucial to fix the phase degree of freedom of the KS orbitals . This can be achieved by consecutively applying a phase factor to , where the phase with is determined by the overlap with the same orbital at the previous time step. Additional complexity of the dynamics simulations originates from the presence of time-reversal and inversion symmetry, which renders every band doubly degenerate, and strong spin-orbit coupling in ZrTe5. The ambiguity in the doubly degenerate bands can be partially fixed by choosing a -gauge such that the spin matrix becomes diagonal in each doubly degenerate manifold via a unitary transformation. Numerically, we find that the gauge transformation is not sufficient to guarantee the orbital continuity along the dynamical path. Therefore, we propose the following overlap gauge correction to better address the band degeneracy problem. The simulation starts with orbitals in the -gauge, and apply unitary transformation in each doubly degenerate manifold in all following time steps, such that each rotated orbital has maximal overlap with the same one at the previous step. This is achieved by diagonalizing a series of matrices with . Here run through the two orbitals in the th degenerate doublet. The diagonalization gives two eigenvectors, where one has a nonzero eigenvalue and is assigned to the first orbital of the th doublet. The other eigenvector has zero eigenvalue, and is assigned to the second orbital in the doublet. Following this procedure, we numerically find that the self-overlap of each wavefunction at consecutive time steps always remains above . The band index exchange between different degenerate doublets, which can be detected by checking the overlap between wavefunctions at consecutive time steps, is not observed in the simulations reported here.
First-principles quantum dynamics simulation results. The analysis of the one-dimensional (1D) toy model results shows that the main contribution to the carriers in the excited band resulted from LZS tunneling in a narrow region of momentum space around the zone center . Expecting a similar behavior for the realistic 3D model of ZrTe5, we use a dense uniform -grid covering the full Brillouin zone for the following dynamics simulations and use a shift of from the -point for each -point. Here, are the reciprocal basis vectors. The center-shifted -mesh therefore excludes the -point, where the band gap closes at certain times and additional gauge correction is otherwise needed.
In Fig. 3(a) we present the excited state population as a function of simulation time for five phonon cycles, starting at with zero phonon displacement. Here we define
| (15) |
which is equivalent to the definition used in the toy model analysis. At momentum adjacent to the zone center, an electron is gradually excited from the top valence band () to the two lowest conduction bands () due to nonadiabatic effects. The complex NAC amplitude between the st and rd bands at the same -point is plotted in Fig. 3(b). The yellow line denotes the real part and the red line the imaginary part. The line width indicates the numerical noise, which is found to have negligible impact on the state population dynamics. The maximal difference in the dynamical state populations from the simulation using the (noisy) NAC amplitudes versus using smoothed data via application of a Savitzky–Golay filter is only about . Clearly, Fig. 3(a,b) shows that a sharp transition of the state population occurs at the peaks of the NAC. This also coincides with a minimum of the band gap, , as indicated by the blue shading in the background of Fig. 3(b). We note that has a similar time-dependence as [both bands have degenerate energies , yet with slightly larger amplitude. This difference in the NAC induces a larger electron occupancy in the band compared to the one with , as shown in Fig. 3(a). In contrast, the NACs from to are smaller by more than one order of magnitude, resulting in negligibly small carrier excitations to these bands, for .
The first-principles dynamics simulations allow for a direct and quantitative comparison to experiment. First, in Fig. 3(c) we show the excited state carrier density, as a function of time . It increases from zero to about cm-3 at the end of the simulation and exhibits qualitatively similar sharp transitions near dynamical band gap minimum as the momentum resolved quantity in Fig. 3(a). Within the uniform -mesh of the Brillouin zone, we find that the dominant contributions come from with . Next, we we account for the fact that in pump-probe experiments, the time-trace of differential transmission is obtained as an average over multiple runs and ZrTe5 samples exhibit some degree of electronic heterogeneity and nanostrip junctions, as observed in the THz nanoimaging Kim et al. 2021b. To capture these phenomena on average, we define , which is an average over simulations at different starting times. In Fig. 3 (d) we directly compare the time-dependence of a normalized (black), to the experimental data (orange). Both curves exhibit a similar growth pattern of the carrier density over time, and we also find the carrier density at the end of the simulation cm-3 to be in good agreement with the one estimated from experiment cm-3, considering that there is electronic heterogeneity present in the experimental ZrTe5 sample Kim et al. 2021b. The numerical estimation of and reported here also includes a factor of to take into account the double degeneracy of the top valence band in ZrTe5 system.
III Conclusions
We report detailed first-principle and effective model simulations of the carrier excitation dynamics in coherent phonon-modulated ZrTe5. Our results shed new light on recent pump-probe experiments Vaswani et al. 2020 by providing a clear intuitive explanation of the experimental results. Both first-principle and effective model calculations reveal the importance of the phonon-induced topological phase transition in ZrTe5 and the associated closing of the bulk gap for the observed excitation of carriers. We show that the excitations occur via Landau-Zener-Stückelberg tunneling in a series of time-dependent avoided level crossings of Bloch states located in a narrow region of momentum space around the zone center. Our detailed time-dependent Schrödinger equation simulations further show that the dominant tunneling occurs between the highest valence band and the lowest doubly degenerate conduction bands, while excitations to the next higher bands are negligible due to small transition matrix elements. We predict that the carrier density increases gradually with time and reaches a final value of cm-3 at when phonon coherence is lost in the experiment. These results are in good quantitative agreement with experiment. Our work thus demonstrates that the coherent charge excitation process in topological quantum materials such as ZrTe5 can be understood and predicted quantitatively by first-principles quantum dynamics simulations.
IV Methods
First-principles total energy and electronic-structure calculations for ZrTe5 are based on DFT with the exchange correlation functional in generalized gradient approximation parametrized by Perdew, Burke, and Ernzerhof (PBE) Perdew et al. 1996. Van der Waals interaction is included by Grimme’s damped atom-pairwise dispersion corrections (D2) Grimme 2006. The calculations are performed using the Vienna Ab initio Simulation Package (VASP) Kresse and Furthmüller 1996. We use a plane-wave cutoff energy of eV and include spin-orbit coupling for all the calculations. The phonon modes are calculated using the finite displacement approach as implemented in Phonopy Togo and Tanaka 2015. Specifically, we use the primitive unit cell of experimental structure( Å, Å, and Å) Matkovic and Matkovic 1992. The primitive vectors are Å, Å, and Å. The corresponding reciprocal primitive vectors are Å-1, Å-1, and Å-1. Highly accurate wavefunctions at specific -points are generated for NAC calculations by setting an energy convergence criterion to eV and requiring a minimum of electronic steps.
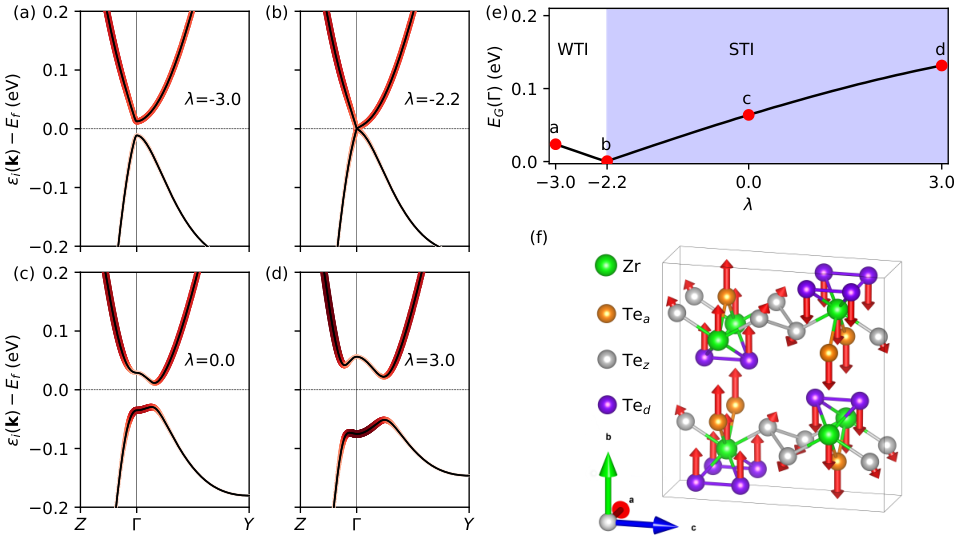
To be self-contained, we present the key DFT band structure calculation results for the description of the phonon-induced adiabatic topological phase transition observed in ZrTe5 system as reported in Ref. Vaswani et al. 2020. Under the modulation of the eigenmode as plotted in Fig. 4(f), the band gap at zone center closes at distortion parameter as shown in Fig. 4(e), implying a topological phase transition along the dynamical path. This is confirmed by the band structure analysis and topological invariant index calculation Vaswani et al. 2020. In Fig. 4(a-d), we plot the band structure along high-symmetry -path at phonon distortion parameter , decorated with red color indicating the Ted -orbital weight. Band inversion clearly occurs when passes through the Dirac point. For , the adiabatic state of the system is in WTI, and switches to STI for .
Data availability
All the data to generate the figures are available at figshare Jiang et al. 2023. Data supporting the calculations are available together with the codes at figshare Yao 2023. All other data are available from the corresponding authors on reasonable request.
Code availability
All the computer codes developed and used in this work are available open-source at figshare Yao 2023.
References
- Först et al. (2011) M. Först, C. Manzoni, S. Kaiser, Y. Tomioka, Y.-n. Tokura, R. Merlin, and A. Cavalleri, Nonlinear phononics as an ultrafast route to lattice control, Nat. Phys. 7, 854 (2011).
- Merlin (1997) R. Merlin, Generating coherent thz phonons with light pulses, Solid State Commun. 102, 207 (1997).
- Dhar et al. (1994) L. Dhar, J. A. Rogers, and K. A. Nelson, Time-resolved vibrational spectroscopy in the impulsive limit, Chem. Rev. 94, 157 (1994).
- Basov et al. (2017) D. Basov, R. Averitt, and D. Hsieh, Towards properties on demand in quantum materials, Nat. Mater. 16, 1077 (2017).
- Mankowsky et al. (2016) R. Mankowsky, M. Först, and A. Cavalleri, Non-equilibrium control of complex solids by nonlinear phononics, Rep. Prog. Phys. 79, 064503 (2016).
- de la Torre et al. (2021) A. de la Torre, D. M. Kennes, M. Claassen, S. Gerber, J. W. McIver, and M. A. Sentef, Colloquium: Nonthermal pathways to ultrafast control in quantum materials, Rev. Mod. Phys. 93, 041002 (2021).
- Disa et al. (2021) A. S. Disa, T. F. Nova, and A. Cavalleri, Engineering crystal structures with light, Nat. Phys. 17, 1087 (2021).
- Stremoukhov et al. (2022) P. Stremoukhov, A. Safin, S. Nikitov, A. Kirilyuk, et al., Phononic manipulation of antiferromagnetic domains in nio, New J. Phys. 24, 023009 (2022).
- Stupakiewicz et al. (2021) A. Stupakiewicz, C. Davies, K. Szerenos, D. Afanasiev, K. Rabinovich, A. Boris, A. Caviglia, A. Kimel, and A. Kirilyuk, Ultrafast phononic switching of magnetization, Nat. Phys. 17, 489 (2021).
- Nova et al. (2017) T. F. Nova, A. Cartella, A. Cantaluppi, M. Först, D. Bossini, R. V. Mikhaylovskiy, A. V. Kimel, R. Merlin, and A. Cavalleri, An effective magnetic field from optically driven phonons, Nat. Phys. 13, 132 (2017).
- Rini et al. (2007) M. Rini, R. Tobey, N. Dean, J. Itatani, Y. Tomioka, Y. Tokura, R. W. Schoenlein, and A. Cavalleri, Control of the electronic phase of a manganite by mode-selective vibrational excitation, Nature 449, 72 (2007).
- Caviglia et al. (2012) A. D. Caviglia, R. Scherwitzl, P. Popovich, W. Hu, H. Bromberger, R. Singla, M. Mitrano, M. C. Hoffmann, S. Kaiser, P. Zubko, S. Gariglio, J.-M. Triscone, M. Först, and A. Cavalleri, Ultrafast strain engineering in complex oxide heterostructures, Phys. Rev. Lett. 108, 136801 (2012).
- Horstmann et al. (2020) J. G. Horstmann, H. Böckmann, B. Wit, F. Kurtz, G. Storeck, and C. Ropers, Coherent control of a surface structural phase transition, Nature 583, 232 (2020).
- Song et al. (2023) B. Song, X. Yang, C. Sundahl, J.-H. Kang, M. Mootz, Y. Yao, I. Perakis, L. Luo, C. Eom, and J. Wang, Ultrafast martensitic phase transition driven by intense terahertz pulses, Ultrafast Sci. 3, 0007 (2023).
- Kaiser et al. (2014) S. Kaiser, C. R. Hunt, D. Nicoletti, W. Hu, I. Gierz, H. Liu, M. Le Tacon, T. Loew, D. Haug, B. Keimer, et al., Optically induced coherent transport far above t c in underdoped yba 2 cu 3 o 6+ , Phys. Rev. B 89, 184516 (2014).
- Hu et al. (2014) W. Hu, S. Kaiser, D. Nicoletti, C. R. Hunt, I. Gierz, M. C. Hoffmann, M. Le Tacon, T. Loew, B. Keimer, and A. Cavalleri, Optically enhanced coherent transport in yba 2 cu 3 o 6.5 by ultrafast redistribution of interlayer coupling, Nat. Mater. 13, 705 (2014).
- Mankowsky et al. (2014) R. Mankowsky, A. Subedi, M. Forst, S. O. Mariager, M. Chollet, H. T. Lemke, J. S. Robinson, J. M. Glownia, M. P. Minitti, A. Frano, M. Fechner, N. A. Spaldin, T. Loew, B. Keimer, A. Georges, and A. Cavalleri, Nonlinear lattice dynamics as a basis for enhanced superconductivity in YBa2Cu3O6.5, Nature 516, 71 (2014).
- Mitrano et al. (2016) M. Mitrano, A. Cantaluppi, D. Nicoletti, S. Kaiser, A. Perucchi, S. Lupi, P. Di Pietro, D. Pontiroli, M. Riccò, S. R. Clark, et al., Possible light-induced superconductivity in k3c60 at high temperature, Nature 530, 461 (2016).
- Garate (2013) I. Garate, Phonon-induced topological transitions and crossovers in dirac materials, Phys. Rev. Lett. 110, 046402 (2013).
- Saha and Garate (2014) K. Saha and I. Garate, Phonon-induced topological insulation, Phys. Rev. B 89, 205103 (2014).
- Kim and Jhi (2015) J. Kim and S.-H. Jhi, Topological phase transitions in group iv-vi semiconductors by phonons, Phys. Rev. B 92, 125142 (2015).
- Wang et al. (2017) L.-L. Wang, N. H. Jo, Y. Wu, Q. Wu, A. Kaminski, P. C. Canfield, and D. D. Johnson, Phonon-induced topological transition to a type-II Weyl semimetal, Phys. Rev. B 95, 165114 (2017).
- Weber et al. (2018) C. P. Weber, M. G. Masten, T. C. Ogloza, B. S. Berggren, M. K. L. Man, K. M. Dani, J. Liu, Z. Mao, D. D. Klug, A. A. Adeleke, and Y. Yao, Using coherent phonons for ultrafast control of the dirac node of , Phys. Rev. B 98, 155115 (2018).
- Sie et al. (2019) E. J. Sie, C. M. Nyby, C. Pemmaraju, S. J. Park, X. Shen, J. Yang, M. C. Hoffmann, B. Ofori-Okai, R. Li, A. H. Reid, et al., An ultrafast symmetry switch in a weyl semimetal, Nature 565, 61 (2019).
- Vaswani et al. (2020) C. Vaswani, L.-L. Wang, D. H. Mudiyanselage, Q. Li, P. M. Lozano, G. D. Gu, D. Cheng, B. Song, L. Luo, R. H. J. Kim, C. Huang, Z. Liu, M. Mootz, I. E. Perakis, Y. Yao, K. M. Ho, and J. Wang, Light-driven Raman coherence as a nonthermal route to ultrafast topology switching in a dirac semimetal, Phys. Rev. X 10, 021013 (2020).
- Luo et al. (2021) L. Luo, D. Cheng, B. Song, L.-L. Wang, C. Vaswani, P. Lozano, G. Gu, C. Huang, R. H. Kim, Z. Liu, et al., A light-induced phononic symmetry switch and giant dissipationless topological photocurrent in ZrTe5, Nat. Mater. 20, 329 (2021).
- Wang (2021) L.-L. Wang, Expansive open fermi arcs and connectivity changes induced by infrared phonons in , Phys. Rev. B 103, 075105 (2021).
- Yang et al. (2020) X. Yang, L. Luo, C. Vaswani, X. Zhao, Y. Yao, D. Cheng, Z. Liu, R. H. Kim, X. Liu, M. Dobrowolska-Furdyna, et al., Light control of surface–bulk coupling by terahertz vibrational coherence in a topological insulator, npj Quantum Mater. 5, 13 (2020).
- Yang et al. (2018) X. Yang, C. Vaswani, C. Sundahl, M. Mootz, P. Gagel, L. Luo, J. Kang, P. Orth, I. Perakis, C. Eom, et al., Terahertz-light quantum tuning of a metastable emergent phase hidden by superconductivity, Nat. Mater. 17, 586 (2018).
- Prezhdo (2021) O. V. Prezhdo, Modeling non-adiabatic dynamics in nanoscale and condensed matter systems, Acc. Chem. Res. 54, 4239 (2021).
- Lindh and González (2020) R. Lindh and L. González, Quantum Chemistry and Dynamics of Excited States: Methods and Applications (John Wiley & Sons, 2020).
- Nelson et al. (2020) T. R. Nelson, A. J. White, J. A. Bjorgaard, A. E. Sifain, Y. Zhang, B. Nebgen, S. Fernandez-Alberti, D. Mozyrsky, A. E. Roitberg, and S. Tretiak, Non-adiabatic excited-state molecular dynamics: Theory and applications for modeling photophysics in extended molecular materials, Chem. Rev. 120, 2215 (2020).
- Curchod and Martínez (2018) B. F. Curchod and T. J. Martínez, Ab initio nonadiabatic quantum molecular dynamics, Chem. Rev. 118, 3305 (2018).
- Caruso and Zacharias (2023) F. Caruso and M. Zacharias, Quantum theory of light-driven coherent lattice dynamics, Phys. Rev. B 107, 054102 (2023).
- Subedi et al. (2014) A. Subedi, A. Cavalleri, and A. Georges, Theory of nonlinear phononics for coherent light control of solids, Phys. Rev. B 89, 220301 (2014).
- Gu and Rondinelli (2018) M. Gu and J. M. Rondinelli, Nonlinear phononic control and emergent magnetism in mott insulating titanates, Phys. Rev. B 98, 024102 (2018).
- Raines et al. (2015) Z. M. Raines, V. Stanev, and V. M. Galitski, Enhancement of superconductivity via periodic modulation in a three-dimensional model of cuprates, Phys. Rev. B 91, 184506 (2015).
- Komnik and Thorwart (2016) A. Komnik and M. Thorwart, BCS theory of driven superconductivity, Eur. Phys. J. B 89, 244 (2016).
- Knap et al. (2016) M. Knap, M. Babadi, G. Refael, I. Martin, and E. Demler, Dynamical Cooper pairing in nonequilibrium electron-phonon systems, Phys. Rev. B 94, 214504 (2016).
- Patel and Eberlein (2016) A. A. Patel and A. Eberlein, Light-induced enhancement of superconductivity via melting of competing bond-density wave order in underdoped cuprates, Phys. Rev. B 93, 195139 (2016).
- Kennes et al. (2017) D. M. Kennes, E. Y. Wilner, D. R. Reichman, and A. J. Millis, Transient superconductivity from electronic squeezing of optically pumped phonons, Nat. Phys. 13, 479 (2017).
- Babadi et al. (2017) M. Babadi, M. Knap, I. Martin, G. Refael, and E. Demler, Theory of parametrically amplified electron-phonon superconductivity, Phys. Rev. B 96, 014512 (2017).
- Mazza and Georges (2017) G. Mazza and A. Georges, Nonequilibrium superconductivity in driven alkali-doped fullerides, Phys. Rev. B 96, 064515 (2017).
- Murakami et al. (2017) Y. Murakami, N. Tsuji, M. Eckstein, and P. Werner, Nonequilibrium steady states and transient dynamics of conventional superconductors under phonon driving, Phys. Rev. B 96, 045125 (2017).
- Sentef (2017) M. A. Sentef, Light-enhanced electron-phonon coupling from nonlinear electron-phonon coupling, Phys. Rev. B 95, 205111 (2017).
- Schütt et al. (2018) M. Schütt, P. P. Orth, A. Levchenko, and R. M. Fernandes, Controlling competing orders via nonequilibrium acoustic phonons: Emergence of anisotropic effective electronic temperature, Phys. Rev. B 97, 035135 (2018).
- Luo et al. (2023) L. Luo, M. Mootz, J.-H. Kang, C. Huang, K. Eom, J. Lee, C. Vaswani, Y. Collantes, E. Hellstrom, I. E. Perakis, et al., Quantum coherence tomography of light-controlled superconductivity, Nat. Phys. 19, 201 (2023).
- Kim et al. (2021a) R. H. Kim, C. Huang, Y. Luan, L.-L. Wang, Z. Liu, J.-M. Park, L. Luo, P. M. Lozano, G. Gu, D. Turan, et al., Terahertz nano-imaging of electronic strip heterogeneity in a dirac semimetal, ACS photonics 8, 1873 (2021a).
- Liu et al. (2020a) Z. Liu, C. Vaswani, X. Yang, X. Zhao, Y. Yao, Z. Song, D. Cheng, Y. Shi, L. Luo, D.-H. Mudiyanselage, et al., Ultrafast control of excitonic rashba fine structure by phonon coherence in the metal halide perovskite ch 3 nh 3 pbi 3, Phys. Rev. Lett. 124, 157401 (2020a).
- Liu et al. (2020b) Z. Liu, C. Vaswani, L. Luo, D. Cheng, X. Yang, X. Zhao, Y. Yao, Z. Song, R. Brenes, R. J. H. Kim, J. Jean, V. Bulović, Y. Yan, K.-M. Ho, and J. Wang, Coherent band-edge oscillations and dynamic longitudinal-optical phonon mode splitting as evidence for polarons in perovskites, Phys. Rev. B 101, 115125 (2020b).
- Landau (1932) L. D. Landau, Zur Theorie der Energieübertragung. II, Phys. Z. Sowjetunion 2, 46 (1932).
- Zener (1932) C. Zener, Non-adiabatic Crossing of Energy Levels, Proc. R. Soc. London, Ser. A 137, 696 (1932).
- Stückelberg (1932) E. C. G. Stückelberg, Theorie der unelastischen Stösse zwischen Atomen, Helv. Phys. Acta 5, 369 (1932).
- Majorana (1932) E. Majorana, Atomi orientati in campo magnetico variabile, Nuovo Cim. 9, 43 (1932).
- Shevchenko et al. (2010) S. N. Shevchenko, S. Ashhab, and F. Nori, Landau–Zener–Stückelberg interferometry, Phys. Rep. 492, 1 (2010).
- Ivakhnenko et al. (2023) V. Ivakhnenko, S. N. Shevchenko, and F. Nori, Nonadiabatic Landau–Zener–Stückelberg–Majorana transitions, dynamics, and interference, Phys. Rep. 995, 1 (2023).
- (57) A. Akhmerov, J. Sau, B. van Heck, S. Rubbert, R. Skolasiński, B. Nijholt, I. Muhammad, and T. örn Rosdahl, Topology in Condensed Matter: Tying Quantum Knots, https://topocondmat.org/ .
- Aryal et al. (2021) N. Aryal, X. Jin, Q. Li, A. M. Tsvelik, and W. Yin, Topological phase transition and phonon-space dirac topology surfaces in , Phys. Rev. Lett. 126, 016401 (2021).
- Holstein (1959) T. Holstein, Studies of polaron motion: Part i. the molecular-crystal model, Ann. Phys. 8, 325 (1959).
- Trotter (1959) H. F. Trotter, On the product of semi-groups of operators, Proc. Am. Math. Soc. 10, 545 (1959).
- Nielsen and Chuang (2011) M. A. Nielsen and I. L. Chuang, Quantum Computation and Quantum Information: 10th Anniversary Edition, 10th ed. (Cambridge University Press, New York, USA, 2011).
- Marzari et al. (2012) N. Marzari, A. A. Mostofi, J. R. Yates, I. Souza, and D. Vanderbilt, Maximally localized wannier functions: Theory and applications, Rev. Mod. Phys. 84, 1419 (2012).
- Chan et al. (2007) T.-L. Chan, Y. Yao, C. Wang, W. Lu, J. Li, X. Qian, S. Yip, and K. Ho, Highly localized quasiatomic minimal basis orbitals for mo from ab initio calculations, Phys. Rev. B 76, 205119 (2007).
- Qian et al. (2008) X. Qian, J. Li, L. Qi, C.-Z. Wang, T.-L. Chan, Y.-X. Yao, K.-M. Ho, and S. Yip, Quasiatomic orbitals for ab initio tight-binding analysis, Phys. Rev. B 78, 245112 (2008).
- Granucci et al. (2012) G. Granucci, M. Persico, and G. Spighi, Surface hopping trajectory simulations with spin-orbit and dynamical couplings, J. Chem. Phys. 137, 22A501 (2012).
- Li et al. (2018) W. Li, L. Zhou, O. V. Prezhdo, and A. V. Akimov, Spin–orbit interactions greatly accelerate nonradiative dynamics in lead halide perovskites, ACS Energy Lett. 3, 2159 (2018).
- Hammes-Schiffer and Tully (1994) S. Hammes-Schiffer and J. C. Tully, Proton transfer in solution: Molecular dynamics with quantum transitions, J. Chem. Phys. 101, 4657 (1994).
- Akimov and Prezhdo (2013) A. V. Akimov and O. V. Prezhdo, The pyxaid program for non-adiabatic molecular dynamics in condensed matter systems, J. Chem. Theory Comput. 9, 4959 (2013).
- Kim et al. (2021b) R. H. Kim, C. Huang, Y. Luan, L.-L. Wang, Z. Liu, J.-M. Park, L. Luo, P. M. Lozano, G. Gu, D. Turan, et al., Terahertz nano-imaging of electronic strip heterogeneity in a Dirac semimetal, ACS photonics 8, 1873 (2021b).
- Perdew et al. (1996) J. P. Perdew, K. Burke, and M. Ernzerhof, Generalized gradient approximation made simple, Phys. Rev. Lett. 77, 3865 (1996).
- Grimme (2006) S. Grimme, Semiempirical gga-type density functional constructed with a long-range dispersion correction, J. Comput. Chem. 27, 1787 (2006).
- Kresse and Furthmüller (1996) G. Kresse and J. Furthmüller, Efficient iterative schemes for ab initio total-energy calculations using a plane-wave basis set, Phys. Rev. B 54, 11169 (1996).
- Togo and Tanaka (2015) A. Togo and I. Tanaka, First principles phonon calculations in materials science, Scr. Mater. 108, 1 (2015).
- Matkovic and Matkovic (1992) T. Matkovic and P. Matkovic, Constitutional study of the titanium, zirconium and hafnium tellurides, Metalurgija (Zagreb) 31, 107 (1992).
- Jiang et al. (2023) T. Jiang, P. P. Orth, L. Luo, J. Wang, and Y.-X. Yao, Data set and scripts for the analysis and figures of quantum dynamics simulations of ZrTe5 system, https://doi.org/10.6084/m9.figshare.23786355 (2023).
- Yao (2023) Y.-X. Yao, CyQuanDyn: coherent phonon-driven quantum dynamics simulaiton toolkit, https://doi.org/10.6084/m9.figshare.23774946 (2023).
Acknowledgements
This work was supported by the U.S. Department of Energy (DOE), Office of Science, Basic Energy Sciences, Materials Science and Engineering Division, including the grant of computer time at the National Energy Research Scientific Computing Center (NERSC) in Berkeley, California. The research was performed at the Ames National Laboratory, which is operated for the U.S. DOE by Iowa State University under Contract No. DE-AC02-07CH11358.
Author contributions
T.J. performed the DFT and quantum dynamics simulations. Y.X.Y. and T.J. wrote the codes for dynamics simulation and analysis. P.P.O. initiated the effective model simulation and contributed to the analysis of the results. L.L. and J.W. performed the experimental analysis. L.L.W. and F.Z. helped with the DFT calculations and analysis. J.Z., C.Z.W., and K.M.H. provided inputs for the first-principle dynamics simulations. Y.X.Y., T.J., and P.P.O. wrote the paper, with contributions from all the authors. Y.X.Y. supervised the project.
Competing interests
The authors declare no competing interests.
Supplemental materials for:
Ab-initio Simulations of Coherent Phonon-Induced Pumping of Carriers in Zirconium Pentatelluride
I Alternative way for excited state population analysis
For the carrier density analysis of the time-dependent BdG model in the main text, we define the excited state population with respect to the adiabatic conduction band. Here we investigate an alternative definition of , which is defined with respect to the conduction band of the initial unperturbed Hamiltonian.
In Fig. S1 (a,b), we plot the time evolution of and at starting at for five full cycles. The major variation of occurs reasonably when the system approaches the minimum of the band gap , as shown in Fig. S1 (c). In contrast, the curve of shows strong oscillation even away from band gap minimum, which implies is not a physically reasonable definition in practice. Nevertheless, we observe that if one discards the fast oscillation, reaches a value of about , in a fairly good agreement with . This can be understood by checking the overlap between two reference conduction band wavefunctions , as plotted in Fig. S1 (d). agrees with at with where the perturbation in vanishes. deviates more from when the perturbation in increases, and the deviation grows more rapidly when the perturbation reduces the band gap.
II Significance of gauge and phase corrections for the ab initio quantum dynamics simulations

In the main text, we have discussed the and overlap gauge corrections and phase correction for the wavefunctions, which are crucial to produce physically reasonable quantum dynamics simulation results by fixing the artificial random jumps in the otherwise uncorrected time-dependent NAC amplitudes. For a specific example, we compare the simulation results with and without phase correction in Fig. S2 (a) and (c). The variation of the conduction band occupations are found to be suppressed by over one order of magnitude without applying the phase correction. This can be understood by examining the effect of phase correction on the complex NAC amplitudes, as contrasted in Fig. S2 (b, c, e, f). While the real and imaginary part of the time-dependent NAC amplitude is quite smooth with phase correction, they show artificial random jumps without the phase correction. Similar random jumps can be observed without gauge corrections.