On the hosts of neutron star mergers in the nearby Universe2020On the hosts of neutron star mergers in the nearby Universe–18
Abstract
Recently, the characterisation of binary systems of neutron stars has become central in various fields such as gravitational waves, gamma-ray bursts (GRBs), and the chemical evolution of galaxies. In this work, we explore possible observational proxies that can be used to infer some characteristics of the delay time distribution (DTD) of neutron star mergers (NSMs). We construct a sample of model galaxies that fulfils the observed galaxy stellar mass function, star formation rate versus mass relation, and the cosmic star formation rate density. The star formation history of galaxies is described with a log-normal function characterised by two parameters: the position of the maximum and the width of the distribution. We assume a theoretical DTD that mainly depends on the lower limit and the slope of the distribution of the separations of the binary neutron stars systems at birth. We find that the current rate of NSMs ( Gpc-3yr-1) requires that per cent of neutron star progenitors lives in binary systems with the right characteristics to lead to a NSM within a Hubble time. We explore the expected relations between the rate of NSMs and the properties of the host galaxy. We find that the most effective proxy for the shape of the DTD of NSMs is the current star formation activity of the typical host. At present, the fraction of short-GRBs observed in star-forming galaxies favours DTDs with at least of mergers within Myr. This conclusion will be put on a stronger basis with larger samples of short-GRBs with host association (e.g. events at ).
Keywords:
galaxies: evolution – stars: neutron – binaries: close – gamma-rays: galaxies1 Introduction
In the last decade, the coalescence of binary systems of neutron stars has gained a lot of interest in multiple fields such as multi-messenger astrophysics, nucleosynthesis studies, chemical evolution of galaxies, and high-energy astrophysics.
The first observation of a Neutron Star Merger (NSM) has been obtained with the gravitational wave event GW170817 (Abbott
et al. 2017a), which has been localised in a sky region of about 30 deg2. This observation has confirmed that these events are associated with a gravitation wave signal. After hours, several research groups (Abbott
et al. 2017a; Coulter
et al. 2017; Soares-Santos
et al. 2017; Valenti
et al. 2017) have independently detected the optical counterpart of GW170817, the kilonova AT2017gfo. In the following days, the light from the kilonova and afterglow emission have been observed and analyzed (Abbott
et al. 2017b; Villar
et al. 2017; Hajela
et al. 2019; Troja
et al. 2019, see). For many years ejecta of neutron star mergers (NSMs) have been indicated as a strong source of rapid neutron-capture (r-)process
elements (Symbalisty &
Schramm 1982; Freiburghaus et al. 1999; Rosswog et al. 2000; Oechslin
et al. 2007; Panov
et al. 2008; Perego
et al. 2014; Rosswog et al. 2014; Wanajo et al. 2014; Eichler
et al. 2015; Goriely et al. 2015; Lippuner
et al. 2017; Thielemann et al. 2017). In this regard, the evolution of the light curve of the kilonova of the GW170817 event suggests a significant production of r-process elements (Cowperthwaite
et al. 2017; Tanaka
et al. 2017; Villar
et al. 2017). This reinforces the theory that rapid neutron capture processes occur in this type of system.
In the following days, the gravitational waves (GW) emission from GW170817 has been correlated with a space and time coincident short gamma-ray burst (SGRB), GRB 170817A (Abbott
et al. 2017c; Goldstein
et al. 2017; Savchenko
et al. 2017). The detection of GRB170817A seconds after the GW event has reinforced the hypothesis that NSM (and in general compact binary mergers) are the progenitors of SGRBs (Eichler et al. 1989; Giacomazzo et al. 2013; Tanvir
et al. 2013; Berger 2014). In the following years, a second NSM event (GW190425) (Abbott
et al. 2020b) has been detected, as well as two neutron star-black hole mergers: GW190426 and GW190814 (Abbott
et al. 2021b). Unfortunately, for these three events, the observation of the electromagnetic counterparts has not been reported.
In the last two years, observations have continued with the third observing run (O3) but no new NSM event has been detected; as a consequence Abbott
et al. 2021a have updated the present-day cosmic rate of NSM to Gpc-3, yr-1, that is about of the one previously derived by Abbott
et al. 2020b, i.e. Gpc-3 yr-1.
As confirmed by the kilonova AT2017gfo, NSMs are producers of rapid neutron-capture elements. Their impact on the evolution of r-process elements has been investigated with chemical evolution models. In these studies, the production time scale of a certain element plays a key role. For r-process elements produced by NSMs, the production time-scale is linked to the delay time, i.e. the time between the birth of the primordial binary system and its final merging. For this reason, the chemical evolution of galaxies can provide information which put some constraints on the delay times of NSMs. An element such as europium (Eu) is often used as a good tracer of the r-process, mostly because it appears that of the solar Eu has been produced via rapid neutron capture processes (Howard et al. 1986; Bisterzo
et al. 2015). This conclusion follows from the insufficient contribution to Europium of the r-process in intermediate mass stars, as estimated on the basis of current stellar models. In the last years, a series of works have shown that the Eu enrichment should take place on short timescales (Matteucci et al. 2014; Cescutti et al. 2015; Ishimaru et al. 2015; Côté
et al. 2019; Cavallo et al. 2021). In particular,
it has been argued that NSMs can be the sole source of Eu in the Galaxy only if the gravitational delay of NSMs (i.e. the time between the formation of the binary neutron star system and their merging event) is short (up to Myr). On the other hand, if NSMs have relatively long gravitational delays, in order to explain both the spread and the average trend of [Eu/Fe] observed in our Galaxy, some additional site of Eu production with short timescales must be invoked, e.g. Core Collapse (CC) SNe.
The optical counterpart of GW170817 has allowed the identification of its host galaxy: NGC 4993. This galaxy is located at a distance of Mpc, in agreement with the distance of GW170817 ( Mpc) estimated by Abbott
et al. 2017a from the analysis of the GW signal. NGC4993 is an early-type galaxy that presents a low current star formation rate. Thus, in principle, the progenitor of GW170817 could be a young system. However, by analysing the local environment around the kilonova AT2017gfo Kilpatrick
et al. 2022 have not found clear evidence of recent star formation. This indicates that the progenitors of GW170817 more likely arise from an old stellar population, implying that at least some NSMs should have long delay times.
As highlighted above, the observation of GW170817 in a galaxy with a low current SFR supports long delay times for NSMs; on the other hand, chemical evolution models require NSMs with short delay times. The assumption of a delay time distribution (DTD) for NSMs satisfies both requests. This hypothesis is supported by the observations of SGRBs. As already mentioned, SGRBs are thought to be related to NSMs; thus, the census of SGRBs could provide an alternative way to constrain the properties of the DTD of NSMs. The analysis of observed SGRBs suggests that the DTD of SGRBs scales with the inverse of the delay time (Guetta &
Piran 2006; D’Avanzo
et al. 2014; Ghirlanda
et al. 2016, see).
In a simple approach, DTDs are often assumed as pure power-laws with a certain slope (i.e. ); typically . However, as pointed out by Simonetti et al. 2019 and Greggio et al. 2021, similar to the case of SNe Ia, the DTD should be characterised by an early wide peak, with a width equal to the difference between the evolutionary lifetimes of the least and most massive neutron star progenitors. Furthermore, the slope of the DTD at late epochs should be a function of the shape of the distribution of separations of the NS-NS systems at birth. The DTD of NSMs can also be computed numerically with binary population synthesis (BPS) models (Giacobbo &
Mapelli 2018; Belczynski
et al. 2020; Tang et al. 2020), which follow the evolution of individual systems up to the merging event. To do that, these models include many ingredients some of which are not well constrained, e.g. the initial-final mass relations, the efficiency of the common envelope (CE) phase, the initial distribution of mass ratios and separations, the SN kick and its effects on the binary system, and the possible dependence of these properties on the chemical composition. The resulting DTD is thus subject to some weaknesses while being at the same time a rigid prediction.
As an alternative, Greggio et al. 2021 proposed a DTD for NSMs expressed by a simple analytical formulation identifying some physical parameters which mostly control the shape of the DTD.
In particular, following the same method used in Greggio 2005 for the DTD of SNIa’s, they developed a parametrized DTD which depends on the distribution of three key parameters of the neutron star binaries at birth: their separations, the total mass of the system, and orbit eccentricity.
In this paper, we investigate possible observational facts that can be used to constrain the main characteristics of the DTD of NSMs. To do that, we build a sample of galaxies that complies with the major observational trends: i) the galaxy stellar mass function (GSMF) observed for nearby galaxies (see Peng
et al. 2010, hereafter 62); ii) the star formation rate density (SFRD) obtained by Madau &
Dickinson 2014; iii) the star-forming main sequence of galaxies as derived by Renzini &
Peng 2015. We assume that the SFH of these galaxies can be expressed as a log-normal function that depends on the epoch of the peak () and on the width of the function () (see Gladders et al. 2013, hereafter 39). To calculate the rate of NSMs in the Universe, besides the SFH of the galaxies, we need the DTD, for which we adopt the models developed by Greggio et al. 2021.
These ingredients allow us to compute models for the trend of NSM rate as a function of redshift; in order to derive the actual value of the rate we need to determine a scaling factor () which we calibrate by imposing that the models
reproduce the present rate of NSMs determined by Abbott
et al. 2021a ( Gpc-3 yr-1).
Based on our models, we then compute the fraction of NSMs hosted by star-forming galaxies classified on the basis of their specific SFR (sSFR) according to different criteria, and compare it with the fraction of SGRBs observed in star-forming galaxies derived by Nugent
et al. 2022.
The paper is organised as follows. In Section 2 we describe the sample of galaxies and the DTDs used in the computation. In Section 3 we present the redshift evolution of the NSMs rate and the calibration of . In Section 4 we present the demographic of observed SGRBs, and compare the data to some predictions of our model. We discuss our results in Section 5 and draw some conclusion in Section 6. In this work we assume a CDM model with km s-1 Mpc-1, , and .
2 Neutron star merger rate
The DTD function is the distribution of the delay times for a stellar population of unitary mass, formed by an instantaneous burst of star formation. The DTD is a crucial ingredient for the computation of NSM rates and the chemical evolution of elements released to the interstellar medium (ISM) by these events. Indeed, the NSM rate in a galaxy at a given time can be computed as:
| (1) |
where is the number of NS progenitors per unit mass in a single stellar generation, is the fraction of them with the right characteristics to lead to a NSM, is the star formation history (SFH, in ) of the galaxy, and is the DTD function (see, e.g., Simonetti et al. 2019). The parameter depends on the assumed initial mass function (IMF) and on the mass range of NS progenitors. It can be calculated as:
| (2) |
where and are the minimum and maximum mass of NS progenitors, respectively, and is the assumed IMF normalized to a unitary mass over the total stellar mass range. In this work we adopt: a Salpeter 1955 IMF, a total range for stellar masses from 0.1 to 120 , and NS progenitors ranging from 9 to 50 . With these assumptions we get . The upper limit to the mass of NS progenitors is chosen according to a constraint from chemical evolution models (Matteucci et al. 2014). With this formalism the parameter acts like a normalisation factor, and is
derived by imposing that the cosmic rate of NSM (see Eq. ( 1)) reproduces the present one as determined by Abbott
et al. 2021a ( Gpc-3 yr-1).
In general, and could be time dependent variables. For example, the IMF could depend on time and the evolution of binary systems could be influenced by the metallicity. For the sake of simplicity, in this work both will be assumed constant in time.
Rather than proceeding directly to the evaluation of by solving Eq. (1) with the inclusion of a function describing the cosmic SFH, as, e.g. in Simonetti et al. 2019, we proceed constructing a model for the galaxy population in the Universe which conforms to the major observational constraints. In this way, we are able to characterise the expected properties of the hosts of the NSM events.
2.1 The sample of galaxies
In this Section we describe our model for the galaxy sample which complies with the observed mass distribution (62), the observed relation between the Star Formation Rate and the mass of the parent galaxy (Renzini & Peng 2015), and the cosmic Star Formation rate density (Madau & Dickinson 2014). An essential ingredient to construct this sample is the description of the SFH in each galaxy. We choose to adopt the observationally motivated log-normal shape (39) characterized by two parameters: the logarithmic delay time () and the width of the log-normal function (). Here we present some arguments supporting this type of formulation, while more details can be found in 39. First, the evolution of the star formation rate density (SFRD) over the cosmic time shows a clear growth (at early times), a peak (around Gyr), and a fall at later epochs (Madau & Dickinson 2014, e.g.). This rise and fall pattern is hard to describe with SFH laws that include only a declining trend (such as models), so that a second parameter, that acts as the "starting time" of the model, should be included to reproduce the time evolution of SFRD. Second, the log-normal function depends on two parameters and so it provides good flexibility to fit the age distribution in real galaxies. Thus we describe the SFH in galaxies as characterised by a tuple [], and expressed as:
| (3) |
We obtained the masses, redshifts and tuples () of the G13 sample of galaxies from L. Abramson (private comm.). These are 2094 galaxies with , for which the parameters () were determined by fitting their Spectral Energy Distribution. In Fig. 1 we plot a selection of the SFH laws of galaxies contained in the sample of 39. A large variety of SFHs is represented, with some galaxies having basically only one short initial episode of star formation; others, with wider age distributions, and peaking at various cosmic times, up to very recent epochs.
Eq.(3) is normalized to 1 for ranging from 0 to infinity.
To obtain the value of the SFR in units of yr-1 we need to apply a conversion factor so that the mass of a galaxy at cosmic time is given by:
| (4) |
For each galaxy of the G13 sample we determined by applying Eq. (4) with the cosmic epoch related to the galaxy redshift through our adopted cosmological model.
The 39 sample includes galaxies with masses greater than , and lacks low mass galaxies, e.g. with masses () . Although the contribution to the cosmic SFRD from this low mass component is likely small, due to their low SFR, their number is much larger than the one of massive galaxies (62, see) and their total contribution to the NSM events may be important.
Furthermore, we point out that of SGRBs lack a coincident host galaxy (Berger 2014; O’Connor
et al. 2022, see). For example, O’Connor
et al. 2022 found that the of the SGRBs that they have analysed are host-less. One possible explanation for this is that, at least in a fraction of cases, the hosts are faint galaxies at high redshift.
In order to model the NSM events in the Universe we thus need to add the low-mass galaxies component to the 39 sample. To do that we consider the galaxy stellar mass function (GSMF) in 62 which was determined adopting a Chabrier IMF. Since, the masses of the 39 galaxies where determined using a Salpeter IMF we apply a correction factor of 1/0.65 to the 62 masses, to re-scale them to the Salpeter IMF. It turns out that the GSMF of the G13 sample is overpopulated in the range with respect to the one in 62. This tension has been noted also by Abramson
et al. 2016. Possibly, the 39 sample targets a relatively high-density region in the Universe, compared to the general field. A more detailed discussion on this topic is reported in Appendix A. Therefore, we adjust the high mass component in the 39 sample by lowering the number of galaxies by a factor of in all mass bins with , and match the modified mass distribution to the 62 GSMF at .
Concerning the functional form for the SFH in these low-mass galaxies we maintain the log-normal shape, fixing the tuples in such a way that the relation between the current SFR and the mass of the galaxy by
Renzini &
Peng 2015 is fulfilled. More in detail, we first perform a random extraction for a galaxy mass in the range following the distribution in Fig. 2. Then to each new synthetic galaxy we associate a current SFR given by:

| (5) |
where is the Star Forming Main Sequence (SFMS) of galaxies in Renzini & Peng 2015:
| (6) |
and (,) is a normal distribution with and is function of the stellar mass of the -th galaxy. The inclusion of this second term allows us to describe the width of the galaxies distribution around the mean locus of Eq. (6). Thus the tuple [] must satisfy the following conditions:
| (7) |
and
| (8) |
Note that we apply a factor of 0.7 to account for the mass return of the stellar populations for a Salpeter IMF. In general this factor mildly depends on the SFH and age (Greggio &
Renzini 2011, see).
Using Eqs from 5 to 8, for each synthetic galaxy we thus have the sSFR at z=0. This corresponds to a locus on the - plane (see 39 Fig. 2) because of the degeneracy between the two parameters. In other words, the same value of sSFR can be obtained with an array of (,) tuples. We extract randomly one of these tuples having pre-computed the sSFR on an uniform - grid. We checked that the stochasticity introduced by this random process has a negligible impact on our results.
The process is repeated until the sample contains the adequate number of galaxies to reproduce the GSMF by 62.
Proceeding in this way, we added 15850 galaxies with to the 2094 original ones of 39. In Fig. 2 we plot the GSMF of our final sample of 17944 galaxies. We notice that our mock catalogue still contains some excess of massive galaxies with respect to the P10 distribution, in spite of the 0.85 reduction of the original distribution in the Abramson sample. This is however the best compromise we found to match the two observational galaxy samples.
2.1.1 Properties of the new sample
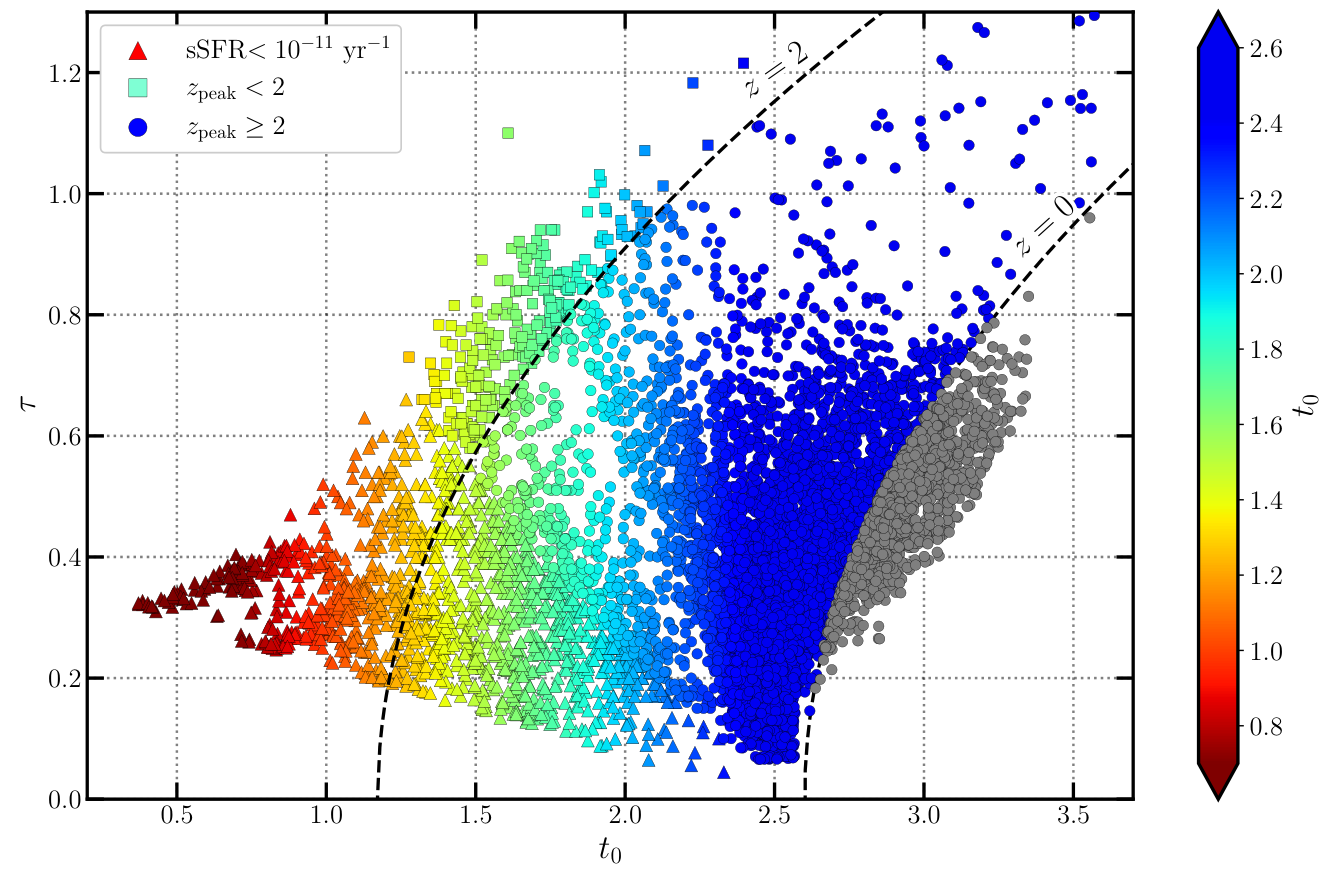
In Fig. 3 we plot the tuples of the galaxies
which compose our sample labelled as follows:
Color: encodes to the value of . This parameter characterises the time at which the SFR peaks. In Fig. 3 we see that in the vs plane galaxies of our sample are distributed in a triangular-like pattern. This means that, galaxies that peak at early times (), labelled in red, have SFHs with narrow peaks (small )
(see also Fig. 1). Some galaxies of our extended sample have a very late peak, at . They are plotted with grey dots.
Shape: galaxies are also divided into three different groups based on both the sSFR and the epoch at which the SFR peaks: i) galaxies with low sSFR at ( yr-1) are plotted with triangles. Galaxies with low sSFR are generally called quiescent; ii) early-peak galaxies () with high sSFR at ( yr-1) are plotted with squares; iii) galaxies with high sSFR that peaks at are plotted with circles.
As a consistency check, we plot in Fig. 4 the SFR as a function of the stellar mass at for the galaxies of our sample to which we superimpose the SFMS relation of Renzini &
Peng 2015.
In the low mass range the properties of our mock galaxies are fully consistent with the SFMS of Renzini &
Peng 2015 by construction.
However, our sample lacks galaxies with mass around and very low SFR ( yr-1) which are present in the Renzini &
Peng 2015 sample.
Since our mock sample fulfils the GSMF this galaxy population is present among the star-forming low-mass objects. Therefore, our models will overestimate the NSM events in low-mass galaxies at . The discrepancy however is small since the contribution of low-mass galaxy to the NSM overall statistics in negligible (see Section 4.1).
The sharp cut at in Fig. 4 is generated by the method used to build our sample, in that we assumed that all the new synthetic galaxies (with ) added to the 39 sample, follow the SFMS.
We acknowledge that the log-normal description of the SFR results in an extended distribution of objects with a sSFR yr-1 while Renzini &
Peng 2015 shows a clump of passive galaxies. On the one hand, this can be a limit of the functional form adopted to describe the SFH in our galaxies; on the other hand, the observational estimate of the sSFR could become inaccurate below a certain threshold (see discussion in 39). As a result on Fig. 4 the region of passive galaxies is poorly populated, compared to the one showed in Fig. 4 of Renzini &
Peng 2015. However, focusing on galaxies with , our mock catalogue contains , and objects respectively with sSFR yr-1, in sSFR yr-1 and lower than yr-1. These proportions are not dissimilar from those in Fig. 4 of Renzini &
Peng 2015.
The third constraint that our mock sample needs to satisfy is the evolution of the SFRD of Madau &
Dickinson 2014.
The evolution of the SFRD predicted by our sample of galaxies is
| (9) |
where is the volume that contains our galaxies. The volume sampled by a search over an area of deg2 spanning the redshift range from to is:
where , , and depend on the assumed cosmological model. The redshift range of the galaxies in the sample of 39 is from to while the survey area is deg2. Thus we obtain a cosmic volume of:
| (10) |
In Fig. 5 we compare the evolution of SFRD of Madau &
Dickinson 2014 (black) to that resulting from Eq. (9) when summing on the original 39 sample (red), and on the total galaxy sample developed in this work (blue). It appears that the original sample of 39 lacks star-forming galaxies in the local Universe (). However, with the addition of the low-mass (and star-forming) population of galaxies, our sample provides a very good agreement with the SFRD found by Madau &
Dickinson 2014. As discussed in Section 2.1, our sample presents a clear over-density with respect to the GSMF of 62. In spite of this, and in spite of the differences between the distribution of galaxies on the (SFR, Mass) plane in Renzini &
Peng 2015 and ours noticed above, the description of the cosmic SFH in our model is very good.
We conclude that our mock galaxy sample satisfies the major empirical relations: the GSMF of galaxies, the relation between the current SFR and galaxy mass, and the cosmic SFRD as a function of redshift.
2.2 The delay time distribution function
As previously mentioned the DTD function is the second crucial ingredient needed to calculate (see Eq. (1)). In this work, we use the DTDs of NSM developed by Greggio et al. 2021. For a NSM, the time between the formation of the binary system of stars and the merging event is equal to the time it takes to the secondary component to evolve into a neutron star (hereafter referred to as nuclear timescale), plus the time in which the two neutron stars are brought into contact due to the emission of gravitational waves (hereafter referred to as gravitational delay). The nuclear timescale () is a function of the initial mass of the star and its chemical composition. Neglecting the dependence on the chemical composition Greggio et al. 2021 adopted the following relation:
| (11) |
where and are in units of and yr, respectively.
The gravitational delay can be expressed by the following approximate relation (see Greggio et al. 2021):
| (12) |
where , , and are respectively the separation, the total mass (both expressed in solar units), and the eccentricity of the binary neutron star system at birth.
Assuming that these three parameters follow power law distributions characterized respectively by the exponents , and , Greggio et al. 2021 computed the distribution of the gravitational delays via Monte-Carlo realizations. It is worth noticing that these simulations include a correlation between the eccentricity of the binary system when the second neutron star is born and the separation , mimicking the effect of the Supernova kick as suggested in the models by Andrews &
Zezas 2019. The distribution of the gravitational delays convolved with the distribution of nuclear delays, resulted in parametrized DTDs.
The assumption of a power law distributions for the parameters and is hinted by the results of Binary Population Synthesis computations (see Greggio et al. 2021 for details).
In addition to the slope of the power-law distribution of the separations, the DTD also depends on the minimum separation assumed. Greggio et al. 2021 explored the possibility that the minimum separation can assume the following values: . Although very low values of are not found in numerical realisations of BPS, it is nonetheless worth examining these possibilities, since they provide a large number of events with short gravitational delays and this parameter may prove important for the merging rate in star-forming galaxies.
The general shape of these DTDs is as follows. The minimum delay time of all DTDs is Myr, that is the nuclear evolutionary lifetime of the most massive neutron star progenitor. At short delay times, DTDs are characterised by a wide peak ranging from Myr to Myr,
the latter being the nuclear evolutionary timescale of the least massive NS progenitor.
At delay times longer than 100 Myr, these DTDs can be well described by a power-law with a slope .
In the following we will tag as prompt those events with a delay time shorter than Myr and delayed those with longer delay times.
In Fig. 6 we plot the differential (top) and cumulative (bottom) distributions of the total delay times of NSMs, for different separation ranges (drawn with different colours), values of (from the left to the right panels), and tuples of [] (plotted with different line-styles).
The values adopted for these parameters are meant to bracket a wide range of possibilities, i.e. a distribution of the binary masses skewed at the lower mass end () or flat (), as well as a variety of shapes for the distribution of the eccentricities.
Looking at the cumulative distributions (bottom panels of Fig. 6), it is possible to appreciate the dependence of the DTDs from the parameter. In particular, models with smaller values of predict, on average, DTDs which are more populated at the short delay times. At fixed , models with wider separations (i.e. R⊙) are more populated at long delay times.
This second trend is driven by the relatively large value of Amin and we remark that the dependence on the maximum separation is very mild (Greggio et al. 2021, see). There is some dependence of the DTD on the distributions of the binary neutron star total masses and on the eccentricities, as shown by the broken lines. However, it appears that the DTD is mostly sensitive to variations of the parameters and .
In the bottom panels of Fig 6 we label the curves with different by the fraction of systems that merge within 32 Myr since the episode of star formation, or the fraction of prompt events.
At fixed , models that assume closer systems (i.e. smaller ) show larger fractions of prompt events. A similar trend is obtained at fixed , when a steeper distribution of the separations is assumed (i.e. lower ).
We notice that similar fractions of prompt events can be obtained with different combinations (e.g. ; and ; ), and that a very high fraction of prompt events () can be obtained for and .
The dependence of the DTD on the and parameters is enhanced as the value of increases. This is well visible in Fig. 6 looking at the purple lines (Amin = 1 ). In particular, the DTDs show a strong dependence on the assumed distribution of the orbit eccentricities. For example, for = 1 and , the fraction of prompt events varies from to when changes from to , i.e. increasing the fraction of systems with high eccentricities (see right bottom panel of Fig. 6.
The difference between the fractions of prompt and delayed events has a great impact on the chemical enrichment caused by the NSM systems. As mentioned before, chemical evolution models suggest that the enrichment of r-process elements11
1
elements mostly produced by the r-process channel (such as Eu) should occur on short delay times. This can be accomplished either with a steep distribution of the separations and small , if Eu is produced only by NSMs, or with flatter DTDs for the NSM, if some contribution to Eu comes from massive stars.
3 Redshift distribution of neutron star mergers
In this section, we present the redshift distribution of cosmic NSM rates predicted by different DTD models useful for the calibration of . For each model, the parameter is determined by imposing that the present rate of NSM predicted by our models is equal to the one derived by Abbott
et al. 2021a (i.e. Gpc-3 yr-1).
In addition we compare an observationally constrained SGRB redshift distribution with the one computed with Eq. (1). As previously introduced, NSMs are thought to be the progenitors of SGRB and so these two astrophysical events should present similar redshift distributions. For this comparison, we use the redshift distribution of SGRBs derived by Ghirlanda
et al. 2016. These authors performed a Monte Carlo simulation for a population of SGRBs described by a given luminosity function and a redshift distribution parametrized as follows:
| (13) |
The parameters of the redshift distribution are then derived by fitting the properties of the synthetic population to a set of observational constraints derived from Fermi and Swift observations of SGRBs (Ghirlanda
et al. 2016, for more details see). With these procedure the authors propose two sets of parameters which provide equally good fits to the observations: , , ("model a"), or , , ("model c").
Fig. 7 shows our models for the redshift evolution of the cosmic rate of NSMs computed with different assumptions on the DTD. The shaded areas show the range spanned by the rate for all the [] combinations of the specific choice of the [] tuple.
In the panels we also plot the curves of "model a" (red dashed line) and "model c" (purple dashed line) of Ghirlanda
et al. 2016. At , the red shaded area indicates the current rate of NSM evaluated by Abbott
et al. 2021a with its uncertainty. The black solid line shows the trend of the redshift evolution of the cosmic SFR of our mock sample, scaled to the local NSM merger rate.
From Fig. 7 we can note some features of connected to the characteristics of the assumed DTD model:
- –
models with smaller and/or steeper DTDs (i.e. lower values of ) predict a faster drop of the rate of NSM between the peak (around ) and compared to models with higher proportion of late events. It follows that models with a larger fraction of prompt events predict a stronger evolution of the NSM rate with redshift.
- –
models for the redshift distributions characterized by small and/or lower values of evolve closer to the cosmic SFRD. This follows from the high fraction of prompt events characterizing these models.
- –
the dependence of the rate on the distribution of total mass and eccentricity of the neutron star binaries is generally small, but becomes more important for the cases with larger fraction of late events. This is shown by the width of the shaded areas in Fig. 7.
- –
the best fitting redshfit distribution of SGRBs by Ghirlanda et al. 2016 are relatively flat, indicating between and , in combination with between and . We regard the discrepancy at as an unimportant issue, since the Ghirlanda et al. 2016 relations are poorly constrained at high redshift.
3.1 Uncertainties on the scaling factor
As previously mentioned, we determine the factor by imposing that the theoretical curves in Fig. 7 reproduce the present rate of NSM of Abbott
et al. 2021a. In our adopted approach, this factor is the fraction of massive stars that have the right characteristics to eventually lead to a NSM event within a Hubble time. Mathematically acts like a scaling factor of the rate of NSMs (see Eq. (1)). The present-day rate of NSM presented by Abbott
et al. 2021a has been estimated from the two NSM events detected so far observed (i.e. GW170817 and GW190425), so it presents a large uncertainty. As a consequence, also the estimated value of present uncertainties that arise directly from the ones of the observational rate. Abbott
et al. 2021a report a most probable value of the rate and its confidence levels of Gpc-3 yr-1. Correspondingly we report the most probable value of and its confidence interval by imposing that our models reproduce the estimates by Abbott
et al. 2021a. Fig. 8 shows our determinations of for all the DTDs used in this work. Assuming Gpc-3 yr-1 we find that .
From Fig. 8 we can note some correlations between the estimates of (and the uncertainties) and the assumed DTD model. Models with higher and/or flatter DTDs predict the lower values of . This follows from the fact that, at given SFH, flatter DTDs produce more delayed events, so that at zero redshift the resulting cosmic NSM rate is larger than in the case of steeper DTDs.
4 Gamma Ray Bursts and host galaxies
GRBs are traditionally divided in two classes according to the duration of the burst: the short and the long GRBs that last respectively less or more than two seconds. Long GRBs are thought to be related to the death of massive stars for several observational reasons: (i) their association to Type Ic core-collapse SNe (Galama
et al. 1998; Hjorth
et al. 2003; Stanek
et al. 2003; Woosley &
Bloom 2006); (ii) the fact that long GRBs are hosted only by star forming galaxies (Bloom et al. 1998; Djorgovski
et al. 1998; Christensen et al. 2004; Wainwright et al. 2007), and (iii) their spatial coincidence with star forming regions (Bloom
et al. 2002; Fruchter
et al. 2006). These observational facts strongly support the notion that long GRBs are produced at the death of massive stars (Roy 2021, see).
On the other hand, based on their short duration, the progenitors of SGRBs are thought to be systems characterised by short dynamical timescales (e.g. merging of compact objects) (Ciolfi 2018, see).
The association of GRBs with their host galaxies can provide more insights on their progenitors.
Indeed, different from the case of long GRBs, SGRBs occur also in galaxies with low (if any) current SF. This is further evidence in favour of a different nature of the progenitors of short and long GRBs.
The presence of SGRBs in both star-forming and passive galaxies indicates that their progenitors are characterised by a wide range of delay times, similar to Supernovae of Type Ia. Because of this property, we expect a correlation between the rate of SGRBs and the average age of the parent stellar population sensitive to the shape of the DTD of NSM.
A steep DTD, with a large fraction of prompt events, will predict more events in galaxies with vigorous star formation compared to those occurring in passive ones. Similar to the case of Type Ia Supernovae, the rate of NSMs per unit mass of the parent galaxy will then decrease going from star-forming to passive galaxies with a gradient which depends on the actual shape of the DTD.
Early studies on the hosts of few observed SGRBs had concluded that the population of hosts is dominated by passive galaxies and so, the progenitors of SGRBs were thought to be objects with long delay times (Prochaska
et al. 2006; Nakar 2007; Gal-Yam
et al. 2008, see). More recent studies, based on a larger sample of SGRBs, have concluded that only of the population of host galaxies are passive while the majority of events occur in star-forming galaxies (Leibler &
Berger 2010; Fong
et al. 2013; Berger 2014).
Further information regarding the SGRBs progenitors comes from the recent realisation that events classified as long GRB may be connected to NSMs. The long GRB 211211A has been followed by a kilonova emission with a similar luminosity, duration, and colour of AT 2017gfo, the event associated with GW 170817, suggesting that NSMs could be the progenitors of a sub-population of long GRBs (Rastinejad
et al. 2022). This hypothesis has been reinforced by the detection of the peculiar GRB 060614 (Gehrels
et al. 2006).
Because of its duration of s, the event can be classified as a long GRB; however, its temporal lag and peak luminosity are typical of the short GRBs group. The measured duration of a GRB depends on its luminosity: a long GRB could remain above the detection threshold for a short time if it was intrinsically less energetic and/or located at a larger distance. This calls into question the classification of events into long and short, which should take into account the possible dispersion of intrinsic luminosities and distances of the GRBs. In other words, GRB 060614 can be seen as a long GRB that could have been regrouped among the SGRBs if it were less energetic or observed at a larger distance (Zhang
et al. 2007, see). Furthermore, Yang
et al. 2022 have reported a significant excess in the optical and in the near-infrared emission of GRB 060614. This can be explained as a kilonova emission. There are then indications that some long GRBs lacking of supernova association, could originate from a NSM.
Recently, Fong
et al. 2022 have presented a census of the 90 SGRBs observed from 2005 to 2021 that have an association with a host galaxy. In their sample they have included all the short GRBs discovered by the Swift Observatory (Gehrels
et al. 2004) that have: i) a duration shorter than s; ii) events with a coincident afterglow within a radius. Their sample also includes the two peculiar long GRBs just discussed (GBR 211211A and GRB 060614) and a third one, GRB 160303A (Ukwatta
et al. 2016), a peculiar long GRB with a s peak followed by a tail to s, albeit with a low signal to noise.
Nugent
et al. 2022 analysed the sample presented by Fong
et al. 2022. In particular, they used spectroscopy and optical and near-infrared photometry to characterise the stellar population properties of the host galaxies of SGRBs. They found that of the population of hosts are star-forming galaxies, are transitioning galaxies, and are quiescent galaxies.
In this section, we compare the fraction of NSMs in galaxies of different types predicted by our model of Universe to the indications from the observations. First, we need to specify a criterion to classify galaxies of different types. To do that we consider the sSFR with two values for the threshold to be classified as star-forming (i.e. and ), and the criterion proposed by Tacchella
et al. 2022, and adopted by Nugent
et al. 2022 to construct their statistics. This criterion considers the quantity
| (14) |
where is the age of the Universe at the redshift , and a galaxy is classified as star-forming if . The quantity is the number of times the stellar mass doubles within the age of the universe at redshift assuming a constant sSFR over the time . Tacchella
et al. 2022 divide galaxies into three categories, based on the value of : star-forming if , transitioning if , and quiescent if . On the other hand, the classification criteria based on the sSFR divide galaxies into two categories: star-forming (if the sSFR is above the threshold) and passive (in the other case). To ease the comparison between results obtained with different classification criteria we merge the transitioning and quiescent classes of Tacchella
et al. 2022 into the passive category (i.e. those with .
It is important to emphasize that different criteria used to separate star-forming (SF) from passive galaxies correspond to different partitions of the population of evolving galaxies in the Universe. Fig. 9 shows the evolution with redshift of the fraction of galaxies classified as SF (and its complement) when these three different criteria are adopted. When requiring a higher sSFR threshold to classify a galaxy as SF, less objects satisfy the criterion. The difference of the fraction of SF galaxies becomes larger and larger as the redshift decreases, and more and more galaxies exit the range of high sSFR needed to be classified as SF. The criterion adopted by Tacchella
et al. 2022 produces an evolution of the fraction of star-forming galaxies close to what obtained with the sSFR criterion. For each of the three different criteria, we compute the fraction of NSMs hosted by SF galaxies () as:
| (15) |
where is the rate of NSMs in SF galaxies at redshift and is the rate of NSMs from all the galaxies in our sample (SF + passive).
4.1 Our theoretical demographics
From Fig. 10 to Fig. 12 the rate is plotted for different ’s and ’s but no more dependence on and . We decide to restrict the discussion to the [,][0,0] cases since the dependence on these parameters appears to be a second-order effect. In Fig. 10 we plot the fractions of NSMs in SF galaxies at predicted by different DTDs. The choice of the redshift value is motivated by that of the average redshift of the Nugent
et al. 2022 sample. Fig. 10 clearly shows that DTDs characterized by a larger fraction of prompt events (i.e. steeper and/or smaller ) produce a higher fraction of events in SF galaxies. The trend is the same for the three classification criteria. On the other hand, the value of this fraction is very sensitive to the adopted criterion. Indeed, the less demanding threshold for a galaxy to be classified as star-forming (i.e. sSFR ) implies that a larger number of galaxies are classified as such, so that the fraction increases (see also Fig. 9).
These theoretical fractions can be compared to the corresponding value determined by Nugent
et al. 2022 of 0.85. We notice that when adopting the more demanding criterion for the classification of galaxies as SF, a steep DTD is required to account for such a large value of events in the relatively few star-forming galaxies. On the opposite side, when choosing the threshold of sSFR , most galaxies fall in the SF category, and so the fraction is very large irrespective of the DTDs. In our mock Universe, the criterion adopted by Tacchella
et al. 2022 yields constraints on the DTD, in that the observed fraction of SGRBs in SF galaxies can be met either with a relatively flat and a small or with a steep and a larger value of .
Looking at Fig. 10 it appears that the large fraction of SGRBs observed in SF galaxies, points towards DTDs with a substantial fraction of prompt events.
In Fig. 11 we plot the redshift evolution of the rates of NSMs in both passive and SF galaxies, for different DTDs and different methods of galaxies classification. The left column shows the model prediction in the case in which SF galaxies are those with sSFR yr-1. In general, the rate in SF galaxies dominates the total NSM rate at high redshift, up to the local Universe, where the flatter DTDs (higher and/or higher correspond to similar contributions to the total rate of the two galaxy types.
For A, at redshift lower than the majority of events should occur in galaxies with sSFR < irrespective of .
The right column in Fig. 11 shows the results for the lowest sSFR threshold. With this cut, more galaxies are classified as SF, compared to the previous cases, and so the contribution of passive galaxies to the total rate of NSMs is extremely low, irrespective of the DTD.
The central column shows the predictions when adopting the Tacchella
et al. 2022 criterion for galaxies classification. Also in this case the rate in SF galaxies dominates at all redshifts, except for the flattest DTDs, which produce a similar contribution to the events in the two galaxy kinds at very low redshift.
Fig. 11 shows that the redshift evolution of the NSMs hosts properties has the potential to discriminate among the various choices for the DTD parameters. However, the operational criterion used to classify galaxies as SF or passive is critical, and has a great effect on the fraction of NSM hosted by galaxies of different types.
In Fig. 12 we plot the redshift evolution of the fraction of NSMs hosted by SF galaxies for different DTDs, which can be compared to an observational counterpart derived from the data in Nugent
et al. 2022 (black circles).
The observed fractions are affected by a large uncertainty (that covers the entire area of the plots in Fig. 12) due to the shot noise caused by the small number of SGRBs observed in various redshift bins (see Appendix B). As a consequence, all the models fall into the error intervals of SGRBs observations of Nugent
et al. 2022. So, with the current uncertainties of the observed redshift evolution of the fraction of SGRBs hosted by SF galaxies, no firm conclusion could be drawn. However, Fig. 11 shows that this kind of statistic has the potential to indicate the steepness of the DTD, especially in the nearby Universe. At redshifts larger than almost all events should instead occur in star-forming galaxies, which hampers the possibility of discriminating the DTD parameters.
In Appendix B we show that a 10 times larger sample of NSMs host galaxies observed at should be adequate to derive clues on the DTD parameters.
5 Discussion
5.1 Mass Distribution of the NSM hosts
As presented in Section 2.1, our synthetic sample of galaxies has been obtained by merging the high-mass ( ) galaxies of Abramson
et al. 2016 with low-mass ( ) ones generated by us. This low-mass extension of the Abramson
et al. 2016 sample has been made because even if the contribution to the cosmic SFRD from this low-mass objects is likely small, their number is much larger than that of massive galaxies and so their contribution to the NSM events may be important. Now, we estimate their contribution to the cosmic rate of NSMs.
We compute the fraction of NSMs hosted by galaxies with in our mock Universe as the ratio between the rate of NSM () in low-mass objects and the total one. This fraction depends on the DTD: when a steep DTD () is assumed the contribution of low-mass galaxies to the rate of NSMs is higher than in the case of flat DTDs (). This trend is caused by two combined factors: i) in our picture, at , galaxies with contribute to the total star formation of the local Universe; ii) steeper DTDs follow closely the SFR and so the contribution from galaxies of different masses to the rate of NSMs approaches their contribution to the star formation rate. In fact in our models with steep DTD (i.e. with ) of NSMs that explode at occur in low-mass galaxies. By contrast, in the case of a flat DTD (i.e. ) only of NSMs are hosted by galaxies with .
The fraction of NSMs in low-mass galaxies decreases when we move to higher redshifts. At , galaxies with ( contribute to the total rate of NSMs irrespective of the DTD. This value is even lower at where only the of NSMs occur in low-mass galaxies. However, their contribution increases again at where the future massive galaxies ( at ) are building up stellar mass at the dawn of the cosmic star formation.
With our synthetic universe, we are also able to make some predictions on future observations of SGRBs and their host galaxies. We compute the probability () that a SGRB observed at is hosted by a galaxy of mass as:
| (16) |
where is a normalisation constant such that .
In Fig. 13 we plot the distribution of at redshift for DTDs that assume different (columns), different tuples [] (rows), and different values of (colours). The distributions appear quite wide, with characteristics that vary with the fraction of prompt events in the DTD. In general, the distributions obtained with and are very similar for all parameters combinations, while the cases appear systematically more populated at the high masses end. This feature is less and less apparent as the fractions of prompt events in the DTD decreases (from the top left to bottom right panel). In other words, we expect that if the DTD is abundant in prompt events (i.e. steep , small ), the mass distribution of the SGRB hosts is well populated around .
The distributions shown in Fig. 13 result from the galaxies GSMF, and from the interplay between the SFR of galaxies of different masses and the fraction of prompt events in the DTD. The probability of the occurrence of a NSM event is proportional to the mass of the galaxy and to the current SFR through the prompt component. The higher this component, the more sensitive is the probability of the event to the current SFR, and the galaxy mass is relatively less important. Conversely, for DTDs with a smaller prompt fraction, the probability of the event is more sensitive to the value of the galaxy mass.
Fig. 14 shows the cumulative mass distribution of the hosts of NSMs at . At higher redshift all our DTDs produce virtually identical distributions for the expected host galaxy mass. In our mock Universe, at low-mass galaxies (i.e. ) account only for the of the NSMs. A similar contribution comes from galaxies with . At this redshift, NSMs are more likely to be hosted () by galaxies between and irrespective of the DTD.
We notice that our modelling does not account for galaxy mergers by construction. To do this, we should adopt a completely different approach, e.g. couple our formalism to theoretical models of galaxy formation. Nonetheless, we remark that the distribution of the NSM rate over the galaxy population in a redshift slice depends on the mass distribution of the galaxies and on the stellar age distribution within each object in the redshift slice. As long as our formalism reproduces these properties, we catch the main features of the NSM hosts. On the other hand, including merging would shift the average mass of NSM host to the left, e.g. by 0.3 dex, if one assumes that every galaxy had a single major merger in the last 6 Gyr.
We will check the effect of galaxy mergers quantitatively in a forthcoming paper where we will substitute our mock Universe with that of Illustris simulations.
5.2 Comparisons with the literature
Previous works have presented models for the fraction of NSMs in galaxies of different type. In the following we compare our results to those in Artale et al. 2020; Molero et al. 2021; Santoliquido et al. 2022 and Zevin et al. 2022.
Artale et al. 2020 have analysed the redshift evolution of the rate of NSM in passive and star-forming galaxies classified as such according to their sSFR being respectively lower and higher than yr-1. They used a population-synthesis simulation combined with galaxy catalogues from the EAGLE suite (Schaye
et al. 2015). They found that in the local Universe (at ) the contribution to the rate of NSM from passive galaxies is greater than that one from SF galaxies, while at , the vast majority of mergers occurs in SF galaxies. These results are consistent with the predictions of our model for a DTD with (lower left panel of Fig. 11).
The authors, also provide the predicted mass distribution of the hosts of NSMs at , , , (Fig. 2 of Artale et al. 2020). We compared our distribution of for at and 1 (not shown here) to the corresponding curves in Artale et al. 2020, and found a fair agreement between the two sets of models.
Molero et al. 2021 have computed the rate of NSM in elliptical, spiral, and irregular galaxies, and their contribution to the total rate in different cosmological scenarios. They test two options for the distribution of the delay times: a constant gravitational delay of 10 Myr added to the evolutionary lifetime of the secondary star and a DTD with . The different approach to the modelling of the evolution of galaxies in the Universe weakens the comparison between our and their results. However, we remark that in all the cosmological scenarios that they have tested, when a DTD is assumed their models predict that, in the local Universe, almost the of NSM are hosted by SF galaxies (spirals + irregulars). However, as pointed out by Nugent
et al. 2022, at passive galaxies contribute of the rate of NSMs. Our models with (DTD similar to the one used by Molero et al. 2021 ) predict that of NSMs in the local Universe are hosted by passive galaxies, in agreement with the results of Nugent
et al. 2022.
Therefore the different result on the properties of the NSM hosts reflects the dissimilar approach used to model the evolution of the galaxy population in the Universe.
Another difference concerns the value of which Molero et al. 2021 found of , i.e. more than 10 times larger than found here. Part of the discrepancy is due to their use of the old value of the cosmic NSM rate at zero redshift (Abbott
et al. 2020b), that was a factor of 3 larger than what adopted here.
Santoliquido et al. 2022 studied the redshift evolution of the merger rate density of compact objects and the properties of the binary systems hosts. They use a BPS code to model the delay times of compact objects, while the evolving galaxy population in the Universe obeys empirical fundamental scaling relations. These prescriptions determine the formation galaxy of the binary compact objects, while the host galaxy of the final mergers is found by applying a merger tree to the results of the EAGLE cosmological simulation (Schaye
et al. 2015). The authors present the results obtained with different assumptions, in particular concerning the efficiency of the Common Envelope . In spite of the different approach, it is worth comparing our results to theirs for the merging of binary neutron stars.
The cosmic evolution of the NSM rate in Santoliquido et al. 2022 models is broadly consistent with ours: the rate increases from redshift z=0 up to of a factor which varies between 1.5 and 8 depending on the assumptions for the galaxy population and the parameter. Our models present a similar variation for the explored range of parameters characterising the DTD, i.e. and .
Santoliquido et al. 2022 also found that in the local Universe the fraction of NSM hosted by passive galaxies strongly depends on the classification criteria. Specifically, they find that of local NSMs occur in passive galaxies if these are defined as objects with sSFR yr-1 (same criteria used by Artale et al. 2020). On the other hand, if passive galaxies are selected as those with a SFR 1 dex below the star-forming main sequence (similar to the criterion of sSFR yr-1, right column of Fig. 11), only of NSMs are hosted by passive galaxies. Their results are similar to those obtained with our modelling for a DTD with and (see bottom row of Fig. 12).
Zevin et al. 2022 have placed constraints on the DTD of SGRBs using observed SGRBs with host association. Assuming a pure power-law DTD, they used a sample 69 SGRBs with hosts from Fong
et al. 2022 to infer the index of the distribution. They conclude that SGRBs/NSMs have a DTD with a power-law index , with a credible interval that ranges form and . The conclusions of Zevin et al. 2022 are agreement with our results. In particular, we found that the fraction of SGRBs observed in star-forming galaxies advocates for DTD models with , which at long delays are well fit by a power-law with a slope of ).
6 Conclusions
In this paper, we presented a detailed investigation of possible observational facts that can allow us to constrain the delay time distribution of neutron star mergers. To do that we first developed a mock Universe composed of a sample of galaxies that fulfils three major observational constraints: i) the star formation rate density in the Universe by Madau &
Dickinson 2014; ii) the galaxy stellar mass function of nearby galaxies derived by Peng
et al. 2010; iii) the star-forming main sequence of galaxies (Renzini &
Peng 2015). The galaxies in our mock universe
undergo a SFH described by a lognormal function with two parameters, as proposed by 39, and include massive ( ) galaxies (Abramson
et al. 2016) to which we add low-mass galaxies down to .
The redshift evolution of the rate of neutron star mergers is then computed by convolving the SFH of each galaxy with the parametric delay time distributions derived by Greggio et al. 2021. The shape
of these DTDs depends on four parameters: , , and , representing respectively the slope of the distribution of the separations and its minimum value, the slope of the distribution of the total masses and that of the distribution of the eccentricities, all parameters characteristic of the binary neutron star systems at birth.
The local rate of binary neutron star mergers of Abbott
et al. 2021a is used to calibrate the global model for the cosmic NSM rate, yielding a value for the realization probability of the NSM evolutionary channel. In addition, our modelling allows us to present the expected relations between the rate of NSM and the properties of the host galaxy.
Our main results are as follows:
- –
Between and the rate of NSMs increases with a slope that depends on the parameters of the DTD (mainly on and ). The difference between the highest rate (i.e. at ) and the local one increases with the fraction of prompt events characterizing the DTD. Assuming that NSMs are the progenitors of SGRBs, we compare our theoretical curves with the redshift evolution of the rate of SGRBs computed by Ghirlanda et al. 2016. This constraint favours DTD with , as found in Greggio et al. 2021.
- –
Adopting the current estimate for the rate of NSMs in the local Universe, we estimate that the fraction of neutron star progenitors living in binary systems with the right characteristics to lead to a NSM within a Hubble time ranges between and . This large uncertainty is a direct consequence of the uncertainty affecting the local rate of NSM mergers computed by Abbott et al. 2021a. We find that the most probable value for the realization probability is of with a weak dependence on the DTD parameters and (see Fig. 8).
- –
We find a dramatic variation of the fraction of NSMs hosted by star-forming galaxies among models with different fractions of prompt events, mainly controlled by the and parameters. In addition, at a given DTD model, the fraction of NSM hosted by star-forming galaxies is found very sensitive to the criterion used to divide galaxies in star-forming and passive. Nugent et al. 2022 found that of SGRBs are observed in star-forming galaxies. Adopting the same classification criterion, we find that the fraction of SGRBs observed in star-forming galaxies favours DTDs with at least of mergers within Myr (). These figures refer to which is the average redshift of the host galaxies in the Nugent et al. 2022 sample.
- –
The evolution with redshift of the fraction of NSMs in star-forming galaxies depends on the criterion used to define them and on the DTD. Current empirical estimates of this trend (Nugent et al. 2022) are affected by large uncertainties caused by the poor statistics so that all our models are compatible with the data. Larger datasets ( events with ) will allow exploiting this trend to constrain the DTD (see Appendix B).
- –
The combined effect of the DTD and GSMF is such that in the local Universe we expect a different distribution of host mass for different ’s. In particular, steeper DTDs () generate more events in lower mass galaxies, compared with flatter ones (). This difference rapidly vanishes as increases, and at the median host mass around virtually irrespective of the DTD shape.
In Fig. 15 we show the redshift distribution of the number of NSMs per year in our mock Universe. The steep increase with redshift of the sampled volume dominates over the increase of the volume density of the rate of NSM, so the redshift distribution of the rate of NSM is almost independent of the shape of the DTD. Only at does the rate of events show a higher value for those DTDs with a larger fraction of short delay times, with a difference of at z=1 increasing to more than at the peak of the distribution going from to .
In Fig. 15 we also show the expected depth for the sensitivity to NSMs of the observing runs O422
2
Advanced LIGO + Advanced Virgo Plus + KAGRA and O533
3
Advanced LIGO + Advanced Virgo Plus + KAGRA + LIGO-India (from 2025). In the O4 run (Abbott
et al. 2020a, see), Advanced LIGO will be the deepest instrument of the network sensitive to NSMs occurring at a distance smaller than 160-190 Mpc, which corresponds to a . In one year, in our mock Universe NSMs explode within the redshift limit of O4 (). The preliminary plans for O5 indicate a target for the sensitivity to NSMs events up to a distance of Mpc that corresponds to . In this case, we expect a number of in one year.
SGRBs with host association seems to be the most reliable short-term observational proxy to put some constraints on the DTD of NSMs. On the other hand, the third-generation of gravitational-wave detectors network may provide samples of gravitational waves events large enough to yield a complementary way to determine the DTD of NSMs (Safarzadeh &
Berger 2019; Safarzadeh
et al. 2019a; Safarzadeh et al. 2019b; McCarthy et al. 2020, see).
We remark that the figures presented here depend on our description of the galaxy population in the Universe. Therefore our predictions will be to some extent subject to revision with different constraints, especially regarding the SFH of galaxies. Nevertheless, the most promising data to constrain the DTD of NSM appears to be the fraction of events occurring in star-forming galaxies, and its evolution with redshift.
Data availability
The data underlying this article will be shared on reasonable request to the corresponding author.
Acknowledgements
We thank an anonymous referee for his/her comments which improved the quality of this paper. We are indebted to Dr L. Abramson for sending us the data of the G13 galaxy sample, which are at the basis of our computations.
References
- Abbott et al. (2017a) Abbott B. P., et al., 2017a, Phys. Rev. Lett., 119, 161101
- Abbott et al. (2017b) Abbott B. P., et al., 2017b, ApJ, 848, L12
- Abbott et al. (2017c) Abbott B. P., et al., 2017c, ApJ, 848, L13
- Abbott et al. (2020a) Abbott B. P., et al., 2020a, Living Reviews in Relativity, 23, 3
- Abbott et al. (2020b) Abbott B. P., et al., 2020b, ApJ, 892, L3
- Abbott et al. (2021a) Abbott R., et al., 2021a, ApJ, 913, L7
- Abbott et al. (2021b) Abbott R., et al., 2021b, ApJ, 915, L5
- Abramson et al. (2016) Abramson L. E., Gladders M. D., Dressler A., Oemler Augustus J., Poggianti B., Vulcani B., 2016, ApJ, 832, 7
- Andrews & Zezas (2019) Andrews J. J., Zezas A., 2019, MNRAS, 486, 3213
- Artale et al. (2020) Artale M. C., Mapelli M., Bouffanais Y., Giacobbo N., Pasquato M., Spera M., 2020, MNRAS, 491, 3419
- Belczynski et al. (2020) Belczynski K., et al., 2020, A&A, 636, A104
- Berger (2014) Berger E., 2014, ARA&A, 52, 43
- Bisterzo et al. (2015) Bisterzo S., et al., 2015, MNRAS, 449, 506
- Bloom et al. (1998) Bloom J. S., Djorgovski S. G., Kulkarni S. R., Frail D. A., 1998, ApJ, 507, L25
- Bloom et al. (2002) Bloom J. S., Kulkarni S. R., Djorgovski S. G., 2002, AJ, 123, 1111
- Calvi et al. (2011) Calvi R., Poggianti B. M., Vulcani B., 2011, MNRAS, 416, 727
- Cavallo et al. (2021) Cavallo L., Cescutti G., Matteucci F., 2021, MNRAS, 503, 1
- Cescutti et al. (2015) Cescutti G., Romano D., Matteucci F., Chiappini C., Hirschi R., 2015, A&A, 577, A139
- Christensen et al. (2004) Christensen L., Hjorth J., Gorosabel J., 2004, A&A, 425, 913
- Ciolfi (2018) Ciolfi R., 2018, International Journal of Modern Physics D, 27, 1842004
- Côté et al. (2019) Côté B., et al., 2019, ApJ, 875, 106
- Coulter et al. (2017) Coulter D. A., et al., 2017, Science, 358, 1556
- Cowperthwaite et al. (2017) Cowperthwaite P. S., et al., 2017, ApJ, 848, L17
- D’Avanzo et al. (2014) D’Avanzo P., et al., 2014, MNRAS, 442, 2342
- Djorgovski et al. (1998) Djorgovski S. G., Kulkarni S. R., Bloom J. S., Goodrich R., Frail D. A., Piro L., Palazzi E., 1998, ApJ, 508, L17
- Eichler et al. (1989) Eichler D., Livio M., Piran T., Schramm D. N., 1989, Nature, 340, 126
- Eichler et al. (2015) Eichler M., et al., 2015, ApJ, 808, 30
- Fong et al. (2013) Fong W., et al., 2013, ApJ, 769, 56
- Fong et al. (2022) Fong W.-f., et al., 2022, arXiv e-prints, p. arXiv:2206.01763
- Freiburghaus et al. (1999) Freiburghaus C., Rosswog S., Thielemann F. K., 1999, ApJ, 525, L121
- Fruchter et al. (2006) Fruchter A. S., et al., 2006, Nature, 441, 463
- Gal-Yam et al. (2008) Gal-Yam A., et al., 2008, ApJ, 686, 408
- Galama et al. (1998) Galama T. J., et al., 1998, Nature, 395, 670
- Gehrels et al. (2004) Gehrels N., et al., 2004, ApJ, 611, 1005
- Gehrels et al. (2006) Gehrels N., et al., 2006, Nature, 444, 1044
- Ghirlanda et al. (2016) Ghirlanda G., et al., 2016, A&A, 594, A84
- Giacobbo & Mapelli (2018) Giacobbo N., Mapelli M., 2018, MNRAS, 480, 2011
- Giacomazzo et al. (2013) Giacomazzo B., Perna R., Rezzolla L., Troja E., Lazzati D., 2013, ApJ, 762, L18
- Gladders et al. (2013) Gladders M. D., Oemler A., Dressler A., Poggianti B., Vulcani B., Abramson L., 2013, ApJ, 770, 64
- Goldstein et al. (2017) Goldstein A., et al., 2017, ApJ, 848, L14
- Goriely et al. (2015) Goriely S., Bauswein A., Just O., Pllumbi E., Janka H. T., 2015, MNRAS, 452, 3894
- Greggio (2005) Greggio L., 2005, A&A, 441, 1055
- Greggio & Renzini (2011) Greggio L., Renzini A., 2011, Stellar Populations. A User Guide from Low to High Redshift
- Greggio et al. (2021) Greggio L., Simonetti P., Matteucci F., 2021, MNRAS, 500, 1755
- Guetta & Piran (2006) Guetta D., Piran T., 2006, A&A, 453, 823
- Hajela et al. (2019) Hajela A., et al., 2019, ApJ, 886, L17
- Hjorth et al. (2003) Hjorth J., et al., 2003, Nature, 423, 847
- Howard et al. (1986) Howard W. M., Mathews G. J., Takahashi K., Ward R. A., 1986, ApJ, 309, 633
- Ishimaru et al. (2015) Ishimaru Y., Wanajo S., Prantzos N., 2015, ApJ, 804, L35
- Kilpatrick et al. (2022) Kilpatrick C. D., et al., 2022, ApJ, 926, 49
- Leibler & Berger (2010) Leibler C. N., Berger E., 2010, ApJ, 725, 1202
- Lippuner et al. (2017) Lippuner J., Fernández R., Roberts L. F., Foucart F., Kasen D., Metzger B. D., Ott C. D., 2017, MNRAS, 472, 904
- Madau & Dickinson (2014) Madau P., Dickinson M., 2014, ARA&A, 52, 415
- Matteucci et al. (2014) Matteucci F., Romano D., Arcones A., Korobkin O., Rosswog S., 2014, MNRAS, 438, 2177
- McCarthy et al. (2020) McCarthy K. S., Zheng Z., Ramirez-Ruiz E., 2020, MNRAS, 499, 5220
- Molero et al. (2021) Molero M., Simonetti P., Matteucci F., della Valle M., 2021, MNRAS, 500, 1071
- Nakar (2007) Nakar E., 2007, Phys. Rep., 442, 166
- Nugent et al. (2022) Nugent A. E., et al., 2022, arXiv e-prints, p. arXiv:2206.01764
- O’Connor et al. (2022) O’Connor B., et al., 2022, arXiv e-prints, p. arXiv:2204.09059
- Oechslin et al. (2007) Oechslin R., Janka H. T., Marek A., 2007, A&A, 467, 395
- Panov et al. (2008) Panov I. V., Korneev I. Y., Thielemann F. K., 2008, Astronomy Letters, 34, 189
- Peng et al. (2010) Peng Y.-j., et al., 2010, ApJ, 721, 193
- Perego et al. (2014) Perego A., Rosswog S., Cabezón R. M., Korobkin O., Käppeli R., Arcones A., Liebendörfer M., 2014, MNRAS, 443, 3134
- Prochaska et al. (2006) Prochaska J. X., et al., 2006, ApJ, 642, 989
- Rastinejad et al. (2022) Rastinejad J. C., et al., 2022, Nature, 612, 223
- Renzini & Peng (2015) Renzini A., Peng Y.-j., 2015, ApJ, 801, L29
- Rosswog et al. (2000) Rosswog S., Davies M. B., Thielemann F. K., Piran T., 2000, A&A, 360, 171
- Rosswog et al. (2014) Rosswog S., Korobkin O., Arcones A., Thielemann F. K., Piran T., 2014, MNRAS, 439, 744
- Roy (2021) Roy A., 2021, Galaxies, 9, 79
- Safarzadeh & Berger (2019) Safarzadeh M., Berger E., 2019, ApJ, 878, L12
- Safarzadeh et al. (2019a) Safarzadeh M., Berger E., Ng K. K. Y., Chen H.-Y., Vitale S., Whittle C., Scannapieco E., 2019a, ApJ, 878, L13
- Safarzadeh et al. (2019b) Safarzadeh M., Berger E., Leja J., Speagle J. S., 2019b, ApJ, 878, L14
- Salpeter (1955) Salpeter E. E., 1955, ApJ, 121, 161
- Santoliquido et al. (2022) Santoliquido F., Mapelli M., Artale M. C., Boco L., 2022, MNRAS, 516, 3297
- Savchenko et al. (2017) Savchenko V., et al., 2017, ApJ, 848, L15
- Schaye et al. (2015) Schaye J., et al., 2015, MNRAS, 446, 521
- Simonetti et al. (2019) Simonetti P., Matteucci F., Greggio L., Cescutti G., 2019, MNRAS, 486, 2896
- Soares-Santos et al. (2017) Soares-Santos M., et al., 2017, ApJ, 848, L16
- Stanek et al. (2003) Stanek K. Z., et al., 2003, ApJ, 591, L17
- Symbalisty & Schramm (1982) Symbalisty E., Schramm D. N., 1982, Astrophys. Lett., 22, 143
- Tacchella et al. (2022) Tacchella S., et al., 2022, ApJ, 926, 134
- Tanaka et al. (2017) Tanaka M., et al., 2017, PASJ, 69, 102
- Tang et al. (2020) Tang P. N., Eldridge J. J., Stanway E. R., Bray J. C., 2020, MNRAS, 493, L6
- Tanvir et al. (2013) Tanvir N. R., Levan A. J., Fruchter A. S., Hjorth J., Hounsell R. A., Wiersema K., Tunnicliffe R. L., 2013, Nature, 500, 547
- Thielemann et al. (2017) Thielemann F. K., Eichler M., Panov I. V., Wehmeyer B., 2017, Annual Review of Nuclear and Particle Science, 67, 253
- Troja et al. (2019) Troja E., et al., 2019, MNRAS, 489, 1919
- Ukwatta et al. (2016) Ukwatta T. N., et al., 2016, GRB Coordinates Network, 19148, 1
- Valenti et al. (2017) Valenti S., et al., 2017, ApJ, 848, L24
- Villar et al. (2017) Villar V. A., et al., 2017, ApJ, 851, L21
- Wainwright et al. (2007) Wainwright C., Berger E., Penprase B. E., 2007, ApJ, 657, 367
- Wanajo et al. (2014) Wanajo S., Sekiguchi Y., Nishimura N., Kiuchi K., Kyutoku K., Shibata M., 2014, ApJ, 789, L39
- Woosley & Bloom (2006) Woosley S. E., Bloom J. S., 2006, ARA&A, 44, 507
- Yang et al. (2022) Yang J., et al., 2022, arXiv e-prints, p. arXiv:2204.12771
- Zevin et al. (2022) Zevin M., Nugent A. E., Adhikari S., Fong W.-f., Holz D. E., Kelley L. Z., 2022, ApJ, 940, L18
- Zhang et al. (2007) Zhang B., Zhang B.-B., Liang E.-W., Gehrels N., Burrows D. N., Mészáros P., 2007, ApJ, 655, L25
Appendix A On the galaxy stellar mass function
As discussed in Section 2.1, the sample of galaxies of 39 shows an over-density of objects at . In Fig. 16
we show the original sample of 39 (plotted in grey) and the GSMF of Peng
et al. 2010 (dark red solid line); one can see that an over-density is present in all the mass bins. As reported in 39, their sample of galaxies is composed of two sub-samples. The first has been taken from the Padova-Millennium Galaxy and Group Catalogue (PG2MC) survey (Calvi
et al. 2011, see ), which covers a large volume () and has a mass lower limit of . The second, is from the Sloan Digital Sky Survey (SDSS) observations of the northern galactic cap, covers a smaller volume (), and has a mass limit of . This second sample has been used to extend the PG2MC sample to the lower mass regime and has been cut at a mass of . When constructing the GSMF we account for the different Volumes sampled by the two sub-samples. Fig. 17 shows the redshift distribution of the two sub-samples. It appears that the PG2MC sample shows three clear over-densities of points at specific redshifts: , , and , indicated with black arrows. These features may indicate that a fraction of the galaxies contained in the survey belong to galaxy clusters. This could be responsible for the over-density of the 39 GSMF with respect to the one in 62.
We estimated that, on average, the number of galaxies per mass bin of 39 differs from the one of 62 as follows:
| (17) |
However, with such a great reduction of galaxies, the SFRD of the 39 sample is not in agreement with the one determined by Madau & Dickinson 2014. In addition, we notice that part of the discrepancy between the P10 and G13 GSMFs may come from the different ways in which the return fraction is included in the evaluation of the current galaxy mass. We thus adopt the following compromise to combine the GSMFs: increasing the GSMF of 62 by a factor of and reducing the one of Gladders et al. 2013 by a factor of . As shown in Fig. 16, this solution relieves the tension In the range and, at the same time, allows us to reproduce the SFRD of Madau & Dickinson 2014 (see Fig. 5).
Appendix B Short Gamma-Ray Bursts statistic
As discussed in Section 4, the observational values of the redshift evolution of SGRBs hosted by SF galaxies are affected by large uncertainties. These are caused by the shot noise associated with the number of SGRBs observed in a certain redshift bin.
To compute the observational values and their uncertainties we retrieved for each SGRB contained in the sample of Nugent
et al. 2022 its redshift () and the type of the host (passive or SF). In Table 1 we report, for six redshift bins: the total number of SGRBs (), the number of SGRBs hosted by SF galaxies (), and the fraction with its uncertainties.
We evaluate the uncertainties with the relation:
| (18) |
where and are the Poissonian errors associated to
and respectively, i.e.
We also computed the uncertainties of an hypothetical sample of 600 SGRBs with host association at ( times larger than the current one). To compute this, we kept fixed redshift evolution of and we simply increase the number SGRBs associated with SF or passive galaxies in each redshift bin, up to . On Fig. 18 we show the uncertainties of the current sample (in blue), and those of a times larger sample (in orange). By improving the statistics of SGRBs with host association at low redshift () by one order of magnitude we could be able to discriminate between DTD with different s. This is unfeasible with the current uncertainties.