CEERS: Diversity of Lyman-Alpha Emitters during the Epoch of ReionizationJournal: the Astrophysical Journal
Abstract
We analyze rest-frame ultraviolet to optical spectra of three – galaxies whose Ly-emission lines were previously detected with Keck/MOSFIRE observations, using the JWST/NIRSpec observations from the Cosmic Evolution Early Release Science (CEERS) survey. From NIRSpec data, we confirm the systemic redshifts of these Ly emitters, and emission-line ratio diagnostics indicate these galaxies were highly ionized and metal poor. We investigate Ly line properties, including the line flux, velocity offset, and spatial extension. For the one galaxy where we have both NIRSpec and MOSFIRE measurements, we find a significant offset in their flux measurements ( greater in MOSFIRE) and a marginal difference in the velocity shifts. The simplest interpretation is that the Ly emission is extended and not entirely encompassed by the NIRSpec slit. The cross-dispersion profiles in NIRSpec reveal that Ly in one galaxy is significantly more extended than the non-resonant emission lines. We also compute the expected sizes of ionized bubbles that can be generated by the Ly sources, discussing viable scenarios for the creation of sizable ionized bubbles (1 physical Mpc). The source with the highest-ionization condition is possibly capable of ionizing its own bubble, while the other two do not appear to be capable of ionizing such a large region, requiring additional sources of ionizing photons. Therefore, the fact that we detect Ly from these galaxies suggests diverse scenarios on escape of Ly during the epoch of reionization. High spectral resolution spectra with JWST/NIRSpec will be extremely useful for constraining the physics of patchy reionization.
Keywords:
Reionization (1383); Early universe (435); Intergalactic medium (813); High-redshift galaxies (734); Lyman-alpha galaxies (978); Extragalactic astronomy (506)I Introduction
Reionization models predict different scenarios of, for example, early vs. late reionization (Rosdahl et al. 2022; Kannan et al. 2022; Yung et al. 2020b; Yung et al. 2020a, e.g.,), questioning the primary sources of ionizing photons that are responsible for reionizing the neutral intergalactic medium (IGM). An earlier start of reionization is expected when faint and low-mass galaxies with a higher Lyman-continuum (LyC) escape dominate the ionizing photon budget over bright galaxies (Finkelstein et al. 2019b). Conversely, a relatively delayed process of reionization is predicted when the contributions from faint galaxies ( -) are subdominant to that from brighter systems (Robertson et al. 2015; Naidu et al. 2020). Thus, the relative contributions of faint versus bright galaxies to reionization must be imprinted in the temporal and spatial evolution of reionization, and optimal places for probing the sources of ionizing photons are ionized regions in the IGM where we expect to detect Lyman-alpha (Ly) from galaxies (Iliev et al. 2006; Mesinger & Furlanetto 2008; Rosdahl et al. 2018; Ocvirk et al. 2020; Smith et al. 2021, e.g.,).
Ly observations have been broadly used to trace the existence of neutral gas in the IGM (Rhoads & Malhotra 2001; Stark et al. 2011; Pentericci et al. 2011; Tilvi et al. 2014, e.g.,) as the visibility of Ly is sensitive to the amount of neutral hydrogen in the IGM due to resonant scattering (Miralda-Escudé & Rees 1998; Dijkstra et al. 2014, e.g.,). Although Ly is heavily suppressed by the neutral IGM into the epoch of reionization, largely-ionized bubbles in the IGM should provide channels for escape of Ly (Mason & Gronke 2020; Park et al. 2021; Qin et al. 2021; Smith et al. 2021, e.g.,). Thus, this allows us to locate ionized regions in the mostly neutral IGM by finding Ly-emission lines from reionization-era galaxies. Also, the IGM transmission and line profiles of Ly to constrain the IGM neutral fraction (Mason et al. 2018; Mason et al. 2019; Hoag et al. 2019; Jung et al. 2020; Bolan et al. 2022; Hayes & Scarlata 2023, e.g.,).
Over the last decade, spectroscopic searches for Ly from reionization-era galaxies at 7 – 9 have been discovering Ly-emission lines particularly from UV-brighter ( ) galaxies (Finkelstein et al. 2013; Zitrin et al. 2015; Oesch et al. 2015; Roberts-Borsani et al. 2016; Castellano et al. 2018; Hu et al. 2021; Endsley & Stark 2022; Larson et al. 2022; Jung et al. 2022a; Jung et al. 2022b, e.g.,), compared to rarer findings from fainter ones (Hoag et al. 2019; Roberts-Borsani et al. 2022). The higher detection rates for Ly in brighter galaxies hint that reionization proceeded earlier in galaxy-overdense regions where the bright galaxies typically reside. In hierarchical models, higher-density peaks collapse earlier, and more massive galaxies form at these peaks. This results in ionized bubbles in the mostly neutral IGM forming first around the brighter reionization-era galaxies (Mesinger et al. 2011; Ocvirk et al. 2020; Kannan et al. 2022).
While the detection of Ly from galaxies at the reionization epoch suggests the existence of sizable ionized structures (1 physical Mpc; pMpc) in the IGM (Mason & Gronke 2020; Park et al. 2021; Qin et al. 2021; Smith et al. 2021), this requires that there be a sufficient supply of ionizing (or LyC) photons within the ionized regions. To draw conclusions about the main driver of reionization, the contribution of galaxies to the required ionizing emissivity must be probed in detail (Finkelstein et al. 2019a; Yung et al. 2020b; Naidu et al. 2020; Yeh et al. 2023, e.g.,). However, the actual supply of LyC photons from galaxies cannot be directly measured from reionization-era galaxies due to IGM attenuation. Instead, it needs to be indirectly inferred from the combination of the LyC escape fraction () and the ionizing photon production efficiency ().
In this work, we use the JWST/NIRSpec observations from the Cosmic Evolution Early Release Science (CEERS) survey to analyze rest-frame ultraviolet to optical spectra of three – Ly emitters (LAEs). We focus on understanding the detailed interstellar medium (ISM) properties based on our emission-line analysis as well as the escape of Ly with the estimates of the ionized bubble sizes. With a suite of emission lines detected in the NIRSpec observations of our targets, we measure the ionizing photon production efficiency () and infer the LyC escape fraction () based on indirect indicators of (Izotov et al. 2018; Chisholm et al. 2018; Chisholm et al. 2022; Flury et al. 2022a; Mascia et al. 2023). We then predict the growth of self-driven ionized bubbles around these LAEs to explore possible scenarios for creating sizable ionized bubbles that provide the channels for escape of Ly.
This paper is structured as follows. In Section 2, we describe our spectroscopic targets, NIRSpec and MOSFIRE observations, and data reduction. We present the emission-line analysis including Ly emission, giving the measured physical properties of these emission lines as well as the line-ratio diagnostics in Section 3. Section 4 discusses the ISM properties and escape of Ly photons. We then summarize our conclusions in Section 5. In this work, we assume the Planck cosmology (Planck Collaboration et al. 2016) with = 67.8 km s-1 Mpc-1, = 0.308, and = 0.692. The Hubble Space Telescope (HST) F606W, F814W, F105W, F125W, F140W, and F160W bands are referred to as , , , , and , respectively. All magnitudes in this work are quoted in the AB system (Oke & Gunn 1983), and all errors mentioned in this paper represent 1 uncertainties (or central 68% confidence ranges) unless stated otherwise.
II Observations and Data Reduction
The JWST/NIRSpec (Jakobsen et al. 2022; Böker et al. 2023) observations of our targets were obtained as part of the NIRSpec observations in the Cosmic Evolution Early Release Science (CEERS; ERS 1345, PI: S. Finkelstein) Survey in the CANDELS (Grogin et al. 2011; Koekemoer et al. 2011) Extended Groth Strip (EGS) field. The CEERS survey will be fully described in S. Finkelstein et al. (in preparation, see also Finkelstein et al. 2022a; Finkelstein et al. 2022b), with the NIRSpec data described in P. Arrabal Haro et al. (in prepapration).
∗Known as EGS-zs8-2 in Roberts-Borsani et al. 2016 and Stark et al. 2017.
| Source ID (MPT ID) | R.A. (J2000.0) | Decl. (J2000.0) | Grating | Ref. | ||
|---|---|---|---|---|---|---|
| (degree) | (degree) | (mag) | ||||
| z8_13573 (686) | 215.15088 | 52.98957 | 7.7528 | 26.5 | PRISM | [1] |
| z8_32350 (689) | 214.99903 | 52.94197 | 7.5457 | 25.3 | MR | [1] |
| z8_69492 (698)∗ | 215.05033 | 53.00745 | 7.4710 | 25.2 | MR | [2],[3] |
Note. — : the mean value of emission-line redshifts from H and [O iii]. References: [1] Jung et al. 2022b, [2] Roberts-Borsani et al. 2016, [3] Stark et al. 2017
II.1 Targets: Ly-Emitters at –
The target galaxies discussed in this work were selected from 13 spectroscopically-confirmed galaxies in EGS (Oesch et al. 2015; Roberts-Borsani et al. 2016; Tilvi et al. 2020; Jung et al. 2022b), from which Ly-emission lines were detected in previous ground-based observations with the MOSFIRE spectrograph (McLean et al. 2012) on the Keck telescopes. In the CEERS NIRSpec multi-object spectroscopy (MOS) observations, the NIRSpec’s Micro-Shutter Array (Ferruit et al. 2022, MSA;) configurations were created to maximize the number of targets from the full samples from various science cases. This resulted in three LAEs being targeted in the NIRSpec observations, which includes two UV-luminous galaxies with . The target properties are summarized in Table 1. z8_13573 and z8_32350 were introduced in Jung et al. 2022b, and Ly emission of z8_69492 (known as EGS-zs8-2) was reported first in Roberts-Borsani et al. 2016 and Stark et al. 2017.
II.2 JWST/NIRSpec Data
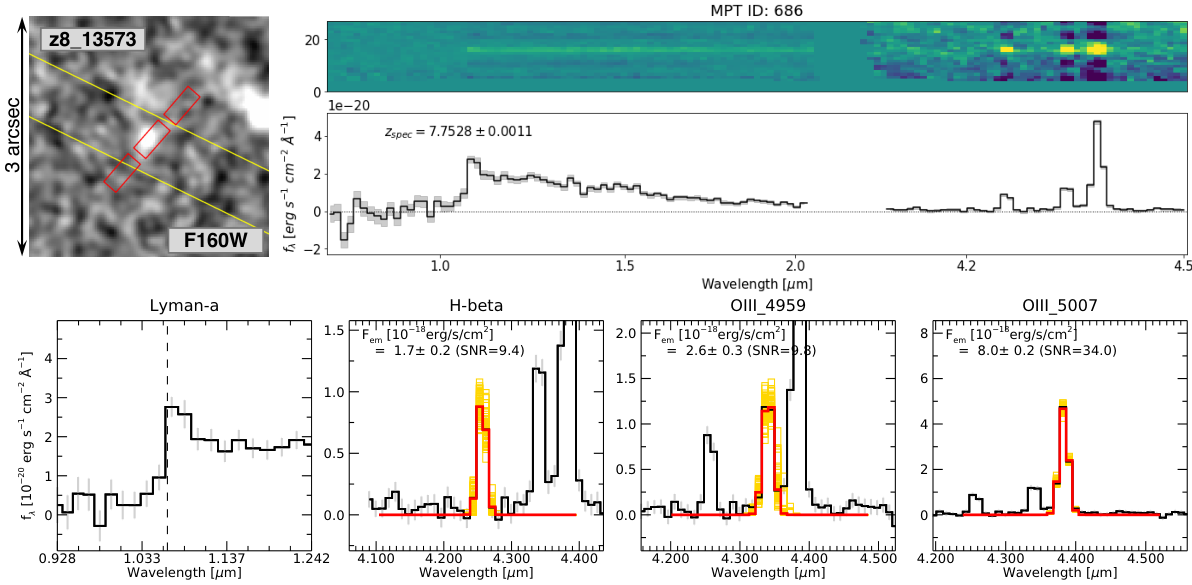
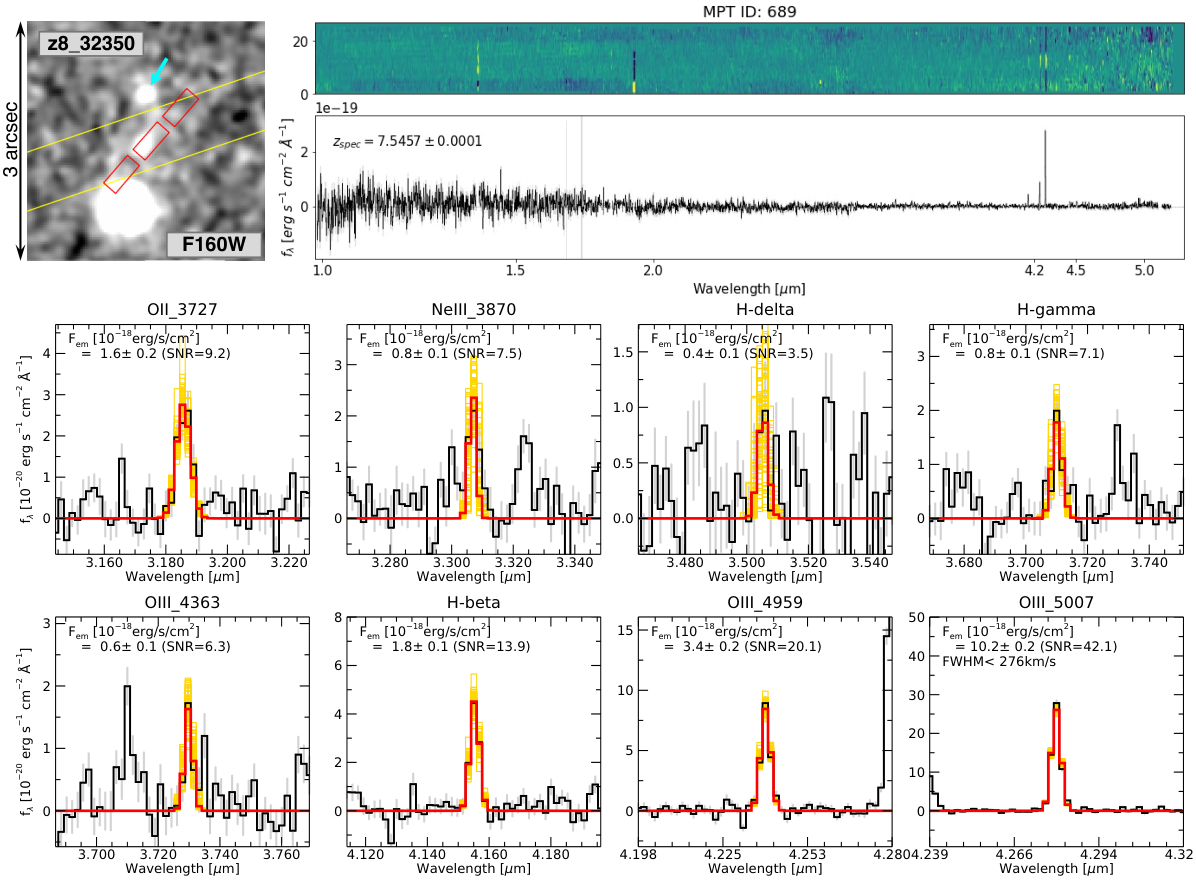
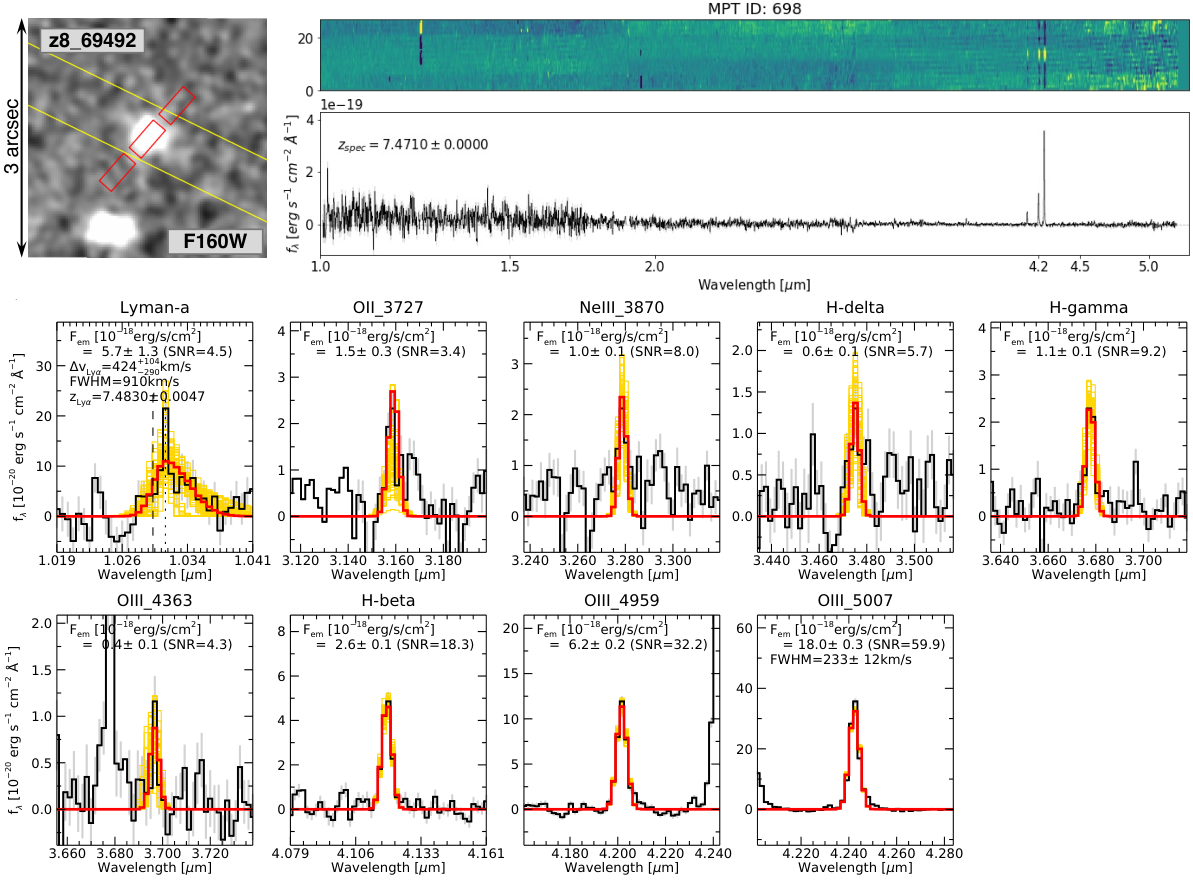
The NIRSpec observations in the CEERS program include 6 NIRSpec MSA pointings observed with the PRISM ( – ) and CLEAR filter, covering the wavelength range 0.6–5.3m, and 6 pointings observed with the medium-resolution (MR; ) grating/filter pairs G140M/F100LP, G235M/F170LP, and G395M/F290LP, covering the observed wavelength range of – m. Four fields have both MR nad PRISM observations. The NIRSpec targets were observed using three micro shutter slitlets, and a three-point nodding pattern is adopted for background subtraction. Each nod consists of a single integration of 14 groups with 1036 s exposure, resulting in 3107 s of total exposure time. In the top left panels of Figure 1 – 3, we show the three slitlets (red rectangles) on the HST images of individual sources.
Here we briefly summarize the main steps of the CEERS NIRSpec data reduction. A detailed description of the data reduction is found in P. Arrabal Haro et al. (in preparation).
The CEERS NIRSpec observations were reduced using the JWST Science Calibration Pipeline version 1.8.511 1 https://jwst-pipeline.readthedocs.io/en/latest/ with the JWST Calibration Reference Data System (CRDS) mapping 1027. We use the calwebb_detector1 pipeline to reduce the Level 0 uncalibrated data products of “_uncal.fits” files. This step includes the saturation check, the bias and dark current subtraction, the correction of the “snowballs” events caused by cosmic rays, and the 1/f noise correction, generating the count-rate maps (CRMs) from the uncalibrated data. For the jump step at the detector-level calibration, we used custom parameters for an improved “snowballs” correction.
The reduced CRMs were then passed through the calwebb_spec2 pipeline. This creates two-dimensional (2D) cutouts of individual slitlets, that are flat-fielded, rectified, and flux-calibrated with the wavelength solution based on the JWST Calibration Reference Data System (CRDS). Then the final 2D spectra were obtained by combining the three nods spectra with the calwebb_spec3 pipeline, and the one-dimensional (1D) spectra were extracted using customized apertures on the 2D spectra to maximize the signal-to-noise ratios (SNRs). Lastly, for MR-grating-observed targets, a single spectrum was generated per each target, combining all three MR gratings. Slit-loss corrections were applied with the path-loss correction step in the pipeline, which assumes that the targets are point sources. The resulting 1D and 2D spectra of our targets are shown in the top-right panels in Figures 1 – 3.
II.3 Keck/MOSFIRE data
Ly-emission lines are detected in the NIRSpec observations from only two of the sources (z8_13573 with prism and z8_69492 with MR grating), and the low-resolution prism observations for z8_13573 precludes detailed analysis of its Ly line. Fortunately, however, our high-spectral resolution ( ) MOSFIRE spectra enable key measurements of the Ly lines for the sources.
MOSFIRE spectra of our sample were obtained as part of the Keck MOSFIRE -band observations (Jung et al. 2022b) awarded through the NASA allocation (PI: I. Jung). The observations were carried out in two nights in April 2021. The entire observing program consists of four slitmask configurations with a 3.5 hr integration time per mask. z8_69492 and z8_13573 were targeted in the first slitmask configuration (EGS_Y_2021A_1) with the moderately good seeing condition of 0.7″, and z8_32350 was observed in the slitmask (EGS_Y_2021A_3) with 1.2″seeing. More details on the observations are found in Table 1 in Jung et al. 2022b.
III Analysis
III.1 Emission-Line Fitting in JWST/NIRSpec data
To find emission lines, we perform emission-line fitting with the reduced 1D NIRSpec spectra. We first locate strong H and [O iii] emission lines with the initial guesses based on the spectroscopic redshifts measured from Ly. By performing Gaussian fitting, we measure the fiducial values of systemic redshifts and emission-line widths from the mean values of these lines. Then, we fix the systemic redshifts and the line widths allowed in the Gaussian fitting for all detected emission lines. For the error estimates, we perform Gaussian fitting with 1000 Monte Carlo realizations that are 1D spectra randomly perturbed with corresponding error spectra. [O ii] doublets are mostly blended in the MR-grating spectra, but we fit a double Gaussian functional form to [O ii] doublets to properly model the blended feature. For Ly emission, we perform asymmetric Gaussian fitting, and the FWHM of Ly is measured as FWHM=(FWHM+FWHM. The line fluxes are measured as the area under the best-fit Gaussian, and we subtract the instrumental broadening from the fiducial line width of H and [O iii]. We find Ly emission from two of our LAEs, z8_13573 and z8_69492, in NIRSpec observations. We are unable to locate Ly from z8_32350 in its NIRSpec G140M grating spectrum. This is probably due to its fainter Ly, compared to that of z8_69492, below the detection limit. In addition to the prominent detection of H and the [O iii] doublet from the three sources, we also find additional nebular emission lines from MR grating spectra of the two sources of z8_32350 and z8_69492. In the bottom panels of Figures 1 – 3 we present the individual emission lines of our interest in this work with their flux measurements. Also, the common diagnostics of emission-line ratios are listed in Table 2. We will discuss the Ly properties as well as the ISM properties with the analyses of the line ratios in Section 4.
III.2 Ly Measurements from MOSFIRE
The MOSFIRE observations provide high spectral resolution spectra () of Ly from our sources. Taking advantage of the high-resolution MOSFIRE spectra, we investigate the detailed properties of the Ly lines, including Ly velocity offsets.
Figure 4 shows the MOSFIRE Ly spectra of z8_32350 (top) and z8_69492 (bottom). The fiducial values and the errors are taken from the best-fit asymmetric Gaussian fitting to the reduced 1D spectra and 1000 resamplings of 1D spectra by perturbing 1D spectra with corresponding error spectra. The velocity offsets of Ly are measured compared to the systemic redshifts estimated from the NIRSpec spectra. For z8_13573, we take the key measurements available in Jung et al. 2022b. For z8_32350, Jung et al. 2022b reported the detection of Ly at . However, it does not match the expected wavelengths of any possible emission lines from a system, which we measure from the [O iii] and H emission lines from the NIRSpec observations. This object has a nearby companion which is a high-redshift candidate as well (z8_32349; ), marked with the cyan arrow in the HST cutout in Figure 2. The potential companion is located very close to z8_32350 in the spatial direction of the MOSFIRE slit (the yellow lines). It is therefore possible that the emission line reported in Jung et al. 2022b is associated with the other companion object while additional observations are required to confirm its nature. Instead, we notice a marginal detection (at a 2 level) of an emission line at from the MOSFIRE spectrum (Figure 4). The emission line is noticeable with a visual inspection, but the detection significance is low as it is found right next to a sky line. Therefore, it has been removed from the emission-line candidates in Jung et al. 2022b. In addition to the marginal 2-level detection, a separate MOSFIRE -band program detects the emission line at (O. Cooper et al. in preparation). Thus, we consider it as a reliable detection of Ly. The Ly properties in Table 2 are calculated based on the 2-level detection spectrum. More accurate properties of Ly for z8_32350 will be further discussed in O. Cooper et al. (in preparation).
The measured Ly line flux of z8_69492 from our MOSFIRE observations, erg s-1 cm-2, is greater than the previously reported line fluxes by 2 uncertainties: erg s-1 cm-2 in Roberts-Borsani et al. 2016 and erg s-1 cm-2 in Stark et al. 2017. Such a large variation of the measured line fluxes in MOSFIRE observations was noticed already in the two previous studies, Roberts-Borsani et al. 2016 and Stark et al. 2017, and it could represent actual differences of spatially-extended Ly emission (Wisotzki et al. 2016; Leclercq et al. 2017; Song et al. 2020; Kusakabe et al. 2022; Bunker et al. 2023) depending on slit position in observations (Smith et al. 2019). The Ly line flux from NIRSpec observations is also significantly smaller than what we measure from the MOSFIRE observations (), and this also may be partially due to significant slit loss of extended Ly in NIRSpec observations. Additionally, such differences could become more significant in the high spatial resolution of NIRSpec observations while we treat our sources as point-like, but then some of the sources are spatially resolved with the NIRspec point-spread functions. Similarly, Larson et al. 2023 find a significantly smaller Ly flux in NIRSpec ( 7 fainter) compared to the MOSFIRE observation. We will further discuss more detailed comparison between NIRSpec and MOSFIRE Ly spectra in Section 4.2.
III.3 Galaxy Properties from SED fitting
We obtain the stellar population properties from galaxy spectral energy distribution (SED) fitting presented in Jung et al. 2022b, which use the CANDELS EGS photometric catalog from Finkelstein et al. 2022c. Briefly, the photometric catalog includes six bands of HST ACS and WFC3 broadband photometry (, , , , and ) as well as Spitzer/IRAC 3.6m and 4.5m band photometry. Unfortunately, these LAE sources do not have NIRCam observations being outside the CEERS NIRCam fields. First, galaxy SED models are constructed based on the Bruzual & Charlot 2003 stellar population synthesis model with the Salpeter 1955 initial mass function and the Calzetti 2001 dust attenuation description. Then, nebular emission lines are added to model SEDs based on the Inoue 2011 emission-line ratio, and the IGM attenuation is applied according to Madau 1995. Finally, galaxy physical properties such as stellar mass, absolute UV magnitude, dust attenuation, and star formation rate, are obtained from fitting the broadband photometry of HST and Spitzer to the model SEDs. More detailed description of SED fitting is provided in Jung et al. 2022b. The SED-derived physical properties of our sources are listed in Table 2.
bBased on the Balmer decrement of H/H.
c, where the line-emission coefficient () is 4.8610-13 erg for case B recombination, assuming . Dust correction for H is done based on the SED-derived E(B-V). Also, we add a systematic error of 40% of the H line flux to consider the uncertainties of flux calibration based on the JWST pipeline’s path-loss correction (Fujimoto et al. 2023).
dIonization parameter estimated from the relation between O32 and the ionization parameter given in Papovich et al. 2022.
eBased on a comparison between the Ly redshift from the MOSFIRE observations and the systemic redshift from the NIRSpec prism observations. We caution that the NIRSpec wavelength calibration uncertainty could be up to 1 pixel in spectral elements, which corresponds km s-1 in prism spectra. Thus, additional high spectral resolution spectra are required to confirm the derived velocity offset.
fLy escape fraction. The intrinsic Ly is estimated from H, assuming the intrinsic emission-line ratios of Ly/H = 8.7 and H/H=2.86. The observed Ly fluxes are taken from the MOSFIRE observations.
| Source ID | z8_13573 | z8_32350 | z8_69492 |
|---|---|---|---|
| MPT ID | 686 | 689 | 698 |
| R.A. (J2000.0) | 215.15088 | 214.99903 | 215.05033 |
| Decl. (J2000.0) | 52.98957 | 52.94197 | 53.00745 |
| SED-fitting-derived Properties | |||
| [ M⊙] | |||
| SFR | 57 | ||
| Emission-Line Properties | |||
| FWHM [km s-1]a | - | ||
| O3 (=[O iii]5007/H) | |||
| O32 (=([O iii]4959+[O iii]5007)/[O ii]3727,29) | - | ||
| RO3 (=[O iii]4363/([O iii]4959+[O iii]5007)) | - | ||
| R23 (=([O ii]3727,29+[O iii]4959+[O iii]5007)/H) | - | ||
| Ne3O2 (=Ne iii3870/[O ii]3727,29) | - | ||
| [O iii]5007/[O iii]4959 | |||
| H/H | - | ||
| b | - | ||
| log(/Hz erg-1)c | |||
| log(/K) | - | ||
| 12+log(O/H) | - | ||
| - | |||
| logd | - | ||
| Ly-Emission Properties | |||
| - | - | ||
| [km s-1] | - | - | |
| f [ erg s-1 cm-2] | - | - | |
| [km s-1] | e | ||
| f [ erg s-1 cm-2] | |||
| EW [Å] | |||
| ff | |||
IV Results and Discussions
IV.1 ISM Properties
With the detected emission lines from MR grating spectra of z8_32350 and z8_69492, we estimate the line ratios22 2 The emission-line diagnotics are defined in Table 2. (O3, O32, RO3, R23, Ne3O2, [O iii]5007/[O iii]4959, and H/H) as proxies for the ionization state, electron temperature, metal enrichment of the ISM, and dust attenuation, respectively. The measured line ratios are listed in Table 2. Emission-line ratios are corrected for dust attenuation based on values. We separately derive from the Balmer decrement of H/H. However, the measurement uncertainties are large, thus we do not use for dust correction. Instead, we assume the same dust attenuation between the nebular gas and the stellar populations. Overall, the line ratio diagnostics indicate low metallicities and high ionization parameters in the ISM of the two sources. This is in general consistent with the recent findings of reionization-era galaxies from JWST observations (Trump et al. 2022; Taylor et al. 2022; Curti et al. 2023; Katz et al. 2023; Sanders et al. 2023b; Tang et al. 2023; Bunker et al. 2023; Saxena et al. 2023) as well as theoretical predictions on high-redshift galaxies (e.g., a high O3 predicted in Hirschmann et al. 2022, as a consequnce of both low metallicity and high ionization). We note that emission-line diagnostics of these sources are also provided in Tang et al. 2023, and our measurements mostly agree with their measurements within the uncertainties.
IV.1.1 Ionization State
O32 is an ionization parameter diagnostic as it represents the relative abundance between double-ionized oxygen to singly ionized oxygen (Strom et al. 2018; Kewley et al. 2019; Papovich et al. 2022). It is also sensitive to metallicity as well for metal-rich gas (12+log(O/H) 9.0) (Kewley & Dopita 2002), but it is not the case in our high-redshift low-metallicity galaxies with 12+log(O/H) 8.0. Recent JWST observations find O32 values roughly from 5 to 20 from reionization-era galaxies (Curti et al. 2023; Rhoads et al. 2023; Tang et al. 2023; Larson et al. 2023; Sanders et al. 2023a; Mascia et al. 2023), that are higher than those found in low-redshift galaxies where such high O32 ratios are mostly associated with extreme [OIII] emitters (Tang et al. 2019) and/or those with high ionization parameter and low metallicity (Strom et al. 2018; Papovich et al. 2022; Reddy et al. 2023).
We measure O32 from two sources observed in MR grating as listed in Table 2: and for z8_32350 and z8_69492, respectively. The measured O32 ratios from our sources are also high, comparable to the range of O32 found in recent JWST studies. Particularly, z8_69492 shows a very high O32 ratio of 20, suggesting an extreme ionization condition in the ISM. We derive the ionization parameters (q [cm s-1]) using the relation between O32 and the ionization parameters given in Papovich et al. 2022. The relation is obtained by modeling emission-line properties of the CLEAR survey galaxies (Simons et al. 2023) with the MAPPINGS V photoionization models (Kewley et al. 2019). The derived dimensionless ionization parameters () are (z8_32350) and (z8_69492), listed in Table 2. These values correspond to the high end of the ionization parameters measured from lower-redshift galaxies at (Strom et al. 2018; Papovich et al. 2022; Reddy et al. 2023, e.g,) and consistent with the measurements of reionization-era galaxies at (Tang et al. 2023). In fact, high values of O32 can be linked with potential LyC leakers (Izotov et al. 2018; Plat et al. 2019; Chisholm et al. 2022; Flury et al. 2022a), and we will explore possible extreme inflation of an ionized bubble with the extreme LyC escape fraction in Section 4.4.
From the MR grating spectra of the two sources, we measure Ne3O2 ratios as well. Ne3O2 is also an effective ionization diagnostic (Trouille et al. 2011; Zeimann et al. 2015, e.g.,). Trump et al. 2022 examine the SMACS ERO galaxies in the “OHNO” line-ratio diagram of O3 vs. Ne3O2 (Backhaus et al. 2022), finding that the galaxies present higher Ne3O2 ratios compared to the low-redshift galaxies with similar O3 ratios (Trump et al. 2022, see Figure 4 in). Our LAEs are found in the same regions to the SMACS galaxies in the OHNO diagram, requiring higher ionization and metal-poor condition within the ISM.
IV.1.2 Electron Temperature and Metallicity
We also detect [O iii]4363 auroral lines in the MR grating spectra of z8_32350 and z8_69492. The relative populations of two different collisionally-excited levels are sensitive to the gas electron temperature (), and the ratio of [O iii]4363 to [O iii]4959+[O iii]5007 (RO3) can be used to calculate the electron temperature in the O2+ zone, . Also, the electron temperature can be used to estimate the -based metallicities based on the empirical correlations between and metallicity (Amorín et al. 2015; Pérez-Montero et al. 2021, e.g.,). We follow Trump et al. 2022 to derive of the ISM and the -based oxygen abundance, using Eq. (4) of Nicholls et al. 2020 and Eq. (1) of Pérez-Montero et al. 2021. The derived values of and the oxygen abundance are listed in Table 2. The measured oxygen abundances indicate low metallicity: and for z8_32350 and z8_69492, respectively (Asplund et al. 2021, the solar oxygen abundance is 8.69 from). These two galaxies are UV luminous () and massive (log for z8_32350 and for z8_69492), but showing low oxygen abundances (12+log(O/H)8). They fall far below the mass-metallicity relation from low-redshift galaxies at (Henry et al. 2021; Sanders et al. 2021; Papovich et al. 2022, e.g.,) as seen in other galaxies (Fujimoto et al. 2023).

IV.2 Ly Velocity Offset
We measure the Ly velocity offsets using the Ly redshifts obtained from the MOSFIRE spectra (and in the NIRSpec spectra for z8_69492), compared to the systemic redshifts obtained from the strong H and [O iii] emission lines in the NIRSpec spectra. Due to the low spectral resolution of NIRSpec/PRISM spectra ( near Ly), we are unable to draw a reliable measurement of a Ly redshift for z8_13573 from NIRSpec observations. Also, no Ly is seen for z8_32350 in the NIRSpec observations. Thus we measure the Ly velocity offset from NIRSpec observations only for z8_69492.
The derived Ly velocity offsets () are listed at the bottom in Table 2. Based on the MOSFIRE spectra, the two luminous galaxies (z8_32350 and z8_69492) show the Ly velocity offsets of km s-1 and km s-1, respectively. These are comparable to the measurements of the Ly velocity offsets in literature in a range of 110 – 340 km s-1 from galaxies with (see Table 4 in Endsley et al. 2022, and the references therein). Notably, we find the blueshifted Ly in z8_13573. If that is true, this could be a sign of a sufficiently large (1pMpc) ionized bubble and low residual neutral fraction in ionized regions around the galaxy (Mason & Gronke 2020; Park et al. 2021; Smith et al. 2021). However, the Ly velocity offset () of z8_13573 is based on a comparison of the Ly redshift from MOSFIRE to the systemic redshift from the prism observations. The NIRSpec wavelength correction step may introduce the wavelength uncertainties up to 1pixel in spectral elements, which corresponds km s-1 in prism spectra. Thus, additional high spectral resolution observations are necessary to confirm the derived velocity offset.
With the Ly spectra for z8_69492 of both NIRSpec and MOSFIRE MR observations, we notice disagreement in the Ly spectra between NIRSpec and MOSFIRE. We present the NIRSpec and MOSFIRE spectra of z8_69492 together in Figure 5 for a detailed comparison. The MOSFIRE 1D fluxes are shown as the thin black histogram. For a fair comparison to the NIRSpec spectrum (red), we degrade the MOSFIRE spectra to match the NIRSpec spectral resolution, shown as the thick black histogram. The vertical dashed line represents the systemic wavelength of Ly. The main discrepancies are in the total line fluxes and the line profiles. We see a 5 greater flux in MOSFIRE (see Table 2). The discrepancy in the total line fluxes may indicate significant slit-loss in NIRSpec observations that is not well corrected with a point-like source assumption for this galaxy. We also find that the NIRSpec spectrum miss Ly near the systemic wavelength. It is clear that the peak of Ly is more redshifted from the systemic wavelength in NIRSpec than in MOSFIRE. As the NIRSpec slitlet covers a partial area of the central region in the rest-UV image (Figure 3), it may lose the Ly from its outskirt, resulting in the discrepancies that we discussed. Such difference in the line profile may indicate that a spatially-varying Ly, which experienced complex Ly radiative processes in ISM and circumgalactic medium (CGM) environments (Verhamme et al. 2018; Kakiichi & Dijkstra 2018; Song et al. 2020; Park et al. 2022).
However, as discussed above the NIRSpec wavelength correction could introduce uncertainties in the wavelength calibration within 1pixel of the spectral elements, corresponding 6Å near Ly (200 km s-1) in NIRSpec MR grating spectra. Thus, improper wavelength correction may introduce the discrepancies to some degree that we find in velocity offsets. High spectral resolution NIRSpec observations would be needed to carry out further analysis providing an accurate measurement of the Ly velocity offset.

IV.3 Spatially-Extended Ly
Spatially-resolved emission-line analyses of Ly at – often show Ly halos that are spatially more extended than the UV continuum of galaxies (Wisotzki et al. 2016; Leclercq et al. 2017; Kusakabe et al. 2022). A remarkable discovery of Ly from a 10 galaxy in Bunker et al. 2023 also shows spatially-extended Ly. Such extended Ly halos may represent Ly scattering through the outflowing CGM (Kakiichi & Dijkstra 2018; Leclercq et al. 2020; Song et al. 2020, e.g.,) although there are several other physical mechanisms suggested such as Ly fluorescence (Furlanetto & Oh 2005; Cantalupo et al. 2005; Kollmeier et al. 2010) and gravitational cooling (Dijkstra et al. 2006; Trebitsch et al. 2016).
We examine the spatial extent of emission lines of our sources whose Ly seen in the NIRSpec data. Figure 6 presents the spatial profiles of Ly as well as the other prominent non-resonant emission lines (e.g., H and/or [O iii]). In the plots, the dashed curves trace the spatial profiles of point-like sources while the red curves are observed spatial profiles of detected emission lines. Notably, z8_69492 features a significantly more extended Ly ( kpc) than its non-resonant emission lines (1.2 kpc). We also find a tentative feature of an extended Ly from z8_13573, which is marginally resolved being larger than the size of PSF. Whereas other emission lines are unresolved in our observations. Such spatially extended Ly found in our NIRSpec observations in addition to the recent discovery of Bunker et al. 2023 may suggest a common nature of Ly halos in the high-redshift universe.
IV.4 Ionized Bubbles for the Escape of Ly
IV.4.1 Ionized Bubble Sizes
In this section, we consider the possible characteristics of the ionized bubbles around these LAEs. Following Endsley et al. 2021 and Larson et al. 2022, we calculate the radius of the Strömgren spheres (Cen & Haiman 2000) as:
| (1) |
where is the rate of intrinsic ionizing emissivity () in units of s-1, is the LyC photon escape fraction, and is a star formation episode time. represents the proper volume density of neutral hydrogen given as:
| (2) |
where is the primordial helium abundance by mass, is the critical density, is the baryon density fraction.
We derive ionizing photon production efficiency () from H emission lines following Matthee et al. 2022. First, we take the H fluxes corrected for dust attenuation and calculate , where the line-emission coefficient () is 4.8610-13 erg for case B recombination. Dust attenuation for H is corrected based on the SED-derived . The estimated values of , assuming =0, are listed in Table 2. The quoted uncertainties in the table include an additional 40% to account for systematic errors in the flux calibration propagating into the H flux estimates (Fujimoto et al. 2023). The mean value of log(/Hz erg-1) is , generally consistent with the measurements of from high-redshift () galaxies (Endsley et al. 2021; Matthee et al. 2022; Fujimoto et al. 2023; Tang et al. 2023; Bunker et al. 2023).
It is challenging to gauge the actual supplies of ionizing (or LyC) photons from galaxies mainly due to the unknown LyC escape fraction (). We calculate the predicted sizes of ionized bubbles around the three sources as a function of star formation episode time at different values of [0.1, 0.3, 0.5, 0.7] as shown in Figure 7. The gray horizontal line on top in each panel marks a characteristic bubble size for escape of Ly ( 1pMpc) where Ly transmission in the IGM () could be 40% for redshifted Ly of km s-1 (Mason & Gronke 2020, refer to Figure 1 in ). The ionized bubbles mostly could not grow to pMpc in a reasonable time scale (50Myr) – if powered by the observed sources alone – except for the extreme case of . We calculate the maximum allowable star formation episode periods (denoted as the vertical dashed lines in Figure 7) for reaching the current stellar masses of these galaxies by assuming constant star formation histories. That limits the growths of ionized bubbles within even shorter timescales for z8_32350 and z8_69492. The limit on the star formation episode time for z8_13573 is longer than 50Myr (120Myr).
Although z8_32350 and z8_69492 are very bright in UV with , our predicted sizes of ionized bubbles suggest that they are not capable of forming ionized regions large enough for the escape of Ly even with a moderately-high LyC escape of within the allowed time scales of star formation episodes. Thus, the escape of Ly at this redshift may require additional ionizing sources to create such large bubbles via local overdensities of galaxies (Castellano et al. 2018; Tilvi et al. 2020; Endsley et al. 2021; Larson et al. 2022; Jung et al. 2022b; Tacchella et al. 2023; Saxena et al. 2023, e.g.,) or an extremely high in their ISM. Without an external ionized source or an high- ISM condition, Ly could be heavily suppressed.


IV.4.2 Channels for Escape of Ly
Our calculations on the size growth of ionized bubbles in the previous section suggest that the detections of strong Ly may requires either additional ionizing sources to expand the bubble size further or an extremely high escape fraction of LyC photons () in a UV luminous galaxy. In this section, we discuss the possible explanations of individual cases of our LAEs.
First, we derive predicted LyC escape fraction of our sources. While the direct measurement of the LyC escape fraction is unavailable during the reionization era due to the IGM attenuation, it can be indirectly inferred via the proxies for the LyC escape that have been explored using low-redshift LyC sources (Izotov et al. 2016; Wang et al. 2019; Flury et al. 2022b, e.g.,). Indirect indicators of LyC escape include the escape of Ly (Dijkstra et al. 2016; Verhamme et al. 2017; Izotov et al. 2020; Pahl et al. 2021; Kimm et al. 2022), [Mg ii]2796,2803 (Chisholm et al. 2020), the rest-UV continuum slope (Chisholm et al. 2022), and the O32 line ratio (Izotov et al. 2018; Chisholm et al. 2018). More recently, Flury et al. 2022a perform a statistical test of various diagnostics with the LyC measurements from the Low-redshift Lyman Continuum Survey (Flury et al. 2022b, LzLCS;), and Mascia et al. 2023 provide prediction on for reionization-era galaxies from their relation (M23 relation, hereafter) based on O32, the rest-UV continuum slope, and the size of galaxy.
Among the indirect indicators, we focus on the O32 – relation first, motivated by the high O32 ratios of our sources. We derive the LyC escape fraction based on O32 () for the two NIRSpec MR targets (z8_32350 and z8_69492), following the O32 – relation provided in Chisholm et al. 2018. We obtain for z8_32350 and for z8_69492. The red curves in the middle and right panels in Figure 7 represent the size evolution of ionized bubbles based on .
In the right panel (z8_69492), based on its high , z8_69492 could form a sizable ionized region (1pMpc) within 30 – 40 Myr of star formation episode time. This suggests possible self-driven formation of an ionized bubble around this bright galaxy that allows the escape of Ly through the IGM although the allowable star formation episode time limits the bubble growth quite earlier than that (by 20Myr). The inferred high for z8_69492 suggests a somewhat extreme case of LyC leakage that is rarely expected from such bright galaxy. However, Flury et al. 2022a show that galaxies with O32 form a high ( 0.2) group (see their Figure 7). Additionally, a multivariate predictor of developed via a survival analysis technique using the LzLCS galaxies suggests for z8_69492 (A. Jaskot et al. in preparation). Thus, the high O32-inferred of z8_69492 can be a reliable measurement.
However, the current diagnostics of LyC escape in general show large scatters in their empirical relations and need to be further tested. Specifically, a high O32 could be necessary for a high , but not sufficient condition (Flury et al. 2022a; Mascia et al. 2023), which drives the high- nature of z8_69492 still questionable. Indeed, the rest-UV continuum slope of z8_69492 () suggests a much lower at based on the relation given in Chisholm et al. 2022. Reconciling both predictions of and , the M23 relation given in Mascia et al. 2023 provides the LyC escape fractions of for z8_69492 although the M23 relation could underestimate at high values of . The predicted size growths of ionized bubbles based on are shown with blue curves in the figure. With this moderately-high value, z8_69492 may not be fully responsible for creating a 1pMpc-sized ionized bubble. Thus, if this is the case, the escape of Ly from this source is likely to require additional sources of ionizing photons. In fact, Leonova et al. 2022 suggest a galaxy overdensity around z8_69492 with four additional high-redshift candidate galaxies although they lack spectroscopic confirmations yet.
With contradictory predictions on for z8_69492 based on various relations of indirect indicators, it is difficult to draw definitive conclusion on whether or not the galaxy can supply ionizing photons sufficient for creating a 1pMpc-sized ionized bubble. However, the metal-poor and high-ionization ISM condition in this galaxy suggests a significant LyC leakage as same as inferred from various indirect indicators. Thus the ionizing photon contribution form this galaxy may be enough to dominate the ionizing photon budget for reionizing the IGM around the galaxy even while requiring additional ionizing photon supplies from nearby companion galaxies.
For z8_32350, it does not show a particularly enhanced O32 (), suggesting a moderate ionization state comparable to normal star-forming galaxies at this redshift. We derive at a 10% level and the M23 relation provides a similar prediction. Thus, the galaxy with the inferred is certainly not capable of creating a sizable ionized bubble alone, again requiring additional ionizing sources for escape of Ly in order to form a sufficiently large ionized bubble. z8_32350 is found within pMpc from z8_69492 (Tang et al. 2023). However, they are unlikely to form a contagious ionized region in given relatively large separation (as discussed in Section 4.4.1), and there is no obvious galaxy overdensity around z8_32350 known so far. In that aspect, the escape of Ly from this galaxy is somewhat puzzling. However, we recall that there is a potential close companion galaxy (Figure 2) although it requires a further spectroscopic confirmation. Recently, Witten et al. 2023 suggest an intriguing explanation on escape of Ly with frequent galaxy mergers, finding that all reionization-era-LAE sample in their study have close companions. Thus, the Ly escape from z8_32350 could be explained in that way with an episodic increase of Ly escape through an interaction with a nearby companion. We note that the Ly properties of z8_32350 presented in this work possess large uncertainties, and a more detailed Ly properties for this source will be updated in O. Cooper et al. (in preparation).
z8_13573 is relatively UV-faint (), thus the expected supply of ionizing photons from this source could be less than those of z8_32350 and z8_69492. We could not test if a high escape fraction of LyC is suggested from O32 as [O ii] is not covered in its prism spectra. Instead, we measure the UV continuum slope at the rest-frame 1300–1800Å () from the continuum spectra seen in prism observations, and derive the -based LyC escape fraction at its 1 upper limit based on the relation given in Chisholm et al. 2022. This is certainly insufficient to create a large ionized bubble. However, it emits Ly comparable to those of z8_32350 and z8_69492. One possible explanation of such high-EW Ly from z8_13573 is the overlap of multiple ionized bubbles, being situated in a galaxy overdensity. Particularly, z8_13573 is found in a local overdensity of LAEs having multiple LAEs within 2 pMpc radius (Tilvi et al. 2020; Jung et al. 2022b). Also, Jung et al. 2022b discuss the enhanced IGM transmission of Ly from this galaxy by a foreground luminous galaxy. Thus, this source is prone to be located in an extended ionized region that is much larger than what can be created by this single galaxy alone.
V Summary and Conclusion
We present our analysis of the CEERS NIRSpec observations for three Ly-emitting galaxies at . The NIRSpec targets were selected as spectroscopically-confirmed LAEs from ground-based observations using the MOSFIRE spectrograph on the Keck telescope. We analyze the emission-line properties and disagnositics of the line ratios as well as the detailed properties of Ly such as the velocity offset and spatial extention of Ly. We also calculate the expected size growth of ionized bubbles around the LAEs based on their inferred LyC escape fractions. Our findings are summarized as follows.
- 1.
We analyze the ISM properties based on the nebular emission-line diagnostics and find that the LAEs are metal-poor and have high ionization condition in the ISM, consistent with recent findings of JWST/NIRSpec observations of reionization-era galaxies.
- 2.
We notice a difference in the spectral line profiles of Ly between NIRSpec and MOSFIRE observations, which is indicative of spatially-varying properties of Ly due to the complex Ly radiative processes in the ISM and CGM, although high spectral resolution spectra with NIRSpec are required to perform a more detailed analysis of Ly.
- 3.
Our NIRspec observations for z8_69492 present Ly spatially more extended than non-resonant emission lines, revealing the Ly halo around this galaxy.
- 4.
Based on the measured emission-line properties, we compute the expected size growth of self-driven ionized bubbles around the LAEs. Our calculations suggest that escape of strong Ly requires additional ionizing sources in general while a UV luminous galaxy with an extremely high LyC escape fraction could inflate an ionized region to be large enough (1pMpc) for escape of Ly.
In conclusion, we reveal a complex nature of Ly radiative processes from a detailed comparison of Ly spectra between NIRSpec and MOSFIRE observations. Also, we find a clue to a common nature of extended Ly halos around these galaxies, possibly responsible for a significant slit loss of Ly in NIRSpec observations. Our findings necessitate high spectral resolution observations with a meticulous treatment on spatial variations to understand the propagation of Ly photons in the era of reionization.
Our predictions on the size growth of self-driven ionized bubbles around the LAEs suggest diverse scenarios on escape of Ly during the epoch of reionization. In general, it is not feasible to create a sufficiently large ionized bubble (1pMpc) for allowing escape of Ly even for a UV-luminous galaxy () with a moderate ISM condition. Thus, the escape of strong Ly may require additional ionizing sources from a local overdensity of galaxies around LAEs.
z8_13573 is relatively faint in UV compared to other two LAEs, and its contribution on ionizing photons is certainly insufficient to explain its strong Ly. However, the known galaxy overdensity at (Tilvi et al. 2020; Jung et al. 2022b) that z8_13573 is associated with could form a contagious and extended ionized region that is sufficiently large enough for the escape of Ly from this galaxy. This is showcasing how Ly from relatively faint galaxies can escape the IGM being associated with other luminous companion galaxies. z8_69492 is also suggested to be centered at a local overdensity with its fainter companions (Leonova et al. 2022). However, unlikely z8_13573, z8_69492 may dominate the ionizing photon budget as the brightest galaxy among its fellow galaxies. z8_32350 does not appear to be capable of creating a large bubble, neither does the galaxy have a local overdensity known yet. However, it has a potential close companion galaxy in its vicinity (as marked in Figure 2), thus the detection of Ly from this galaxy is possibly explained with an episodic increase of Ly escape through galaxy mergers (Witten et al. 2023).
As an alternative, we highlight an outstanding scenario of a bright galaxy with the case of an extreme ISM condition of a high LyC escape fraction creating a self-driven ionized bubble large enough for escape of Ly. It is suggested for z8_69492 if the galaxy has an extremely high as inferred from its high O32 ratio.
Our findings in this detailed case study of the LAEs during the epoch of reionization call for a further statistical analysis in future for a comprehensive understanding on escape of Ly and dominant sources of ionizing photons (i.e. bright vs. faint galaxies) that are responsible for creating ionized bubbles in the neutral IGM.
References
- Amorín et al. (2015) Amorín, R., Pérez-Montero, E., Contini, T., et al. 2015, A&A, 578, A105, doi: 10.1051/0004-6361/201322786
- Asplund et al. (2021) Asplund, M., Amarsi, A. M., & Grevesse, N. 2021, A&A, 653, A141, doi: 10.1051/0004-6361/202140445
- Backhaus et al. (2022) Backhaus, B. E., Trump, J. R., Cleri, N. J., et al. 2022, ApJ, 926, 161, doi: 10.3847/1538-4357/ac3919
- Böker et al. (2023) Böker, T., Beck, T. L., Birkmann, S. M., et al. 2023, arXiv e-prints, arXiv:2301.13766. https://arxiv.org/abs/2301.13766
- Bolan et al. (2022) Bolan, P., Lemaux, B. C., Mason, C., et al. 2022, MNRAS, 517, 3263, doi: 10.1093/mnras/stac1963
- Bruzual & Charlot (2003) Bruzual, G., & Charlot, S. 2003, MNRAS, 344, 1000, doi: 10.1046/j.1365-8711.2003.06897.x
- Bunker et al. (2023) Bunker, A. J., Saxena, A., Cameron, A. J., et al. 2023, arXiv e-prints, arXiv:2302.07256, doi: 10.48550/arXiv.2302.07256
- Calzetti (2001) Calzetti, D. 2001, New Astron., 45, 601, doi: 10.1016/S1387-6473(01)00144-0
- Cantalupo et al. (2005) Cantalupo, S., Porciani, C., Lilly, S. J., & Miniati, F. 2005, ApJ, 628, 61, doi: 10.1086/430758
- Castellano et al. (2018) Castellano, M., Pentericci, L., Vanzella, E., et al. 2018, ApJ, 863, L3, doi: 10.3847/2041-8213/aad59b
- Cen & Haiman (2000) Cen, R., & Haiman, Z. 2000, ApJ, 542, L75, doi: 10.1086/312937
- Chisholm et al. (2020) Chisholm, J., Prochaska, J. X., Schaerer, D., Gazagnes, S., & Henry, A. 2020, MNRAS, 498, 2554, doi: 10.1093/mnras/staa2470
- Chisholm et al. (2018) Chisholm, J., Gazagnes, S., Schaerer, D., et al. 2018, A&A, 616, A30, doi: 10.1051/0004-6361/201832758
- Chisholm et al. (2022) Chisholm, J., Saldana-Lopez, A., Flury, S., et al. 2022, MNRAS, 517, 5104, doi: 10.1093/mnras/stac2874
- Curti et al. (2023) Curti, M., D’Eugenio, F., Carniani, S., et al. 2023, MNRAS, 518, 425, doi: 10.1093/mnras/stac2737
- Dijkstra et al. (2016) Dijkstra, M., Gronke, M., & Venkatesan, A. 2016, ApJ, 828, 71, doi: 10.3847/0004-637X/828/2/71
- Dijkstra et al. (2006) Dijkstra, M., Haiman, Z., & Spaans, M. 2006, ApJ, 649, 37, doi: 10.1086/506244
- Dijkstra et al. (2014) Dijkstra, M., Wyithe, S., Haiman, Z., Mesinger, A., & Pentericci, L. 2014, MNRAS, 440, 3309, doi: 10.1093/mnras/stu531
- Endsley & Stark (2022) Endsley, R., & Stark, D. P. 2022, MNRAS, 511, 6042, doi: 10.1093/mnras/stac524
- Endsley et al. (2021) Endsley, R., Stark, D. P., Chevallard, J., & Charlot, S. 2021, MNRAS, 500, 5229, doi: 10.1093/mnras/staa3370
- Endsley et al. (2022) Endsley, R., Stark, D. P., Bouwens, R. J., et al. 2022, MNRAS, 517, 5642, doi: 10.1093/mnras/stac3064
- Ferruit et al. (2022) Ferruit, P., Jakobsen, P., Giardino, G., et al. 2022, A&A, 661, A81, doi: 10.1051/0004-6361/202142673
- Finkelstein et al. (2019a) Finkelstein, S., Bradac, M., Casey, C., et al. 2019a, BAAS, 51, 221. https://arxiv.org/abs/1903.04518
- Finkelstein et al. (2013) Finkelstein, S. L., Papovich, C., Dickinson, M., et al. 2013, Nature, 502, 524, doi: 10.1038/nature12657
- Finkelstein et al. (2019b) Finkelstein, S. L., D’Aloisio, A., Paardekooper, J.-P., et al. 2019b, ApJ, 879, 36, doi: 10.3847/1538-4357/ab1ea8
- Finkelstein et al. (2022a) Finkelstein, S. L., Bagley, M. B., Haro, P. A., et al. 2022a, ApJ, 940, L55, doi: 10.3847/2041-8213/ac966e
- Finkelstein et al. (2022b) Finkelstein, S. L., Bagley, M. B., Ferguson, H. C., et al. 2022b, arXiv e-prints, arXiv:2211.05792, doi: 10.48550/arXiv.2211.05792
- Finkelstein et al. (2022c) Finkelstein, S. L., Bagley, M., Song, M., et al. 2022c, ApJ, 928, 52, doi: 10.3847/1538-4357/ac3aed
- Flury et al. (2022a) Flury, S. R., Jaskot, A. E., Ferguson, H. C., et al. 2022a, ApJ, 930, 126, doi: 10.3847/1538-4357/ac61e4
- Flury et al. (2022b) —. 2022b, ApJS, 260, 1, doi: 10.3847/1538-4365/ac5331
- Fujimoto et al. (2023) Fujimoto, S., Arrabal Haro, P., Dickinson, M., et al. 2023, arXiv e-prints, arXiv:2301.09482. https://arxiv.org/abs/2301.09482
- Furlanetto & Oh (2005) Furlanetto, S. R., & Oh, S. P. 2005, MNRAS, 363, 1031, doi: 10.1111/j.1365-2966.2005.09505.x
- Grogin et al. (2011) Grogin, N. A., Kocevski, D. D., Faber, S. M., et al. 2011, ApJS, 197, 35, doi: 10.1088/0067-0049/197/2/35
- Hayes & Scarlata (2023) Hayes, M. J., & Scarlata, C. 2023, arXiv e-prints, arXiv:2303.03160, doi: 10.48550/arXiv.2303.03160
- Henry et al. (2021) Henry, A., Rafelski, M., Sunnquist, B., et al. 2021, ApJ, 919, 143, doi: 10.3847/1538-4357/ac1105
- Hirschmann et al. (2022) Hirschmann, M., Charlot, S., Feltre, A., et al. 2022, arXiv e-prints, arXiv:2212.02522, doi: 10.48550/arXiv.2212.02522
- Hoag et al. (2019) Hoag, A., Bradač, M., Huang, K., et al. 2019, ApJ, 878, 12, doi: 10.3847/1538-4357/ab1de7
- Hu et al. (2021) Hu, W., Wang, J., Infante, L., et al. 2021, Nature Astronomy, doi: 10.1038/s41550-021-01322-2
- Iliev et al. (2006) Iliev, I. T., Mellema, G., Pen, U. L., et al. 2006, MNRAS, 369, 1625, doi: 10.1111/j.1365-2966.2006.10502.x
- Inoue (2011) Inoue, A. K. 2011, MNRAS, 415, 2920, doi: 10.1111/j.1365-2966.2011.18906.x
- Izotov et al. (2016) Izotov, Y. I., Schaerer, D., Thuan, T. X., et al. 2016, MNRAS, 461, 3683, doi: 10.1093/mnras/stw1205
- Izotov et al. (2020) Izotov, Y. I., Schaerer, D., Worseck, G., et al. 2020, MNRAS, 491, 468, doi: 10.1093/mnras/stz3041
- Izotov et al. (2018) Izotov, Y. I., Worseck, G., Schaerer, D., et al. 2018, MNRAS, 478, 4851, doi: 10.1093/mnras/sty1378
- Jakobsen et al. (2022) Jakobsen, P., Ferruit, P., Alves de Oliveira, C., et al. 2022, A&A, 661, A80, doi: 10.1051/0004-6361/202142663
- Jung et al. (2020) Jung, I., Finkelstein, S. L., Dickinson, M., et al. 2020, ApJ, 904, 144, doi: 10.3847/1538-4357/abbd44
- Jung et al. (2022a) Jung, I., Papovich, C., Finkelstein, S. L., et al. 2022a, ApJ, 933, 87, doi: 10.3847/1538-4357/ac6fe7
- Jung et al. (2022b) Jung, I., Finkelstein, S. L., Larson, R. L., et al. 2022b, arXiv e-prints, arXiv:2212.09850, doi: 10.48550/arXiv.2212.09850
- Kakiichi & Dijkstra (2018) Kakiichi, K., & Dijkstra, M. 2018, MNRAS, 480, 5140, doi: 10.1093/mnras/sty2214
- Kannan et al. (2022) Kannan, R., Garaldi, E., Smith, A., et al. 2022, MNRAS, 511, 4005, doi: 10.1093/mnras/stab3710
- Katz et al. (2023) Katz, H., Saxena, A., Cameron, A. J., et al. 2023, MNRAS, 518, 592, doi: 10.1093/mnras/stac2657
- Kewley & Dopita (2002) Kewley, L. J., & Dopita, M. A. 2002, ApJS, 142, 35, doi: 10.1086/341326
- Kewley et al. (2019) Kewley, L. J., Nicholls, D. C., & Sutherland, R. S. 2019, ARA&A, 57, 511, doi: 10.1146/annurev-astro-081817-051832
- Kimm et al. (2022) Kimm, T., Bieri, R., Geen, S., et al. 2022, ApJS, 259, 21, doi: 10.3847/1538-4365/ac426d
- Koekemoer et al. (2011) Koekemoer, A. M., Faber, S. M., Ferguson, H. C., et al. 2011, ApJS, 197, 36, doi: 10.1088/0067-0049/197/2/36
- Kollmeier et al. (2010) Kollmeier, J. A., Zheng, Z., Davé, R., et al. 2010, ApJ, 708, 1048, doi: 10.1088/0004-637X/708/2/1048
- Kusakabe et al. (2022) Kusakabe, H., Verhamme, A., Blaizot, J., et al. 2022, A&A, 660, A44, doi: 10.1051/0004-6361/202142302
- Larson et al. (2022) Larson, R. L., Finkelstein, S. L., Hutchison, T. A., et al. 2022, arXiv e-prints, arXiv:2203.08461. https://arxiv.org/abs/2203.08461
- Larson et al. (2023) Larson, R. L., Finkelstein, S. L., Kocevski, D. D., et al. 2023, arXiv e-prints, arXiv:2303.08918, doi: 10.48550/arXiv.2303.08918
- Leclercq et al. (2017) Leclercq, F., Bacon, R., Wisotzki, L., et al. 2017, A&A, 608, A8, doi: 10.1051/0004-6361/201731480
- Leclercq et al. (2020) Leclercq, F., Bacon, R., Verhamme, A., et al. 2020, A&A, 635, A82, doi: 10.1051/0004-6361/201937339
- Leonova et al. (2022) Leonova, E., Oesch, P. A., Qin, Y., et al. 2022, MNRAS, 515, 5790, doi: 10.1093/mnras/stac1908
- Madau (1995) Madau, P. 1995, ApJ, 441, 18, doi: 10.1086/175332
- Mascia et al. (2023) Mascia, S., Pentericci, L., Calabro’, A., et al. 2023, arXiv e-prints, arXiv:2301.02816, doi: 10.48550/arXiv.2301.02816
- Mason & Gronke (2020) Mason, C. A., & Gronke, M. 2020, MNRAS, 499, 1395, doi: 10.1093/mnras/staa2910
- Mason et al. (2018) Mason, C. A., Treu, T., Dijkstra, M., et al. 2018, ApJ, 856, 2, doi: 10.3847/1538-4357/aab0a7
- Mason et al. (2019) Mason, C. A., Fontana, A., Treu, T., et al. 2019, MNRAS, 485, 3947, doi: 10.1093/mnras/stz632
- Matthee et al. (2022) Matthee, J., Mackenzie, R., Simcoe, R. A., et al. 2022, arXiv e-prints, arXiv:2211.08255, doi: 10.48550/arXiv.2211.08255
- McLean et al. (2012) McLean, I. S., Steidel, C. C., Epps, H. W., et al. 2012, in Society of Photo-Optical Instrumentation Engineers (SPIE) Conference Series, Vol. 8446, Ground-based and Airborne Instrumentation for Astronomy IV, ed. I. S. McLean, S. K. Ramsay, & H. Takami, 84460J, doi: 10.1117/12.924794
- Mesinger et al. (2011) Mesinger, A., Furlanetto, S., & Cen, R. 2011, MNRAS, 411, 955, doi: 10.1111/j.1365-2966.2010.17731.x
- Mesinger & Furlanetto (2008) Mesinger, A., & Furlanetto, S. R. 2008, MNRAS, 386, 1990, doi: 10.1111/j.1365-2966.2008.13039.x
- Miralda-Escudé & Rees (1998) Miralda-Escudé, J., & Rees, M. J. 1998, ApJ, 497, 21, doi: 10.1086/305458
- Naidu et al. (2020) Naidu, R. P., Tacchella, S., Mason, C. A., et al. 2020, ApJ, 892, 109, doi: 10.3847/1538-4357/ab7cc9
- Nicholls et al. (2020) Nicholls, D. C., Kewley, L. J., & Sutherland, R. S. 2020, PASP, 132, 033001, doi: 10.1088/1538-3873/ab6818
- Ocvirk et al. (2020) Ocvirk, P., Aubert, D., Sorce, J. G., et al. 2020, MNRAS, 496, 4087, doi: 10.1093/mnras/staa1266
- Oesch et al. (2015) Oesch, P. A., van Dokkum, P. G., Illingworth, G. D., et al. 2015, ApJ, 804, L30, doi: 10.1088/2041-8205/804/2/L30
- Oke & Gunn (1983) Oke, J. B., & Gunn, J. E. 1983, ApJ, 266, 713, doi: 10.1086/160817
- Pahl et al. (2021) Pahl, A. J., Shapley, A., Steidel, C. C., Chen, Y., & Reddy, N. A. 2021, MNRAS, 505, 2447, doi: 10.1093/mnras/stab1374
- Papovich et al. (2022) Papovich, C., Simons, R. C., Estrada-Carpenter, V., et al. 2022, ApJ, 937, 22, doi: 10.3847/1538-4357/ac8058
- Park et al. (2021) Park, H., Jung, I., Song, H., et al. 2021, arXiv e-prints, arXiv:2105.10770. https://arxiv.org/abs/2105.10770
- Park et al. (2022) Park, H., Kim, H. J., Ahn, K., et al. 2022, ApJ, 931, 126, doi: 10.3847/1538-4357/ac69e4
- Pentericci et al. (2011) Pentericci, L., Fontana, A., Vanzella, E., et al. 2011, ApJ, 743, 132, doi: 10.1088/0004-637X/743/2/132
- Pérez-Montero et al. (2021) Pérez-Montero, E., Amorín, R., Sánchez Almeida, J., et al. 2021, MNRAS, 504, 1237, doi: 10.1093/mnras/stab862
- Planck Collaboration et al. (2016) Planck Collaboration, Ade, P. A. R., Aghanim, N., et al. 2016, A&A, 594, A13, doi: 10.1051/0004-6361/201525830
- Plat et al. (2019) Plat, A., Charlot, S., Bruzual, G., et al. 2019, MNRAS, 490, 978, doi: 10.1093/mnras/stz2616
- Qin et al. (2021) Qin, Y., Wyithe, J. S. B., Oesch, P. A., et al. 2021, arXiv e-prints, arXiv:2108.03675. https://arxiv.org/abs/2108.03675
- Reddy et al. (2023) Reddy, N. A., Topping, M. W., Sanders, R. L., Shapley, A. E., & Brammer, G. 2023, arXiv e-prints, arXiv:2303.11397, doi: 10.48550/arXiv.2303.11397
- Rhoads & Malhotra (2001) Rhoads, J. E., & Malhotra, S. 2001, ApJ, 563, L5, doi: 10.1086/338477
- Rhoads et al. (2023) Rhoads, J. E., Wold, I. G. B., Harish, S., et al. 2023, ApJ, 942, L14, doi: 10.3847/2041-8213/acaaaf
- Roberts-Borsani et al. (2022) Roberts-Borsani, G., Treu, T., Mason, C., et al. 2022, arXiv e-prints, arXiv:2207.01629. https://arxiv.org/abs/2207.01629
- Roberts-Borsani et al. (2016) Roberts-Borsani, G. W., Bouwens, R. J., Oesch, P. A., et al. 2016, ApJ, 823, 143, doi: 10.3847/0004-637X/823/2/143
- Robertson et al. (2015) Robertson, B. E., Ellis, R. S., Furlanetto, S. R., & Dunlop, J. S. 2015, ApJ, 802, L19, doi: 10.1088/2041-8205/802/2/L19
- Rosdahl et al. (2018) Rosdahl, J., Katz, H., Blaizot, J., et al. 2018, MNRAS, 479, 994, doi: 10.1093/mnras/sty1655
- Rosdahl et al. (2022) Rosdahl, J., Blaizot, J., Katz, H., et al. 2022, MNRAS, 515, 2386, doi: 10.1093/mnras/stac194210.48550/arXiv.2207.03232
- Salpeter (1955) Salpeter, E. E. 1955, ApJ, 121, 161, doi: 10.1086/145971
- Sanders et al. (2023a) Sanders, R. L., Shapley, A. E., Topping, M. W., Reddy, N. A., & Brammer, G. B. 2023a, arXiv e-prints, arXiv:2301.06696, doi: 10.48550/arXiv.2301.06696
- Sanders et al. (2021) Sanders, R. L., Shapley, A. E., Jones, T., et al. 2021, ApJ, 914, 19, doi: 10.3847/1538-4357/abf4c1
- Sanders et al. (2023b) Sanders, R. L., Shapley, A. E., Clarke, L., et al. 2023b, ApJ, 943, 75, doi: 10.3847/1538-4357/aca9cc
- Saxena et al. (2023) Saxena, A., Robertson, B. E., Bunker, A. J., et al. 2023, arXiv e-prints, arXiv:2302.12805, doi: 10.48550/arXiv.2302.12805
- Simons et al. (2023) Simons, R. C., Papovich, C., Momcheva, I. G., et al. 2023, arXiv e-prints, arXiv:2303.09570, doi: 10.48550/arXiv.2303.09570
- Smith et al. (2021) Smith, A., Kannan, R., Garaldi, E., et al. 2021, arXiv e-prints, arXiv:2110.02966. https://arxiv.org/abs/2110.02966
- Smith et al. (2019) Smith, A., Ma, X., Bromm, V., et al. 2019, MNRAS, 484, 39, doi: 10.1093/mnras/sty3483
- Song et al. (2020) Song, H., Seon, K.-I., & Hwang, H. S. 2020, ApJ, 901, 41, doi: 10.3847/1538-4357/abac02
- Stark et al. (2011) Stark, D. P., Ellis, R. S., & Ouchi, M. 2011, ApJ, 728, L2, doi: 10.1088/2041-8205/728/1/L2
- Stark et al. (2017) Stark, D. P., Ellis, R. S., Charlot, S., et al. 2017, MNRAS, 464, 469, doi: 10.1093/mnras/stw2233
- Strom et al. (2018) Strom, A. L., Steidel, C. C., Rudie, G. C., Trainor, R. F., & Pettini, M. 2018, ApJ, 868, 117, doi: 10.3847/1538-4357/aae1a5
- Tacchella et al. (2023) Tacchella, S., Eisenstein, D. J., Hainline, K., et al. 2023, arXiv e-prints, arXiv:2302.07234, doi: 10.48550/arXiv.2302.07234
- Tang et al. (2019) Tang, M., Stark, D. P., Chevallard, J., & Charlot, S. 2019, MNRAS, 489, 2572, doi: 10.1093/mnras/stz2236
- Tang et al. (2023) Tang, M., Stark, D. P., Chen, Z., et al. 2023, arXiv e-prints, arXiv:2301.07072, doi: 10.48550/arXiv.2301.07072
- Taylor et al. (2022) Taylor, A. J., Barger, A. J., & Cowie, L. L. 2022, ApJ, 939, L3, doi: 10.3847/2041-8213/ac959d
- Tilvi et al. (2014) Tilvi, V., Papovich, C., Finkelstein, S. L., et al. 2014, ApJ, 794, 5, doi: 10.1088/0004-637X/794/1/5
- Tilvi et al. (2020) Tilvi, V., Malhotra, S., Rhoads, J. E., et al. 2020, ApJ, 891, L10, doi: 10.3847/2041-8213/ab75ec
- Trebitsch et al. (2016) Trebitsch, M., Verhamme, A., Blaizot, J., & Rosdahl, J. 2016, A&A, 593, A122, doi: 10.1051/0004-6361/201527024
- Trouille et al. (2011) Trouille, L., Barger, A. J., & Tremonti, C. 2011, ApJ, 742, 46, doi: 10.1088/0004-637X/742/1/46
- Trump et al. (2022) Trump, J. R., Arrabal Haro, P., Simons, R. C., et al. 2022, arXiv e-prints, arXiv:2207.12388. https://arxiv.org/abs/2207.12388
- Verhamme et al. (2017) Verhamme, A., Orlitová, I., Schaerer, D., et al. 2017, A&A, 597, A13, doi: 10.1051/0004-6361/201629264
- Verhamme et al. (2018) Verhamme, A., Garel, T., Ventou, E., et al. 2018, MNRAS, 478, L60, doi: 10.1093/mnrasl/sly058
- Wang et al. (2019) Wang, B., Heckman, T. M., Leitherer, C., et al. 2019, ApJ, 885, 57, doi: 10.3847/1538-4357/ab418f
- Wisotzki et al. (2016) Wisotzki, L., Bacon, R., Blaizot, J., et al. 2016, A&A, 587, A98, doi: 10.1051/0004-6361/201527384
- Witten et al. (2023) Witten, C., Laporte, N., Martin-Alvarez, S., et al. 2023, arXiv e-prints, arXiv:2303.16225, doi: 10.48550/arXiv.2303.16225
- Yeh et al. (2023) Yeh, J. Y. C., Smith, A., Kannan, R., et al. 2023, MNRAS, doi: 10.1093/mnras/stad210
- Yung et al. (2020a) Yung, L. Y. A., Somerville, R. S., Finkelstein, S. L., et al. 2020a, MNRAS, 496, 4574, doi: 10.1093/mnras/staa1800
- Yung et al. (2020b) Yung, L. Y. A., Somerville, R. S., Popping, G., & Finkelstein, S. L. 2020b, MNRAS, 494, 1002, doi: 10.1093/mnras/staa714
- Zeimann et al. (2015) Zeimann, G. R., Ciardullo, R., Gebhardt, H., et al. 2015, ApJ, 798, 29, doi: 10.1088/0004-637X/798/1/29
- Zitrin et al. (2015) Zitrin, A., Labbé, I., Belli, S., et al. 2015, ApJ, 810, L12, doi: 10.1088/2041-8205/810/1/L12