FIB-SEM investigation and uniaxial compression of flexible graphite
Abstract
Flexible graphite (FG) with = 1 – 1.2 g/cm3 density is employed as beam energy absorber material in the CERN’s Large Hadron Collider (LHC) beam dumping system. However, the increase of energy deposited expected for new HL-LHC (High-Luminosity LHC) design demanded for an improvement in reliability and safety of beam dumping devices, and the need for a calibrated material model suitable for high-level FE simulations has been prioritized. This work sets the basic knowledge to develop a material model for FG suitable to this aim. A review of the FG properties available in literature is first given, followed by FIB-SEM (Focused Ion Beam - Scanning Electron Microscopy) micro-structure investigation and monotonic and cyclic uniaxial compression tests. Similarities with other well-known groups of materials such as crushable foams, crumpled materials and compacted powders have been discussed. A simple 1D phenomenological model has been used to fit the experimental stress-strain curves and the accuracy of the result supports the assumptions that the graphite-like micro-structure and the crumpled meso-structure play the major role under out-of-plane uniaxial compression.
Keywords:
Flexible graphite , FIB-SEM , Uniaxial compressionIntroduction
In the Large Hadron Collider (LHC), two 6.5 TeV/c counter rotating proton beams are made to collide [1]. The LHC Beam Dump System (LBDS) is a critical section to ensure safe LHC operations [2]: this consists in a fast extraction system that directs the beams out of the LHC circular trajectory to a tangential extraction line (700 m in length) by means of a series of kicker magnets, at the end of which the Target Dump External (TDE) block is responsible for the safe absorption of the beam. The fast-pulsed dilution kickers sweep the high-energy focused beam in a pseudo-elliptical spiral path to guarantee the energy spreading over the TDE core materials. A single beam impact generates a sudden energy deposition (86 µs) in the TDE and the subsequent thermal expansion of the impacted volume in quasi-instantaneous heating conditions determines a dynamic multi-axial stress state. The related solid mechanics problem is coupled, thermal and mechanical, and a thorough knowledge of the material’s constitutive behaviour is necessary to provide reliable predictions especially under accidental scenarios. This information is of key importance for the long-term operational effectiveness and safety of the TDE, considering that, per a single operational TDE block, all previous Runs demanded more than 9000 beam dumps. As seen in Figure 1, the core of the TDE is housed in a 318LN stainless steel vessel. It consists of 6 isostatic polycrystalline graphite blocks (SGL Sigrafine® 730011 1 SGL Carbon - www.sglcarbon.com, 700 mm long with 1.73 g/cm3 nominal density and shrink fitted into a Uranus-45 vessel (length-by-diameter-by-thickness = 8500 × 722 × 12 mm3). The low-density central section is assembled with 1650 SGL Sigraflex® L20012C††footnotemark: sheets, 2 mm thick and 1.2 g/cm3 density, stacked together and supported at the ends by two SGL Sigrafine® HLM plates (80 mm thick and 1.72 g/cm3 density) fixed to the vessel by two steel snap rings.
Two titanium-alloy windows enclose the vessel that is eventually filled with nitrogen gas.
Graphite-based materials were chosen for this application because of the high performances with respect to beam absorption purposes since they are characterized by low atomic number and good thermo-mechanical performances at high temperature [3]. The temperature reached inside the core is indeed related to the impacted material density and, in this sense, the Sigraflex® section is the most exposed, also considering the energy increase expected in the forthcoming Run 3: a peak dose of 2.5 kJ/g in nominal conditions and up to 4.1 kJ/g in case of dilution failure will correspond to 1500°C and 2300°C, respectively [4].
Sigraflex® is a commercial FG obtained by uniaxial or rolling compression of expanded graphite particles without any additive binder [5]. It is porous and anisotropic with a carbon content above 98 – 99% showing some similarities with the well-known polycrystalline and pyrolytic graphite but differs in terms of micro-scale morphology and mechanical properties [6].
Its high thermal and electrical conductivity, conformability, capability of dissipating energy, chemical resistance, and low gas permeability make it effective as thermal interface material for cooling and insulation, where the low density is of crucial importance. Moreover, the resilience and viscous response given by the particular micro-structure is well-exploited in sealing and gasketing, often in sandwiched structures with stainless steel foils or in the shape of impregnated yarns [7, 8, 6, 9].
The use of Sigraflex® in the TDE core is considered as an unique application and therefore lays out of the commercial spectrum described above. For this reason, previous investigations were seldom focused on the stress-strain constitutive law and/or mechanical properties dependence on temperature or loading rate (all the available publications were gathered in [6, 10]), and scarce data as well as structural modelling proposals are available to be employed in the TDE modelling framework.
The goal of the present work is thus to gather basic knowledge about Sigraflex®, and flexible graphite in general, to understand which of the material models available in literature or in commercial FE software are best suited for the application relevant for CERN. This is done here by:
- 1.
establishing detailed material characterization method able to provide quantitative information about the Sigraflex® micro-structure,
- 2.
assessing the static out-of-plane uniaxial compression properties such as yield strength, tangent slope and inelastic strain,
- 3.
decouple the manifold nature of FG deformation mechanism under compression so to define which of the existent materials and material models most closely resembles FG behavior.
1 FG micro-structure
A summary of a general FG production process is given in Figure 2. The raw material employed is natural graphite, i.e. a purely crystalline ore material having the shape of flakes and plates whose thickness and diameter range in the order of magnitudes of 101 µm and 102 µm respectively [6]. Sulfuric and nitric acids are chosen so as to penetrate among the basal planes during the intercalation phase and rapid heating is applied to obtain the exfoliated powder. The smaller the thickness-to-diameter ratio of the flakes, the more improved is the resulting expanded volume [11]. The expanded particles are commonly referred to as "worms" due to their accordion-like shape and, thanks to their jagged profile, can be compressed together to create compacts or sheets with tailored density and thickness. Typically, compacts denser than 0.7-0.8 g/cm3 and up to 1.8 – 1.9 g/cm3 are referred to as FG whereas lower density materials are simply referred to as graphite compacts or compressed expanded graphite. It is basically impossible to obtain density higher than 1.8 – 1.9 g/cm3 due to the difficulty on applying further irreversible work of compression [12].
For the sake of clarity, the following nomenclature will be adopted throughout the text (see Figure 2):
- 1.
Natural graphite flakes: raw material made of purely crystalline graphite flakes
- 2.
Worms or exfoliated graphite: flakes after expansion
- 3.
Micro-sheets: stacks of tens of carbon basal planes. The skeletal structure of each single worm is a pile of corrugated micro-sheets
- 4.
Particles: worms intended as entities inside the compacted materials. They are flattened along the bedding plane
- 5.
Out-of-plane and in-plane directions: perpendicular and parallel to the bedding plane, respectively
- 6.
Compaction: the compression stage in the production process
A bottom-up hierarchical system can be identified at different length scales: the carbon basal planes (nm) inside the micro-sheets (µm), the micro-sheets inside the particles (10 - 100 µm) and then the interlocked particles as constitutive units of the bulk material (mm).
The uncompressed worms’ density ranges around 0.004 - 0.015 g/cm3 (porosity P 99%) [9, 13] and their morphology depends on the initial flakes’ size [14, 15] as well as production process parameters such as expansion temperature [11] and intercalant species [16]. Their final length can reach up to 100 - 300 times the initial thickness, whereas the width corresponds to the original width of the particles in the order of 100 µm.
Non-regular honeycomb-shaped cells are randomly dispersed along the worms’ body, as a result of the expansion of the intercalant species [9]. In [13], the typical sizes of the single cell (wall-to-wall) were measured by SEM imaging in 3 different densities worms (0.006 g/cm3, 0.009-0.011 g/cm3 and 0.004 g/cm3) and were found to have ellipsoidal shape with major axis ranging between 32 to 21 µm and the minor axis between 10 to 16 µm. The average aspect ratio was found to be around 0.5. Pores as large as 100 – 200 µm were also reported in the plotted distribution. In [17] through the Johnson, Koplik and Schwartz (JKS) theory it was calculated that the pore sizes decrease from 1.36 µm to 0.078 µm as the densities compacts increase from 0.0236 g/cm3 to 0.35 g/cm3. The wall thicknesses, as calculated by nitrogen adsorption and specific surface area in [9] and [18] was found to be equivalent to 48 – 68 graphene layers, i.e. approximately 16 – 22 nm. In [12] a higher estimate for the wall thickness corresponding to 30 – 60 nm is provided. From this data, the cell wall thickness-to-length ratio can be calculated as 20/20000 [nm/nm] = 10-3, which certifies the large flexibility of the material.
Conceptually, the single worm structure may be seen as that of a foam with open porosity space and cylindrical enveloping volume. The internal pore structure is the results of corrugated stacks of carbon basal planes with rough disk shapes, thickness corresponding to the cell wall thickness, average orientation perpendicular to the cylinder axis and density equal to graphite single crystal density (2.26 g/cm3 [19]). The corrugation is given by the random dispersion and expansion of the volatilized chemicals. However, the orientation of the basal planes is changed during the compaction: [20] gathered various X-ray diffraction measurements present in literature and showed that the thin constitutive micro-sheets at 1 g/cm3 have orientation in the range 9 – 15∘ with respect to the in-plane direction.
The deformation of a single worm during compaction and recovery was observed in [21] by means of synchrotron X-ray microtomography with ZnO and WC marker particles: it was concluded that worms’ bending and thickness reduction are predominant in the loading phase whereas the unloading is characterized by only particle thickness recovery. [18] indented low density compacts and deduced that the cell walls are capable of undergoing very large recoverable shear deformation due to the sliding of cell wall internal layers. However, in [17] it was found that the relative displacement of adjacent layers inside the same cell wall is relatively small and that the main contribution to the large shear deformation and the consequent material viscous behaviour is actually given by the relative displacement between adjacent walls. This is valid in low density compacts, but the resulting viscous character appears to decrease as density increases.
[22] adopted the same technique as in [21] to observe the 3D strains inside 1 g/cm3 FG during two cycles of out-of-plane compression. It was found that the so-defined deformation units (average maximum diameters equal to 100 – 150 µm) showed similar deformation fields and assumed mainly rod- and sheet-like shapes. In [23], the fracture due to in-plane tensile stress was found to propagate among the single particles or clusters of particles, defined later as structural units. It is therefore possible to assume that both structural and deformation units correspond to one or more well-interlocked particles which therefore may be considered as the key units defining the load carrying response of the material.
Furthermore [12] indicated that the cohesive forces acting between neighbouring particles are generated thanks to links created through the jagged boundaries which increase proportionally to the density of the material. The micro-sheets interlocking effectiveness depends on their initial relative misalignment which in turn depends on the quality of the exfoliation process and the initial flake size. As the compaction pressure increases, the micro-sheets alignment is more pronounced and mutual folding occurs along the boundaries so that the in-plane tensile strength of the bulk is enhanced [15, 24]. If tensile forces are applied along the in-plane direction, the recorded elastic modulus is expected to be initially controlled by flexing and un-wrinkling of carbon planes while irreversible sliding occurs when the shear forces acting between the planes reach a certain threshold [12].
The out-of-plane compression deformation was instead related to the presence of two types of regions, one with slightly oriented micro-sheets and one with highly wrinkled micro-sheets. The first type owns well-aligned basal planes, and they are responsible for the elastic contribution to the compression modulus. Non-recovered deformation and stiffer response were instead associated to the second type where the mechanical energy is spent to create wrinkles and folds.
The pore space properties were thoroughly investigated in [9] by modeling fluid flows in compacts up to 0.3 g/cm3. The JKS theory was again found to describe reasonably well the pores by assuming cylindrical shapes with equal lengths and diameters, and various parameters such as density, permeability and formation factor were related to one another by simple power laws. The pore network developed at the considered densities was described as anisotropic and tortuous whose extent was observed to increase with the density. The final porosity after compaction is the result of inter- and intra-particle porosity contributions and the bulk and particles density are linearly related: for example, when the overall bulk density reaches 1 g/cm3, the separated particles are compressed from 0.015 g/cm3 up to 1.2 – 1.8 g/cm3. In the work in [25], it was extrapolated that pores at 1 g/cm3 may have disk shape with larger faces oriented along the bedding plane.
In [11], the pore sizes and permeability of 1 g/cm3 material were investigated by mercury porosimetry and nitrogen adsorption-desorption experiments. Three different pore categories, related to their spatial scale sizes, were identified: macro-pores (80 nm), meso-pores (2-3 nm) and micro-pores (inter-crystalline cavities). Permeability analysis revealed dominant pores orientation along the bedding planes so that the gas permeability in the in-plane direction was about 2-3 times higher than the permeability value obtained in the out-of-plane direction. In [26], transport pore size distribution was investigated by nanopermporometer with hexane as filler of the porous matrix and nitrogen as the gas-carrier. Even if closed macro-pores were found on the specimens’ surfaces, no change in the permeability properties was recorded. The characteristic pore sizes were found to range between 1.5 and 6 nm.
The amount of open or closed porosity at 1 g/cm3 is yet to be clarified. Visual access to the pore network at such density is indeed made difficult by submicron scale pore sizes. While [9] found 30% closed porosity at 0.14 g/cm3 (light compacts), [12] observed that the reduction of specific surface area upon compression of 1 g/cm3 sample is not related to any creation of new closed voids. [21] inferred that the closed porosity volume fraction at 1 g/cm3, based on the rule of mixture of homogeneously distributed closed and open pores, is 8%. Furthermore, in [11], the total volume occupied by macro-pores (pore size 40 nm) in 1 g/cm3 specimens was obtained by the volume of intruded mercury at high pressure and resulted 0.51 – 0.48 cm3/g. The total volume of meso-pores (pore size 40 nm) was measured in terms of outgassed nitrogen volume for 2h at 300∘C. This was 0.03 – 0.08 cm3/g. Consequently, the total volume occupied by pores was 0.51 – 0.59 cm3/g and, equivalently, the porosity was 0.51 – 0.59 per 1 g/cm3 samples. If the theoretical porosity is taken as P = 1 - / = 0.56, where = 1 g/cm3 and = 2.26 g/cm3 is the density of crystalline graphite [19], the uncertainty of the measures precludes a good estimation, which could not anyway overcome 9%.
2 FIB-SEM investigation
2.1 Motivation
The pore sizes estimated by means of fluid flows experiments are not always straightforward to be employed in the material structural modelling and they cannot unveil properties related to the deformation micro-mechanism. Characterization through visual inspection can instead lead to a quantitative description of the micro-structure properties such as pore sizes and orientations, giving results suitable for statistical analysis and micro-mechanical modelling. SEM imaging of FG fractured sections was already reported in [20, 12, 23] but no attempt to extract quantitative properties was reported in any of the reviewed works. This is the aim of the present FIB-SEM investigation which, to the knowledge of the authors, is applied to FG for the first time. Indeed, FIB-SEM tomography is by now an established technique to obtain 3D information on different materials but the applications in carbon-based materials are still limited, especially for quantitative reconstruction purposes [27]. The accuracy of the extracted micro-structure properties relies on the capabilities of segmentation algorithms which should be capable of discerning solid phase from the pores. This can be challenging in highly porous media where shine-through artifacts and curtain effects are more likely to occur and generate ambiguities after image binarization [27, 28]. Since no data were available from previous works, the investigation was limited and optimized on a single section as well as the image processing was focused on the only bi-dimensional pore sizes.
2.2 Methods
This analysis was carried out on 1 g/cm3 Sigraflex® with 2 mm thickness and 2% ash content. This goes under the commercial name L20010C and it is being considered for application in the current TDE design widely described above. A transversal cross-section of a specimen free from any processing marks was cut by employing a Ga+ Focused Ion Beam microscope. The sample surface was first prepared by platinum deposition along the top edge of the desired section. This was meant to be sacrificial for the cross-sectioning while limiting the tail and curtaining effects by levelling the superficial asperities. Then, the cross-section was milled by ion sputtering (30 kV, 65 nA) along parallel stripes, at increasing depth, from the surface down to approximately 100 µm. An ion current of 2.8 nA was adopted in the last milling step to finely smooth the surface. The final section is rectangular with sides of 100 µm 150 µm, perpendicular to the slicing direction as in Figure 3.
The images that accurately captured the pore structure and the regions less subjected to curtaining were analyzed in MATLAB® using Image processing ToolboxTM functions. The anisotropic diffusion filter was used to lower the noise while preserving the edges, and the marker-controlled watershed algorithm was exploited for pore detection. Morphological operations improved the analysis and manual intervention was sporadically needed to discard poorly detected pores, sometimes confused with dark artifacts in the denser material domains. Moreover, the material was visually split in two phases (dense and coarse, see Results section) by direct crop of the image FFT followed by thresholding of the reconstructed image. The best parameters combination was found by recursive attempts comparing the trend of the total porosity affected by each of them.
The radii of the maximum inscribed circles were calculated as the maximum of the distance transform per each pore binary image and used for the definition of the aspect ratio where is half of the maximum Feret diameter. All the quantities calculated were converted to the metric system by pixel proportion.

2.3 Results
The corrected view of the whole section is reported in Figure 4. Despite the curtain effect due to the high porosity, the micro-structure is much more evident than in tension-fractured specimens images such as those ones reported in detail in [20] or on the right side of Figure 4.

Two types of regions can be identified by visually separating darker and brighter spots. The former have stripe-like shapes with tiny pores and tend to run perpendicularly to the compaction direction; the latter show larger pores with very misaligned walls and shiny features. Such distinction becomes more evident at increased magnifications such as in Figure 5. The darker regions are composed of several compacted layers attributed to bundles of micro-sheets (Figure 5(b)). The micro-sheets are well-aligned with each other and are separated by thin and elongated pores. The contact lines visible in Figure 5(d) helps to follow visually the micro-sheets profiles were attributed to totally compacted pores. Micro-sheet’s thicknesses did not show big variation in dimension when manually measured by pixel proportion. These ranged between 40 to 120 nm and correspond to 120 to 360 carbon basal planes, at least twice than the values predicted by nitrogen adsorption and specific surface area estimation [9, 18]. In the transition between the two regions (Figure 5(c)), the micro-sheets deviate from the aligned state and branch out with continuity until becoming pore walls. The relative interlocking between neighbouring worms is so effective that any discontinuity amenable to the particles’ boundaries was not detected. Due to the sheets’ extreme flexibility, the particles withstand large deformations without failure so that during compaction they can fold into themselves and collapse creating very non-regular pores’ contours. This confirms the observations made in [12] about the presence of two types of regions, one with slightly oriented micro-sheets and one with highly wrinkled micro-sheets, each related to a different deformation response upon uniaxial compression load. In the following, we will refer to the oriented micro-sheets regions as aligned regions whereas to wrinkled regions as misaligned regions.


The pores detected in the imaged domain are highlighted and overlapped to the original image in Figure 6(a). Despite the accuracy of the measurements was checked by visual assessment, it was obvious that the best results were obtained for medium-size pores. Large pores’ boundaries indeed were affected by ambiguous features visible in the internal pore walls resulting in areas underestimation. Smaller pores conversely could be confused in the noisy and dark shades of the hard regions. In total, 2681 pores were identified within an area of 27.62 × 41.47 = 1145.5 µm2, resulting in a local 2D porosity of 0.15 0.05 averaged over and including all the tested combinations for the algorithm parameters. The limited size of the region together with the 2D nature of the investigation can explain the big discrepancy with the overall material porosity (P = 0.51 – 0.55), but the density gradient along the sheet thickness predicted in [29] i.e., denser material on the sheet surface, is considered as the most suitable explanation for such discrepancy. The aligned and misaligned domains were separated so that the pores’ properties could be assessed per each domain. The different combinations of the algorithm parameters, such as the cut-off frequencies of the passband filter and the grayscale thresholds, were tuned until the binarized regions satisfactorily overlapped the aligned and misaligned regions, considered as complementary. The area fraction of the aligned phase ranged between 0.55 and 0.42, with an average value of 0.49 (Figure 6(b)). Its porosity was calculated as the summed areas of all the pores falling within this region with more than 50% of their pixels. The value obtained at 0.49 area fraction was 0.051, one order of magnitude lower than the porosity of the soft phase that instead was 0.24. The number of pores was almost equally distributed between the two phases i.e., 1459 for the soft phase and 1222 for the hard phase, but the soft phase contributed to the 85% of the overall porosity volume. The radius of the maximum inscribed circle , the half of maximum Feret diameter together with their ratio (Figure 6(c)-6(d)-6(e)) were used to describe the size and shape of the pores. On average, the values of and of the soft phase pores are larger than the hard phase pores, whereas the AR distributions are identical meaning that the main difference between the two phases is mainly about the pore sizes. This is better quantified by the equivalent radii distributions in Figure 6(d) which shows that despite the continuous spectrum of values, the two logarithmic distributions tend to decouple. Assuming them as log-normal distributions, the average values for are 0.13 µm and 0.0618 µm, corresponding to an area of 0.0509 µm2 and 0.012 µm2, for the soft and hard phases, respectively. The pores in the soft phase are therefore more than 4 times bigger than the pores in the hard phase. Gathering all the data under the same distribution, one can finally obtain the average values for all the pore parameters, reported in Table 1.


| Rins | Rmax | AR | Req | Area |
|---|---|---|---|---|
| 0.069 µm | 0.199 µm | 0.384 | 0.084 µm | 0.022 µm2 |
2.4 Observation of detached particles
The particles detached from the specimen surface looked like the one in Figure 7. It may not be possible to indicate with certainty whether the whole particle or part of it could be detached, but the thickness size thereof is coherent with those expected for compressed particles. Many micro-sheets were teared apart and fractured in the out-of-plane direction, which corresponded with the pulling direction of the tape. A small part of the particle detached appear as still being attached to the bottom surface and constitutes as an example of how the particle interlocks among each other. However, once they are compacted together, it is nearly impossible to distinguish them since the inner and outer (in between the particles) porosity show the same level of inhomogeneity. Both aligned and misaligned regions are clearly visible in the inner particle structure and especially in the inset B of Figure 7, the micro-sheets configuration appears as the result of meso-structure kinking due to in-plane compression stress. In this case, the misaligned regions are originated in between two kinking micro-sheets bundles.

3 Uniaxial compression
3.1 Motivation
From a macroscopical point of view, the FG foil appears as a relatively soft, flexible, and inelastic material. It can easily delaminate under low bending forces in the in-plane direction and sliding planes are generated in the deformed regions. It is reasonable to assume in-plane isotropy both in terms of mechanical and thermal properties, but strong differences can be found between the in-plane and out-of-plane directions in terms of strengths and elastic moduli. A representative overview of the values for the aforementioned material properties is shown in Figure 8 as a summary of previously reviewed literature [6, 10].
The out-of-plane compression behaviour is considered as a starting point for the constitutive behaviour characterization, the focus of the current work. In [31], 1.1 g/cm3 material was tested under uniaxial compression and a hyper-elastic Blatz-Ko foam constitutive law was calibrated with the experimental data to model a particular sealing configuration under high pressure. [12] instead, tested 1 g/cm3 FG in the out-of-plane direction. Cyclic compression was applied up to a maximum load of 31 MPa and the material was observed to densify up to 1.73 g/cm3 where no further irreversible deformation was possible. The only curve reported was however stress-specific volume curve for static load. Also [32] investigated the low-loads response (maximum load = 1 MPa and maximum engineering strain less than 6%) of FG at four different densities, i.e. 0.55, 1.05, 1.54, 1.7 g/cm3, and showed a full elastic recovery in all cases with non-linear behaviour and little hysteresis in the last three density values. While the curves reported in [31] for high loads showed a behaviour similar to those observed in granular powders compaction or crushable foams, the low-loads behaviour reported in [32] appears unusual for these materials and needs to be further investigated. Moreover, the Sigraflex® sheets employed in the TDE core undergo loading and unloading compression cycles and cyclic plasticity must be integrated in a constitutive law relevant to the working conditions.
3.2 Method
Static and cyclic uniaxial compression tests were carried out by using the same material described on section 2.2. The foils were hole punched in circular specimens with 26 mm nominal diameter (Figure 9(a)) and the Instron Electropuls® E10000 machine used for testing (maximum load 10 kN, load cell resolution 0.5 N) was equipped with compression plates as in Figure 9(c).


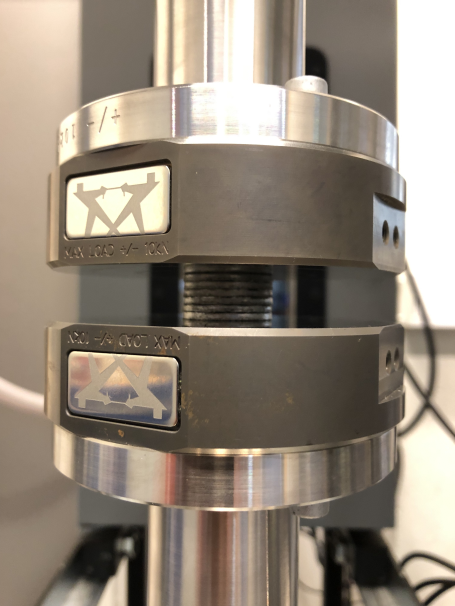
In total, 25 tests were performed on single unit specimens (Figure 9(b)) and 5 tests on 6-units stacked configuration (Figure 9(c)). The number of specimen per each testing condition is reported in Table 2. Recommendations from ASTM D695 [33] and ISO 13314 [34] were followed when possible. All the monotonic and cyclic displacements were applied at 0.1 mm/min rate by means of single or repeated triangular waveforms where, in some cases, a 30 seconds holding time was applied at the maxima and minima displacement peaks. A pre-load not exceeding 0.03 MPa (15 N) was consistently imposed for all tests to ensure contact between the plates and the specimen. In 7 cyclic tests, a cyclic load up to 1 MPa with a load rate of 30-40 kPa/s was imposed prior to testing for 6-10 cycles, until a satisfactory repeatability was observed in the loading-unloading curves. Finally the target test programm was followed in displacement control. One test was done at 0.01 mm/min and one in load control at 20 kPa/s (roughly equivalent to a displacement rate of 0.1 mm/min). In any case, the maximum stresses achieved ranged from 1 to 14 MPa. The specimens’ diameters and thicknesses were measured by a digital calliper ( 0.01 mm resolution) at 5 random positions along the lateral and base surfaces before and after each test so that the residual deformations could be compared with the machine log data. The data were plotted using the definition of true strain for compression:
| (1) |
where = 2 mm is the gauge length of the specimens (corresponding to the nominal thickness) and is the current specimen thickness. The engineering and true stresses were considered as equal due to the small variation of the resistant area. These were obtained as:
| (2) |
where F is the machine force and R the specimens radii.
| Monotonic | Cyclic | |
|---|---|---|
| Single specimens | 8 | 17 |
| 6-sheets specimens | 4 | 1 |
3.3 Monotonic curves
The monotonic tests were stopped at arbitrary displacements and unloaded completely before any sign of failure could be detected. Three examples of true stress-true strain curves obtained from specimens tested in this way are shown in Figure 10(a). All the stress-strain responses feature an initial flat toe of variable length, including those obtained from stacked specimens, and steepens up to prosecute with an apparently linear domain. The concavity is turned upward after a knee occurring always at a well-repeatable stress level.
Three domains were detected based on the change points of the true stress-true strain tangent modulus (Figure 10(b)). In the first domain, the initial toe was characterized by a fast increase in slope where a local maximum was reached in correspondence of 30 MPa slope value. The true strain at maximum showed a wide scatter of values around 6 – 6.2 %, spanning between 1.5% and 16%. The corresponding stress values were instead tight in the range 0.3 - 0.4 MPa. To exclude that this initial toe was due to unexpected geometrical imperfections of the specimens, a single sheet was monotonically loaded up to 7 MPa to obtain a perfect flat specimen, let recover for 2 hours and loaded again, cyclically, up to 7 MPa (Figure 10(c)). The toe was again clear, but the strain recovered was much less than the one observed in the first loading-unloading path. The same behavior was also well visible in the piled-up specimens and was considered as part of the material response in a recent investigation of similar FG stacked disks loaded up to 1 MPa [32]. However, since it contributes to a large part of the total true strain, we quantified its influence by applying a virtual preload of 0.3 MPa to all the tests and taking the corresponding displacement as a new zero for true strain definition 1. The curves obtained in this way are plotted in Figure 10(d) together with the corresponding curves obtained by taking the first recorded displacement value as reference and by shifting along the strain axis. Interestingly, the curves obtained by virtual pre-load tend to nicely overlap meaning that the 2-mm-gauge length starts to be effective only at the end of the toe. It is therefore supposed that the toe strain is due to the relaxation of the material after the production process governed by meso-structural mechanisms such as micro-sheets unfolding and disentangling. This can be better explained by the crumpled nature of FG, detailed in the section 4. Since friction is involved in the unfolding process of the micro-sheets, the toe contribution is regarded to as visco-elastic mechanism that decreases at higher compression loads to an increasing number of contacts and geometrical constrains of the micro-sheets. The curves used and the data calculated in the next sections referred to the curves calculated assuming the virtual preload and hence excluding any data in the stress domain below 0.3 MPa.
The second domain spans up to 24% strain, where the tangent slope decreases more slowly than in the first domain (the alleged linearity therefore remains apparent) and reaches its local minimum at around 12 MPa. This occurs a bit after the curves knee that can be recognized in the hump visible in the middle of the range. The stress corresponding to the slope minimum is again quite similar for all the tests and it was 5.1 MPa on average.
In third region, the tangent modulus grew up to the maximum load. The concavity acquired at this point by the stress-strain curve can be attributed to the densification regime given by the pore closures mechanisms where the pore walls are predominantly touching with each other. Since the material itself is the result of a densification process followed by a certain amount of recovery, the third regime can be regarded as a continuation of this process whereas the second region represents the transition needed for the specimen to recover the elastic and (previously) accumulated inelastic deformation. To trigger again the densification, the stress applied must be equal to or higher than the maximum stress undergone during the compaction: this can be estimated by the exponential fit proposed in [32], where the compression stress is related to the final density by:
| (3) |
Even if the relation was found for close die compaction of expanded graphite powder, when = 1 g/cm3 then = 4.7 MPa. This in line with the value = 5.1 MPa found here for the beginning of the densification regime under uniaxial compression.
3.4 Cyclic curves
An example of cyclic curve is shown in Figure 11(a). Three main phenomena were visible in each test: (i) memory of subsequent cycles stress-strain extreme points, (ii) nearly-zero yield strength and (iii) large hysteresis in the unloading-reloading path.

The first one refers to the tests where 2 or more cycles were done at the same peak strain (Figure 11(a) or inset in Figure 11(b)): inelastic deformation is induced in the material only during the first few loading cycles that are followed by a stable regime where the strain is fully recovered at each cycle. Hysteresis is always visible, but the stress-strain reversal points are held fixed and become memory points. The memory can be established again by exceeding the current peak stress and cycling at higher strains or loads, as also visible in the pre-conditioning stage in Figure 11(b) inset. This behavior was reported for bulk artificial graphite [35] and can be associated to discrete memory typical of rocks and soils [36]. It was motivated by the layered structure of graphite that allows for generation of so-called incipient (and reversible) kink bands [35].
About the nearly-zero yield strength, this is common in foams under compression due to specimen geometry imperfections, as reported in [37], but it is also well-known to occur naturally in polycrystalline graphite under uniaxial compression loads [38]. As shown in the inset of Figure 11(a), the cyclic paths usually start from a positive pre-load around 0.03 – 0.04 MPa, reach the cycle peak stress and recover the total strain imposed. This is repeated until the peak stress does not overcome 0.5 MPa where the inelastic strain at zero load appears. However, for any peak stress also lower than 0.5 MPa, the stress values at zero strain tends to decrease as if the preload was already inside the plastic domain and hence the yield strength lower than the pre-load. Even though the same behavior was also observed in the 0.01 mm/min test (the slowest one), it cannot be excluded that holding longer waiting time at zero load may allow for the full recovery of cycles having peak stresses even higher than 0.5 MPa.
Concerning the large hysteresis, this is typical in foams made of polymeric materials [37] due to the visco-elastic character of polymer chains. Analogously, the viscous character of FG (already highlighted in [18]) may be inherited by the layered crystal structure of graphite that allows for basal dislocations and kink bands to propagate and can exhibit recoverable hysteresis loops [35]. On this side then, the contribution from the graphite crystalline structure to the FG hysteresis would be given by the aligned regions that can constitute a large part of the total volume (in the FIB-SEM section, a fraction equal to 0.49 of the area investigated was attributed to aligned regions). On the other side, the misaligned micro-sheets can also contribute to the viscous behavior in different ways, as for example fibres in entangled materials where geometrically constrained features slide and originate friction forces [39]. Further testing is needed to uncouple these two potential contributions, but it is believed that the second one is limited to the toe region at low loads since, as it will be discussed in the next section, that can be related to the structural component of the total strain.
As final remark, it is reported that those tests that were pre-conditioned did not show any remarkable difference with the other ones. The cyclic paths stabilized after 2 - 6 cycles as in Figure 11(b) while the toe was always visible in the low-loads domain together with a constant are inside the cycles. Further re-cycling at higher or lower loads than 1 MPa did not show again any difference with other not pre-conditioned tests.
In each test, the toe contribution is visible only in the low-loads region of every cycle and tends to gradually become shorter at increasing loads, until almost disappearing completely above 40% true strain and 7 MPa true stress.
3.5 Initial cyclic tangent slope
The tangent slope or modulus of the loading cycles was calculated to monitor the change in stiffness under increasing compression loads. Due to the hysteresis loops shape, the modulus was calculated as shown in the inset of Figure 12(a): per each cycle, the initial part of the loading path after the toe was fitted by a linear polynomial, corresponding to 0.3 – 0.4 MPa, and the slope value was taken as the tangent modulus. The tangent line was then extended downward to cross the x-axis and the intersected true strain was considered as the inelastic component of the total strain. This was used to define to final relative density by means of
| (4) |
where = 1 g/cm3, = 2.26 g/cm3 and no lateral deformation is assumed. The last hypothesis will be better supported in section 3.6. The moduli are finally plotted against in Figure 12(a).
The initial cyclic tangent modulus in general differs from the cyclic secant moduli used to characterize foams of various nature (see for example [37]), but it is considered here as more meaningful because of the different production process employed for FG. The uniaxial compression test can indeed be regarded as a continuation thereof, and each unloading as the final stage for obtaining a new FG sheet with different properties such as density and tangent modulus. Part of the irreversible deformation resulted by new compaction is given both by micro-sheets’ folding and additional interlocking. These affect the pore shapes and sizes, and consequently the elastic response at the current stage for which the initial tangent modulus is considered as representative. In [37], it was observed that the cyclic secant modulus in metal, polymer and cement foams varies differently in the elastic, plastic and densification domains. In the case of Sigraflex® instead, the tangent modulus was found to only increase from the initial value of 30.35 MPa (on average at first cycle) up to the maximum stress. The material hence undergoes stiffening from the beginning of compaction, or equivalently, continues the crumpling process from where it was left after production. In light of equation 4 suggested in [32], and the exponential law proposed earlier in [25] to relate the compression moduli and the porosity P = 1 - of expanded graphite compacts, the cyclic tangent moduli were plotted in semi-logarithmic coordinates in Figure 12(b) together with different data available in literature. The exponential fit in the inset of Figure 12(b) was found to describe nicely the moduli evolution along with and gave an exponential coefficient of 3.4, quite different from 0.2 found in [25]. Likewise, the data found in literature were fit with similar exponential laws, including the average value for the initial tangent modulus found in this work (30.35 MPa) and they were found to give a similar exponential coefficient equal to 3.89, confirming that further compression may be also seen as a continuation of the production process. Even if the specimens were produced under different conditions (closed die or rolling) and different were the measurement technique (ultrasound speed or stress-strain tangent slope), it is clear that the FG tangent modulus follow a scaling law of the type
| (5) |
when in the range 0.1 – 0.2 g/cm3 0.7 - 0.8 g/cm3. Here, is the FG tangent moduli at = and is the exponential coefficient. Equation 3 can be also expressed in terms of residual relative density , that is, by setting = ,
| (6) |
The relations 5 and 6 highlight the main differences between FG and cellular solids, that mainly follow power law-like scaling relations [42].
3.6 Residual deformation
Despite Sigraflex® datasheet22 2 https://www.sglcarbon.com/en/markets-solutions/material/sigraflex-flexible-graphite-foil-and-tapes/ indicates 0.1 coefficient of friction for general contact with steel, very low barrelling and lateral deformation were visible in the piled-up specimens during the test, as also noticed in [32], up to 30% compression strain. Even if no visual information could be obtained for the single-disk tests due to the narrow access to specimen, volumetric and axial strains will be taken as equal for both single and piled-up specimens, so that Equation 4 holds. The residual volume change instead was assessed by measuring the residual axial and radial deformations at the end of each test. In Figure 13(a), the measurements of the thicknesses and radii of each specimen are shown against the maximum true strain; in the case of axial residual strain the corresponding machine data for the last displacement value at zero load is also shown to assess potential influence of additional strain due to long-time relaxation. The minimum displacement resolution caught by the calliper was 0.01 mm: this was fine enough to exclude the influence of a systematic error, but not to resolute the size variations of specimens loaded below 0.08 true strain.
The radial residual strains shown in Figure 13(a) rose above the calliper resolution at around 0.1 true strain (corresponding to 3 MPa) and increased almost linearly with the applied deformation. Same for the axial residual strain that showed good agreement with the last strain recorded by the machine at the end of the unloading path. Long-time relaxation was probably more effective at strains higher than 0.5 where more gap is visible between the calliper and machine data. These measurements were meant to quantify the recovered deformation of the initial toe after sufficient relaxation time, but this was not detected probably because of the too high pressure applied manually by the calliper. The ratio between the residual strains in the radial and axial directions can be considered as an estimation of the plastic Poisson’s ratio of the material, even though more accurate strain-recording method should be applied to verify the quality of these data. The plastic Poisson’s ratio is typically very low for most foam materials ranging around 0.04 [42]. The elastic Poisson’s ratio for non commercial FG was observed in the single particle deformation under compression and it was estimated to be 0.04 in [21]. This is not so different from the average value of 0.083 shown in Figure 13(b) and can be considered as constant through the whole tested domain, that is, up to 0.58 true strain.
4 Discussion: FG manifold nature
The elastic modulus of a graphite single crystal perpendicular to the basal plane is = 36.5 GPa [43]. The out-of-plane elastic modulus of a less perfect material such as polycrystalline or pyrolytic graphite ranges from 10.88 GPa to 29.35 GPa [44, 45]. A simplistic rule of mixture relation for the out-of-plane modulus using FG porosity would output a value at least in the order of magnitude of 1 - 10 GPa i.e., 100 times higher than the tangent modulus found in this work (30.35 MPa). A good explanation to this big discrepancy can be given by regarding FG as having a crumpled meso-structure in which the bending rigidity of the constitutive micro-sheets plays the major role under out-of-plane compression loads. The ratio between the bending and stretching rigidity of an elastic plate scales with , that is, the square of the ratio between its thickness h and width L. The h/L ratio of single FG micro-sheets with 0.1 µm and 100 µm is estimated in the order of 10-3. This means that the resulting rigidity is 10-6 times lower than the graphite single crystal in-plane modulus = 1060 GPa [43], i.e. 1 MPa. This is a much better estimate for the compression modulus reported in [40] or [9] for expanded graphite at densities around 0.01 – 0.2 g/cm3 and can explain the values for higher density sheets found in [32] and this work.
Crumpled materials have been partially investigated from a structural point of view, and some works can be found about crumpled paper, crumpled aluminum foils, crumpled graphene and crumpled pyrolytic graphite [46, 47, 48, 49]. These are also related to another class of material called entangled materials, which are usually made of compacted metal wires, including aluminum, steel, and titanium [39, 50, 51]. In [52] for example, some similarities between crumpled aluminum and entangled materials are highlighted under uniaxial compression loads also with respect to crushable foams. These three groups of materials can all be viewed as cellular solids, but the peculiar aspect is in that both crumpled and entangled materials are kept together by contact forces generated by local geometrical configurations that constitute the material meso-structure whereas foams are mainly continuous structures with dispersed pores. Despite the crumpling processes appear accidental, the randomly folded materials are statistically well-defined and well reproducible in experiments [53], as also seen by the great repeatability in the uniaxial compression tests of Sigraflex®. In the case of FG then, the micro-sheets are seen as the single entities that undergo the crumpling process; this is facilitated by the the previous exfoliation process and the very low shear forces needed to delaminate the carbon layers, in addition to the ability of graphene to fold up to tens of nanometers radius curves without breaking [54]. The crumpled nature may also explain the huge volumetric strain undergone by the pores during the production process. The uncompacted worm cells before any compaction are roughly equiaxial with wall-to-wall size in the order of 10 µm. The average size of a Sigraflex® pore is instead 0.16 µm, leading to a volumetric strain that approaches the unity. This is only possible by the continuous folding of the micro-sheets and the modification of the pore space due to formation of new and much smaller pores in between the creases.
As shown by FIB-SEM analysis, the meso-structure is made of micro-sheets heterogeneous configurations: the aligned regions are piled up, well-straighten along the bedding plane and tiny pores run among them. The misaligned regions are randomly oriented and form zig-zag paths running around much bigger pores. The voids distribution is not uniform as well as the mass distribution, like what happens when a paper ball is crumpled under compression forces [55]. Intuitively, aligned regions can be attributed to a behavior similar to well-ordered graphite at increasing compression forces and the local out-of-plane stiffness is expected to be higher (also suggested in [12]), and determined by dislocation mechanisms related to the crystalline micro-structure. In the same work, these regions were linked to the elastic stored energy of the material, and hence to the elastic response. Conversely, the misaligned regions can contribute to meso-structure deformation mechanisms in the sense that micro-sheets can create new folds, new contact points and interlocking constraints. These regions can turn into aligned regions once sufficiently crumpled, resulting in global stiffening (i.e., the compression curve upward concavity) and perhaps shifting the dominant deformation mechanism from the meso-structure to the micro-structure.
Some similarities on uniaxial compression curves of FG and crumpled or entangled materials reported in literature are highlighted and discussed in the following.
In [56], a non-linear elastic region in closed-die compaction of aluminium foils was noticed at low strains. This regime was described as apparent, resulting from two deformation contributions, one from the constitutive material and the other from dry sliding between sheets i.e., the meso-structure. Similarly, Tan et al. [51] argued that a structural strain component dominates the initial elastic domain in quasi-ordered entangled aluminium alloys and leads to similar nonlinear stress-strain curves. More examples of akin behaviors can also be found in [50, 57]. In the same way, this allows us to think at the FG initial toe as a combination of material and structural contributions, where the former is localized near the creases and involves basal dislocations inside the micro-sheets, while the latter can be associated with local rigid motions of unstrained micro-sheets parts that result on large macroscopical deformation.
In [53] it was underlined that the stress relaxation in crumpled aluminum can be treated as a random consequence of individual events of energy dissipation. Therefore, the recovery after unloading can be attributed to meso-structural constraints that are locked and released when the load is increased or decreased around a threshold value (in this case around 0.3 – 0.4 MPa).
The FG transition domain seen in Figure 9(b) can be interpreted as a hardening region, as opposed to the typical flat plateau occurring in foams and due to cell walls’ buckling. Hardening and absence of flat plateau were also observed in [52] for crumpled aluminum and these were set among the similarities with entangled fibrous materials. Cottrino et al. [56] motivated this response by noticing that the stress increases with the number of contact points in a power-law-like dependency. Similar power-laws are also generally observed in foams during the full densification regime [42] with the stress-strain curve concavity remaining upward. Nevertheless, FG stress-strain or stress-density curves held downward concavity up to 20% strain and only later this is turned upward, as if two different mechanisms are determining the hardening response. The downward concavity part is suggested here to come from the aligned regions where the probability of new contacts is reduced and the deformation mechanism is given by the crystalline structure. When the curves concavity then turns upward, the curves fit pretty well the exponential law (as it will be shown in the next section) where probably the generation of new contact points occur in parallel to local regions harder to fold. Indeed, Luo et al. [54] tested crumpled graphene balls by nanoindentation and attributed the observed stiffness and strength increase to the formation of more hard-to-bend ridges (based on the ability of graphene to fold without failure much more severely than other materials). In any case, since the compression modulus in Figure 12(b) follows the same linear trend in semi-logarithmic coordinates for 0.1 – 0.2 g/cm3, the hardening mechanism should occur in the same way for such whole range.
Other differences between FG and crumpled materials can be related to the nature of the base material; for example in crumpled aluminum the yield point is obvious and hysteresis loops are very limited, where FG has unclear yield stress and large hysteresis due to the intrinsic graphitic nature.
For the sake of completeness, it is also emphasized that FG can show some aspects typical of compacted powders. Indeed, FG is nothing else than a powder compact with soft exfoliated graphite particles that develop cohesive forces at boundaries thanks to their meso-structure ability to interlock (see Figure 7). This observation is also based on the analysis of Celzard et al. [9] that referes to low-density compacts as porous packing of particles and proposed a first analysis of interacting forces. Dowell and Howard [12] also suggested that number of links per unit mass increases with the density up to a saturation threshold. Density-dependent properties are common in compacted powders and some material models available in commercial FE software allow for controlling such dependency (see for example Modified Drucker-Prager/Cap plasticity [58]). Unfortunately, particle boundaries and interaction features are practically indistinguishable in FIB-SEM images unless these are deliberately pulled apart. And even if the role of cohesive forces is not highlighted under compression loads, it can be the key to understand the response under tensile or simple shear conditions.
We can summarize this paragraph by saying that Sigraflex® or FG can be classified as a cellular solid that embodies a three-fold nature, already described as hierarchical in previous works [9]. This is related to (i) the layered micro-structure of graphite, (ii) the meso-structure of crumpled materials and (iii) the macro-structure given by cohesive forces between particles, in analogy to compacted powders, and a full characterization of the material mechanical response must account in parallel for all of these three aspects.
5 1D analytical model
A simple analytical model is proposed in this section in the attempt to decouple the deformation contributions coming from the FG graphitic and crumpled nature upon compression loads. As introduced in the previous paragraph, the aligned regions are associated to a stress-strain response akin to well-oriented graphite and, in particular, polycrystalline graphite was found to match a constitutive law of the type [59]:
| (7) |
where A [MPa-1] and B [MPa-2] are defined as elastic and plastic compliances. The model originated from the intuition of inhomogeneous plastic deformations gradually participating to the overall deformation as a continuous involvement of additional springs in a series. Despite 7 was found to give a good fit only up to a half of the sample strength, this is chosen here since it is easy to manipulate and resembles the commonly used Ramberg-Osgood equation having the stress exponent set to 2. In terms of stiffnesses it reads:
| (8) |
Here is attributed to the elastic modulus of the aligned regions at zero strain and is a material parameter that accounts for both the volume fraction and stiffness of the aligned regions involved in the plastic deformation. This relation can also be inverted, assuming positive strain 0, as follows:
| (9) |
On the other side, the misaligned regions are associated to a different function of the compression stress and the current relative density . This differs from defined in equation (4) since it is related directly to by:
| (10) |
To formulate the final relationship, it is assumed that not only is related to by an exponential law of the type (6), but also satisfies a similar law. Indeed, plotting experimental - curves in Figure 14(a) in semi-logarithmic coordinates, a straight line could be fit in the whole densification regime. For comparison, - curves extracted from the cyclic compression curves were also plotted together using the initial strain as found in the inset of Figure 12(a). The exponential coefficient is in a good agreement with that reported in equation (6) [32], and the difference is ascribed to the uncertainty about the real relative density of tested specimens in this work.
Assuming that the misaligned regions are those who provide the major deformation contribution to the densification regime, their compression modulus can be related to by an exponential law, in analogy to the exponential law (6) between and :
| (11) |
is the initial modulus of the misaligned regions and is a parameter related to the rate of densification. Substituting (10) in (11), the stresses are expressed in terms of strains:
| (12) |
The contributions from (9) and (11) are assumed to work in parallel as shown by the equivalent rheological model of Figure 14(b) so that the total stress versus true strain relationship is obtained by:
| (13) |
Equation (13) was used to fit separately 12 of the experimental monotonic curves that reached sufficiently high stress levels, as shown in Figure 14. These were considered after the virtual preload was applied, so to not include the toe contribution to the total strain. The median for each of the 4 fitting parameters is reported in (3) together with the corresponding maximum and minimum values. Whereas the exponential trend in the densification regime is matched perfectly, much room for improvement is visible in the transition region: this indeed depends on the exponent 1/2 in equation (9) which is already known to partially match the graphite behavior.
Even if the cyclic behavior was not modeled here, the two friction blocks in the rheological model of Figure 14(b) were inserted to represent the accumulated inelastic strain and to underline that both the graphitic and crumpled natures give separate contributions to the overall inelastic deformation. The friction block backing the spring series associated with the fitting parameter represents the non recovered deformation coming from dislocations internal to the micro-sheets, whereas the contact forces at micro-sheets interlocks are gathered in a separate block representative of such meso-structure contribution. Each spring of the spring serie was associated by Jenkins [59] to the an elastic stiffness of the plasticizing regions. Here however, these components were not decoupled and is simply regarded as a fitting parameter that incorporates such stiffness as if they were already integrated over the deformed volume and uncoupled from any stress dependency.
The values found for are in good agreement with the tangent slope values calculated numerically in the previous section, giving a value slightly higher. At the early beginning of deformation, and act in parallel on behalf of aligned and misaligned regions, but is negligible meaning that the former are predominant and and determines the initial response. The tangent slope decreases thanks to the contribution of the spring series until it rises quickly thanks to a high rate of densification . The flexes obtained numerically at the minimum of the stress-strain first derivative match satisfactorily the flexes given by the fitting curves as shown the inset of Figure 14.
Despite a 1D model is not comprehensive and direct applications for material modeling are limited, it confirms that the assumptions made about the decoupling of deformation contributions are realistic.
| Median | Maximum | Minimum | |
|---|---|---|---|
| [MPa] | 39.51 | 45.35 | 38.043 |
| [MPa] | 0.0203 | 0.04 | 0.0098 |
| [MPa2] | 127.086 | 158.62 | 105.59 |
| [-] | 7.93 | 8.55 | 7.32 |
6 Conclusion
In this work, Sigraflex® ( = 1 g/cm3) micro-structure and uniaxial compression behavior have been investigated. The results and observations can be considered as valid also for FG having similar density and production parameters. The main outcomes are summarized as follows:
- 1.
For the first time, a quantitative description of the pore sizes and shapes in the vicinity of the surface have been given by FIB-SEM and image processing. Some portions of the milled section (100 150 µm) that were the least affected by curtaining were chosen for image post-processing in 2D. The micro-sheets were clearly visible and they were estimated to be made of 120 - 360 carbon basal planes. The micro-structure was found to be made of aligned and misaligned regions: the first ones were composed of bundles of well-oriented micro-sheets surrounded by thin and elongated pores. The second ones were found to have bigger pores (Req = 0.13 µm) and mainly contributed to 85% of the overall porosity. In general, all the pores were found to have low aspect ratio (0.384), as it is expected after a compacting production process. The single compressed particles could not be distinguished in the investigated section and an attempt to detach them from the specimen surface was done by adhesive tape. The presence of aligned and misaligned regions was confirmed also in the inner structure of the particles (or part of them) detached.
- 2.
Static and cyclic out-of-plane uniaxial compression tests were performed on disk-shaped specimens. Three stages of deformation could be detected in the monotonic stress-strain curves: the initial toe, the transition and densification regions. The deformation mechanism behind the initial toe was attributed to a structural component of the strain, in analogy to uniaxial compression tests of crumpled and entangled material. The transition region was markedly different from a typical flat plateau usually observed in foam compression: the hardening part having downward concavity was attributed to a predominance of graphite-like dislocation mechanism, whereas the reversed concavity and the densification were attributed to development of new contact forces and formation of ridges that become more and more hard to bend. The densification can be considered as production process continuation where the number of aligned regions increases and stiffens the response. During cyclic loading, FG shown discrete memory behavior similar to rock and soils, nearly zero yield strength typical of graphitic material and large loop hysteresis. FG initial tangent slope both at the transition region beginning and at each new loading cycle was found to obey exponential laws of the residual relative density.
- 3.
The residual deformations strain ratio was estimated to have constant value (0.083) along the strain domain tested. This can be considered as a rough approximation for plastic Poisson’s ratio.
- 4.
FG shows a manifold material nature at three different scales. Hundreds of carbon basal planes constitute the micro-structure of a single micro-sheet and the deformation mechanisms at this scale are akin to crystalline graphite deformation mechanisms. The micro-sheets are severely crumpled without failure thank to easy sliding of basal planes and hence locally deform similarly to crumpled materials. Contact forces due to folds and wrinkles act as cohesive forces in compacted powders and keep the micro-sheets, and consequently the particles, aggregated.
- 5.
A simple 1D phenomenological model was proposed to fit the experimental compression curves and to support the assumptions made on the decoupling of underlying deformation mechanisms. In particular, FG graphitic and crumpled natures were taken as the relevant mechanisms under compression loads. The model was found to match the curves and corresponding flexes satisfactorily, while the 4 parameters were represented in a simple rheological model.
The problem of FG constitutive modeling has been broken down as well as the necessary keywords to lead the next research steps were defined. These can be used to find similarities between FG behavior and material models already available in literature. For example, the very low plastic Poisson’s ratio excludes the possibility to use standard metal plasticity models and steers the investigation towards pressure-dependent models used for foams or compacted powders.
7 Acknowledgements
This work made use of NTNU laboratories: Realization Laboratory, Nanomechanical Testing Laboratory, Fatigue, Fracture and Mechanical Characterization Laboratory, and NanoLab. The authors are also thankful to Malin Alette Lervaag and Tore Andre Kristensen for technical support. E.S. thanks prof. O. S. Hopperstad for constructive discussions and suggestions.
References
- Evans and Bryant [2008] L. Evans, P. Bryant, Lhc machine, Journal of instrumentation 3 (2008) S08001.
- Wenninger [2016] J. Wenninger, Machine protection and operation for lhc, arXiv preprint arXiv:1608.03113 (2016).
- Nuiry et al. [2019] F.-X. Nuiry, M. Calviani, M. Bergeret, S. Pianese, M. Butcher, L.-M. Grec, A. Lechner, M. I. Frankl, F. L. Maciariello, T. Pichon, 3d carbon/carbon composites for beam intercepting devices at cern, Material Design & Processing Communications 1 (2019) e33.
- Heredia et al. [2021] J. Heredia, A. Perillo-Marcone, F. Berto, A. Alvaro, K. Kershaw, D. Grenier, V. Rizzoglio, E. Solfiti, R. Franqueira Ximenes, F.-X. Nuiry, et al., Jacow: Sigraflex® studies for lhc cern beam dump: Summary and perspective, JACoW IPAC 2021 (2021) 3571–3574.
- Shane et al. [1968] J. H. Shane, R. J. Russell, R. A. Bochman, Flexible graphite material of expanded particles compressed together, 1968. US Patent 3,404,061.
- Solfiti and Berto [2020] E. Solfiti, F. Berto, Mechanical properties of flexible graphite, Procedia Structural Integrity 25 (2020) 420–429.
- Chung [2012] D. Chung, Carbon materials for structural self-sensing, electromagnetic shielding and thermal interfacing, Carbon 50 (2012) 3342–3353.
- Chung [2016] D. Chung, A review of exfoliated graphite, Journal of materials science 51 (2016) 554–568.
- Celzard et al. [2005] A. Celzard, J. Mareche, G. Furdin, Modelling of exfoliated graphite, Progress in materials science 50 (2005) 93–179.
- Solfiti and Berto [2020] E. Solfiti, F. Berto, A review on thermophysical properties of flexible graphite, Procedia Structural Integrity 26 (2020) 187–198.
- Ivanov et al. [2021] A. V. Ivanov, N. V. Maksimova, M. S. Manylov, A. N. Kirichenko, I. L. Kalachev, A. P. Malakho, V. V. Avdeev, Gas permeability of graphite foil prepared from exfoliated graphite with different microstructures, Journal of Materials Science 56 (2021) 4197–4211.
- Dowell and Howard [1986] M. Dowell, R. Howard, Tensile and compressive properties of flexible graphite foils, Carbon 24 (1986) 311–323.
- Inagaki and Suwa [2001] M. Inagaki, T. Suwa, Pore structure analysis of exfoliated graphite using image processing of scanning electron micrographs, Carbon 39 (2001) 915–920.
- Chen and Chung [2015] P.-H. Chen, D. Chung, Elastomeric behavior of exfoliated graphite, as shown by instrumented indentation testing, Carbon 81 (2015) 505–513.
- Leng et al. [1998] Y. Leng, J. Gu, W. Cao, T.-Y. Zhang, Influences of density and flake size on the mechanical properties of flexible graphite, Carbon 36 (1998) 875–881.
- Yoshida et al. [1991] A. Yoshida, Y. Hishiyama, M. Inagaki, Exfoliated graphite from various intercalation compounds, Carbon 29 (1991) 1227–1231.
- Xiao and Chung [2016] L. Xiao, D. Chung, Mechanical energy dissipation modeling of exfoliated graphite based on interfacial friction theory, Carbon 108 (2016) 291–302.
- Chen and Chung [2013] P. H. Chen, D. D. Chung, Viscoelastic behavior of the cell wall of exfoliated graphite, Carbon 61 (2013) 305–312. URL: http://dx.doi.org/10.1016/j.carbon.2013.05.009. doi:10.1016/j.carbon.2013.05.009.
- Pierson [2012] H. O. Pierson, Handbook of carbon, graphite, diamonds and fullerenes: processing, properties and applications, William Andrew, 2012.
- Cermak [2020] M. Cermak, Natural graphite sheet heat sinks for power electronics, Ph.D. thesis, Applied Sciences: School of Mechatronic Systems Engineering, 2020.
- Toda et al. [2013] H. Toda, K. Tsubone, K. Shimizu, K. Uesugi, A. Takeuchi, Y. Suzuki, M. Nakazawa, Y. Aoki, M. Kobayashi, Compression and recovery micro-mechanisms in flexible graphite, Carbon 59 (2013) 184–191. URL: http://dx.doi.org/10.1016/j.carbon.2013.03.008. doi:10.1016/j.carbon.2013.03.008.
- Kobayashi et al. [2012] M. Kobayashi, H. Toda, A. Takeuchi, K. Uesugi, Y. Suzuki, Three-dimensional evaluation of the compression and recovery behavior in a flexible graphite sheet by synchrotron radiation microtomography, Materials Characterization 69 (2012) 52–62. URL: http://dx.doi.org/10.1016/j.matchar.2012.04.008. doi:10.1016/j.matchar.2012.04.008.
- Gu et al. [2002] J. Gu, Y. Leng, Y. Gao, H. Liu, F. Kang, W. Shen, Fracture mechanism of flexible graphite sheets, Carbon 40 (2002) 2169–2176. doi:10.1016/S0008-6223(02)00075-1.
- Wei et al. [2010] X. H. Wei, L. Liu, J. X. Zhang, J. L. Shi, Q. G. Guo, Mechanical, electrical, thermal performances and structure characteristics of flexible graphite sheets, Journal of Materials Science 45 (2010) 2449–2455. doi:10.1007/s10853-010-4216-y.
- Krzesińska et al. [2001] M. Krzesińska, A. Celzard, J. F. Marêché, S. Puricelli, Elastic properties of anisotropic monolithic samples of compressed expanded graphite studied with ultrasounds, Journal of Materials Research 16 (2001) 606–614. doi:10.1557/JMR.2001.0087.
- Efimova et al. [2017] E. A. Efimova, D. A. Syrtsova, V. V. Teplyakov, Gas permeability through graphite foil : The influence of physical density , membrane orientation and temperature, Separation and Purification Technology 179 (2017) 467–474. URL: http://dx.doi.org/10.1016/j.seppur.2017.02.023. doi:10.1016/j.seppur.2017.02.023.
- Nan et al. [2019] N. Nan, J. Wang, A. A. Eckstein, FIB-SEM Three-Dimensional Tomography for Characterization of Carbon-Based Materials, Advances in Materials Science and Engineering 2019 (2019). doi:10.1155/2019/8680715.
- Prill et al. [2012] T. Prill, K. Schladitz, C. Wieser, Simulation of FIB-SEM images for segmentation of porous microstructures, 1st International Conference on 3D Materials Science 2012, 3DMS 2012 35 (2012) 159–164. doi:10.1007/978-3-319-48762-5_24.
- Bonnissel et al. [2001] M. Bonnissel, L. Luo, D. Tondeur, Compacted exfoliated natural graphite as heat conduction medium, Carbon 39 (2001) 2151–2161. doi:10.1016/S0008-6223(01)00032-X.
- Solfiti et al. [2020] E. Solfiti, M. Calviani, A. Perillo-Marcone, J. M. Heredia, C. Torregrosa, A. Alvaro, F. Berto, Flexible graphite as beam dumping material in the TDE blocks of the large hadron collider, Procedia Structural Integrity 28 (2020) 2228–2234. URL: https://doi.org/10.1016/j.prostr.2020.11.051. doi:10.1016/j.prostr.2020.11.051.
- Jaszak [2020] P. Jaszak, Adaptation of a highly compressible elastomeric material model to simulate compressed expanded graphite and its application in the optimization of a graphite-metallic structure, Journal of the Brazilian Society of Mechanical Sciences and Engineering 42 (2020) 1–22.
- Cermak and Bahrami [2020] M. Cermak, M. Bahrami, Compression behavior of natural graphite sheet, SN Applied Sciences 2 (2020) 1–7.
- AST [2015] ASTM D695-15 Standard Test Method for Compressive Properties of Rigid Plastics (2015) 1–8. doi:10.1520/D0695-15.2.
- ISO 13003:2003 [2013] ISO 13003:2003, Fibre-reinforced plastics - Determination of fatigue properties under cyclic loading conditions, International Standard Organization 3 (2013).
- Barsoum et al. [2004] M. W. Barsoum, A. Murugaiah, S. R. Kalidindi, T. Zhen, Y. Gogotsi, Kink bands, nonlinear elasticity and nanoindentations in graphite, Carbon 42 (2004) 1435–1445. doi:10.1016/j.carbon.2003.12.090.
- Guyer and Johnson [1999] R. A. Guyer, P. A. Johnson, Nonlinear mesoscopic elasticity: Evidence for a new class of materials, Physics Today 52 (1999) 30–36. doi:10.1063/1.882648.
- Sun et al. [2016] Y. Sun, B. Amirrasouli, S. B. Razavi, Q. Li, T. Lowe, P. Withers, The variation in elastic modulus throughout the compression of foam materials, Acta Materialia 110 (2016) 161–174.
- Seldin [1966] E. J. Seldin, Stress-strain properties of polycrystalline graphites in tension and compression at room temperature, Carbon 4 (1966) 177–191. doi:10.1016/0008-6223(66)90079-0.
- Masse et al. [2006] J. P. Masse, L. Salvo, D. Rodney, Y. Bréchet, O. Bouaziz, Influence of relative density on the architecture and mechanical behaviour of a steel metallic wool, Scripta Materialia 54 (2006) 1379–1383. doi:10.1016/j.scriptamat.2005.11.075.
- Afanasov et al. [2009] I. M. Afanasov, D. V. Savchenko, S. G. Ionov, D. A. Rusakov, A. N. Seleznev, V. V. Avdeev, Thermal conductivity and mechanical properties of expanded graphite, Inorganic Materials 45 (2009) 486–490. doi:10.1134/S0020168509050057.
- Pollock M. [2002] Pollock M., GRAFOIL - Flexible graphite - Engineering Design Manual 2nd Edition, 2002.
- Gibson and Ashby [1982] I. Gibson, M. F. Ashby, The mechanics of three-dimensional cellular materials, Proceedings of the royal society of London. A. Mathematical and physical sciences 382 (1982) 43–59.
- Blakslee et al. [1970] O. Blakslee, D. Proctor, E. Seldin, G. Spence, T. Weng, Elastic constants of compression-annealed pyrolytic graphite, Journal of applied physics 41 (1970) 3373–3382.
- Smith and Leeds [1970] W. H. Smith, D. H. Leeds, Pyrolytic graphite, Modern materials 7 (1970) 139–221.
- Balima et al. [2014] F. Balima, S. Le Floch, A. San-Miguel, P. Lindner, A. Brûlet, L. Duclaux, V. Pischedda, Shear effects on expanded graphite under uniaxial pressure: An in situ small angle neutron scattering study, Carbon 74 (2014) 54–62. doi:10.1016/j.carbon.2014.03.002.
- Martoïa et al. [2017] F. Martoïa, L. Orgéas, P. J. Dumont, J. F. Bloch, F. Flin, J. Viguié, Crumpled paper sheets: Low-cost biobased cellular materials for structural applications, Materials and Design 136 (2017) 150–164. URL: https://doi.org/10.1016/j.matdes.2017.09.031. doi:10.1016/j.matdes.2017.09.031.
- Baimova et al. [2014] J. A. Baimova, E. A. Korznikova, S. V. Dmitriev, B. Liu, K. Zhou, Review on crumpled graphene: Unique mechanical properties, Reviews on Advanced Materials Science 39 (2014) 69–83.
- Hui et al. [2013] C. Hui, Y. Zhang, L. Zhang, R. Sun, F. Liu, Crumpling of a pyrolytic graphite sheet, Journal of Applied Physics 114 (2013) 14–18. doi:10.1063/1.4827842.
- Balankin et al. [2015] A. S. Balankin, M. A. Cruz, L. A. Caracheo, O. S. Huerta, C. D. Rivas, C. L. Martínez, D. S. Ochoa, L. M. Ruiz, S. M. Gutiérrez, J. P. Ortiz, M. P. Ortiz, Mechanical properties and relaxation behavior of crumpled aluminum foils, Journal of Materials Science 50 (2015) 4749–4761. doi:10.1007/s10853-015-9030-0.
- Liu et al. [2010] P. Liu, Q. Tan, L. Wu, G. He, Compressive and pseudo-elastic hysteresis behavior of entangled titanium wire materials, Materials Science and Engineering A 527 (2010) 3301–3309. URL: http://dx.doi.org/10.1016/j.msea.2010.02.071. doi:10.1016/j.msea.2010.02.071.
- Tan et al. [2009] Q. Tan, P. Liu, C. Du, L. Wu, G. He, Mechanical behaviors of quasi-ordered entangled aluminum alloy wire material, Materials Science and Engineering: A 527 (2009) 38–44.
- Bouaziz et al. [2013] O. Bouaziz, J. P. Masse, S. Allain, L. Orgéas, P. Latil, Compression of crumpled aluminum thin foils and comparison with other cellular materials, Materials Science and Engineering A 570 (2013) 1–7. doi:10.1016/j.msea.2013.01.031.
- Balankin et al. [2013] A. S. Balankin, A. Horta Rangel, G. García Pérez, F. Gayosso Martinez, H. Sanchez Chavez, C. L. Martínez-González, Fractal features of a crumpling network in randomly folded thin matter and mechanics of sheet crushing, Physical Review E - Statistical, Nonlinear, and Soft Matter Physics 87 (2013) 1–11. doi:10.1103/PhysRevE.87.052806.
- Luo et al. [2011] J. Luo, H. D. Jang, T. Sun, L. Xiao, Z. He, A. P. Katsoulidis, M. G. Kanatzidis, J. M. Gibson, J. Huang, Compression and aggregation-resistant particles of crumpled soft sheets, ACS nano 5 (2011) 8943–8949.
- Cambou and Menon [2011] A. D. Cambou, N. Menon, Three-dimensional structure of a sheet crumpled into a ball, Proceedings of the National Academy of Sciences of the United States of America 108 (2011) 14741–14745. doi:10.1073/pnas.1019192108.
- Cottrino et al. [2014] S. Cottrino, P. Viviès, D. Fabrègue, E. Maire, Mechanical properties of crumpled aluminum foils, Acta Materialia 81 (2014) 98–110. doi:10.1016/j.actamat.2014.07.069.
- Hughes et al. [2019] D. Hughes, E. H. Amalu, T. Pak, R. Kennedy, Effect of relative density on compressive load response of crumpled aluminium foil mesh, Materials 12 (2019). doi:10.3390/ma12234018.
- aba [2022] Abaqus Analysis User’s Manual, version 6. ed., Simulia Dassault Systèmes, 2022.
- Jenkins [1962] G. M. Jenkins, Analysis of the stress-strain relationships in reactor grade graphite, British Journal of Applied Physics 13 (1962) 30–32. doi:10.1088/0508-3443/13/1/307.