+ core structure described with an additional interaction in the nuclear matter saturation region
Abstract
In a phenomenological approach, the + core structure is investigated in the 20Ne, 44Ti, 94Mo, 104Te, and 212Po nuclei through the local potential model using a double-folding nuclear potential with effective nucleon-nucleon interaction of M3Y + type, where the term acts only between the saturation regions of -cluster and core. Properties such as energy levels, -widths, transition rates, and half-lives are calculated, and good level of agreement with experimental data is obtained in general. It is shown the inclusion of the term is determinant for a better description of the experimental energy levels compared to the ground state bands produced with the simple M3Y interaction. The properties calculated for 104Te reinforce the superallowed -decay feature for this nucleus, as indicated in previous studies.
pacs
21.60.GxCluster models and 23.20.-gElectromagnetic transitions and 23.60.+eAlpha decay and 23.20.LvGamma transitions and level energies1 Introduction
The cluster structure of the atomic nucleus has become one of the main topics in nuclear physics. Its applications are seen in the studies on nuclear structure, spectroscopic properties, nuclear reactions, or exotic nuclear decay, and astrophysical phenomena. The cluster models are developed with different configurations, ranging from the binary cluster + core structure to molecular structures based on -particles or -particles + nucleons. Cluster + core binary systems can be investigated by more direct approaches, such as the local potential model (LPM); on the other hand, the cluster structures can be analyzed by microscopic approaches such as the orthogonality condition model (OCM), the antisymmetrized molecular dynamics (AMD), the resonating group method (RGM), the quantum Monte Carlo method (QMC), and others, mainly in light nuclei FHK2018. Different experiments have been carried out to corroborate the theoretical predictions, as shown in recent publications (e.g., TRS2021; WZM2022; BKF2021; DMC2021).
In the last decades, there was an effort by different authors to describe the + core structure through a systematics applicable to a set of nuclei, mainly nuclei with -clustering above double-shell closures (e.g., Refs. BMP95; WPX2013; SMB2019; IMP2019; BR2021; SM2015; M2008; NR2011; SM2021). In general, these works yield satisfactory results for energy spectra, electromagnetic transition rates, -widths, half-lives, and rms charge radii; however, for some nuclear potential forms, the description of energy levels is unsatisfactory, requiring the use of a variable intensity parameter (in most cases, dependent on the angular momentum ) to obtain energy bands closer to the experimental levels. This feature is observed in the energy bands produced by the double-folding nuclear potentials, mainly in the heavier nuclei. Double-folding nuclear potentials are known to be successful in reproducing -nucleus elastic scattering cross sections in a wide range of masses and energies, as shown in several works using the DDM3Y interaction KBL1984; O1995; MKF2013; M2017; AMA1996; however, the double-folding potentials produce energy bands with strong rotational feature, which is incompatible with experimental spectra in many cases; in addition, for heavier nuclei, double-folding potentials can generate very compressed energy bands compared to the experimental levels, making it necessary to use the -dependent intensity parameter.
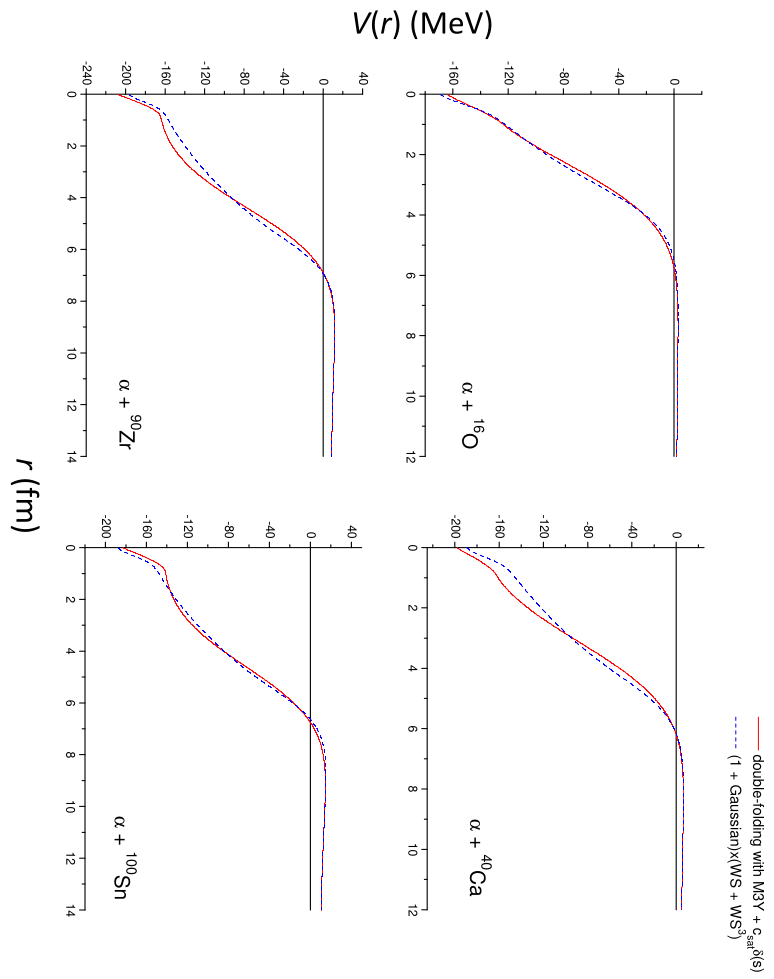
The present authors introduced the use of the (1 + Gaussian)(W.S. + W.S.3) nuclear potential to investigate the + core structure in 46,54Cr SM2017. Subsequently, the (1 + Gaussian)(W.S. + W.S.3) shape was successfully applied to describe the properties of the set {20Ne, 44Ti, 94Mo, 104Te, 212Po} SMB2019 and several even-even nuclei of the region SM2021. The recent work of J. Jia, Y. Qian, and Z. Ren JQR2021 shows that the (1 + Gaussian)(W.S. + W.S.3) potential shape can be successfully applied to heavy nuclei other than 212Po, including the analysis of different cluster structures above 208Pb. Such a potential has the (1 + Gaussian) factor which favors the correct reproduction of the ground state (g.s.) and a better description of the spacing compared to the original W.S. + W.S.3 potential. The (1 + Gaussian) factor produces a depth increase on the W.S. + W.S.3 potential in a region restricted to fm (see Fig. 1), acting more strongly on the spacing; with the inclusion of the centrifugal potential (), the (1 + Gaussian) factor acts more weakly on the levels above . So, the question arises whether the effect produced by the (1 + Gaussian) factor could be described in terms of the effective nucleon-nucleon () interaction, since the double-folding potentials used in previous works do not present such a feature. Furthermore, the reproduction of the (1 + Gaussian) effect on the double-folding potential can provide a more in-depth interpretation of the (1 + Gaussian)(W.S. + W.S.3) potential beyond its properties observed phenomenologically.
The (1 + Gaussian) factor range ( fm) corresponds to the -core separation range in which the central regions of and core overlap. In the central region of the nucleus (cluster or core), it is known that the nuclear matter density approaches or even exceeds the so-called saturation density, fm-3. So, it is coherent to associate the (1 + Gaussian) factor range region with the overlap of and core saturation regions. It should be considered that the superposition of cluster and core mass distributions is an intrinsic property of the double-folding model, as discussed in previous studies on + nucleus collisions and heavy ion collisions KSO1997; Y2016. The assumption of overlap of cluster and core saturation regions can lead to a discussion on the Pauli blocking effect at small internuclear separations SOV2001; however, we restrict this work to a phenomenological approach focused on the systematic description of experimental data.
With such a premise, this work proposes to find a modification in the effective interaction which produces an effect similar to the (1 + Gaussian) factor on the nuclear double-folding potential. In principle, this proposal could be applied to any effective interaction form used in previous studies; starting from a simple option, the well-known M3Y-Reid interaction is chosen for this investigation. The M3Y-Reid effective interaction is based on the -matrix elements of the Reid potential, and was originally developed as the real part of the optical potential for the description of heavy-ion scattering SL1979. Differently from such use, the present work aims to develop a modified interaction for the satisfactory reproduction of energy bands without the use of -dependence, transition rates, -widths and -decay half-lives. Therefore, it is natural that the + core potential proposed in this work presents limitations if applied in the description of scattering data.
The article is developed as follows: in Section 2, a detailed discussion is made on the + core potential adopted for the set {20Ne, 44Ti, 94Mo, 104Te, 212Po}, the proposed effective interaction, the matter density functions for and core, the quantum number applied to the g.s. band of each nucleus, and the similarity between the (1 + Gaussian)(W.S. + W.S.3) potential and the double-folding potential with the proposed modification; in Section 3, the results obtained for energy levels, transition rates, -widths, half-lives, rms intercluster separations, and the reduced -widths are shown, including a comparison of the 104Te reduced -widths and the same quantities obtained for 94Mo and 212Po; conclusions are presented in Section 4.
2 -cluster model
2.1 + core potential
The properties of the nucleus are described in terms of an + core system from the viewpoint of LPM, without considering internal excitations of -cluster and core. The + core interaction is described through the local potential
| (1) |
containing the nuclear and Coulomb terms. The Coulomb potential is that of an -particle interacting with an uniformly charged spherical core of radius ,
| (2) |
where , and are the charge numbers of -cluster and core, respectively. For the parameter , the same values used successfully in the + core potential of Ref. SMB2019 are employed, since that potential also includes a Coulomb term based on a uniformly charged sphere and is applied for the same set of nuclei. The nuclear potential is given by the double-folding form
| (3) |
where , is the intensity parameter, is the effective interaction, and are the nucleon densities of the -cluster and core, respectively.
As discussed in Section 1, it is required that the nuclear potential be such that it becomes more strongly attractive when the saturation regions of -cluster and core overlap, which occurs in a region restricted to fm. Therefore, in the systematics adopted here, we assume that both and core have a central mass region where fm-3. The proposed shape for can be produced by a suitable modification in the effective interaction . In this work, a variation of the traditional M3Y-Reid interaction is employed:
| (4) |
The first three terms of eq. (4) are those present in the original form of M3Y interaction, while the term acts as an attractive interaction only between the saturation regions of -cluster and core. This condition is expressed by:
The values for the parameters , , , and are those applied to the M3Y-Reid interaction: MeV, MeV, fm-1, and fm-1. In the original M3Y form, is a factor smoothly dependent on the bombarding energy of the -particle in the scattering process SL1979; however, several energy levels calculated for 20Ne, 44Ti, and 94Mo are below the + core threshold, making such a dependence on inappropriate in this context. Therefore, we adopted a fixed value MeV, which corresponds to in the original M3Y-Reid form. The parameters and are fitted to precisely reproduce the and levels of the 20Ne, 44Ti, 94Mo, and 212Po g.s. bands11 1 Details on the values of , , and adopted for 104Te are discussed in Section 3.. The values of , and applied to the g.s. bands are shown in Table 1; in addition, this table shows values of the ratio , where is the mass number of the total nucleus. Note the small variation of for the set of nuclei, in the range of approx. 1.21.3 fm, which is compatible with the relation (fm) obtained in Ref. SMB2019. For the negative parity bands, is slightly modified for the correct reproduction of the experimental levels of 20Ne ( MeV) and 44Ti ( MeV), and level of 94Mo ( MeV), while the values of and are those in Table 1 (details in Section 3).
| Nucleus | (MeV) | (fm) | (fm) | ||
|---|---|---|---|---|---|
| 20Ne | 8 | 0.88720 | 3.272 | 1.205 | |
| 44Ti | 12 | 0.79450 | 4.551 | 1.289 | |
| 94Mo | 16 | 0.71560 | 5.783 | 1.272 | |
| 104Te | 16 | 0.65310 | 5.713 | 1.215 | |
| 212Po | 24 | 0.79005 | 7.018 | 1.177 |
In Table 1, it is seen the parameter varies in the range of 0.60.9, being below the range of 1.11.4 applied in similar calculations with the double-folding nuclear potential with DDM3Y interaction O1995; HMS1994; M2017; AMA1996. The use of M3Y interaction generates an unnormalized nuclear potential deeper than that obtained with the DDM3Y interaction, as discussed by Kobos et al. KBH1982, and this behavior extends to the M3Y + interaction; therefore, there is the need for a smaller intensity parameter () to reproduce the energy bands of the nuclei considered.
The calculation of the + core potential depends on determining the density functions and ; moreover, it is necessary to define the saturation region , where fm-3, for the density functions of and core. The radius is determined from the parameter of the (1 + Gaussian)(W.S. + W.S.3) nuclear potential, as detailed in Subsection 2.2. For the -cluster density, the 3-parameter Fermi function
| (5) |
is used, as proposed in Ref. FMR1967 for the -particle charge distribution. The original parameter values fm and are applied, while and are fitted to normalize the total mass to and reproduce the saturation radius in the -cluster mass distribution. For the core density, the Woods-Saxon type function is applied:
| (6) |
For the diffuseness parameter, the typical value fm is used, while and are fitted to normalize the core mass to nucleons and reproduce the saturation radius in the core mass distribution. The values of , , , and applied to the + core systems are shown in Table 2; in addition, this table shows values of the ratio . There is a small variation of for the set of nuclei, in the range of approx. 1.01.1 fm, which is compatible with the relation (fm) expected for the core matter distribution.
| System | (fm-3) | (fm) | (fm-3) | (fm) | (fm) |
|---|---|---|---|---|---|
| O | 0.19170 | 0.3677 | 0.17503 | 2.4400 | 0.968 |
| Ca | 0.19046 | 0.3690 | 0.17059 | 3.5657 | 1.043 |
| Zr | 0.19014 | 0.3693 | 0.17006 | 4.8198 | 1.076 |
| Sn | 0.19082 | 0.3686 | 0.17004 | 5.0062 | 1.079 |
| Pb | 0.19094 | 0.3685 | 0.17000 | 6.4850 | 1.095 |
2.2 Saturation radius
The saturation radius is estimated from the parameter of the (1 + Gaussian)(W.S. + W.S.3) nuclear potential. The factor (1 + Gaussian) has the form , where is one of the fixed parameters of the (1 + Gaussian)(W.S. + W.S.3) potential; this factor approaches a constant value = 1 from . From the viewpoint of the double-folding model, the radius can be interpreted as the cluster-core separation in which the -cluster and core saturation regions begin to overlap, so that the term of the interaction becomes relevant in . Such an interpretation is expressed by
| (7) |
where and are the saturation radii of -cluster and core, respectively. Assuming that and are similar in range, we consider both as a single parameter , resulting in
| (8) |
Using the estimated values for the O, Ca, Zr, Sn, and Pb systems, the respective density functions and are determined. Figure 2 shows the comparison of the functions obtained for 16O, 40Ca, 90Zr, and 208Pb with the respective charge distributions deduced from elastic electron scattering Densities, normalized by the factor. The proximity of the functions and the respective normalized charge distributions is clearly noted, mainly in the nuclear surface region.

2.3 Quantum number
The -cluster nucleons must lie in shell-model orbitals outside the core. This restriction is defined through the global quantum number , where is the number of internal nodes in the radial wave function and is the orbital angular momentum; thus, the restriction is expressed by , where corresponds to the g.s. band. The numbers and 12 are applied to the g.s. bands of 20Ne and 44Ti, respectively, and is applied to 94Mo and 104Te, according to the Wildermuth condition WT1977. is applied to the g.s. band of 212Po, as this number provides a satisfactory reproduction of the experimental energy levels from 0+ to 8+ using the double-folding potential, including the compression trend of the energy spacing from the level. The number has been suitably used in previous work as BMP1991; BMP1992 to describe the -decay half-life of 212Po, using other + core potential shapes.
2.4 Comparison of double-folding and (1 + Gaussian)(W.S. + W.S.3) potentials
Using the methodology proposed in subsections 2.1, 2.2, and 2.3, the + core potential was determined for analysis of 20Ne, 44Ti, 94Mo, 104Te, and 212Po. A comparison of the + core potentials obtained with the double-folding and (1 + Gaussian)(W.S. + W.S.3) nuclear terms is shown in Figure 1 for 20Ne, 44Ti, 94Mo, and 104Te. Note that the two potential forms are similar for the analyzed nuclei, including the fm region where both become more intensely attractive. Therefore, it is shown that the effect of the (1 + Gaussian) factor can be reproduced in the double-folding potential with the proposed modification in the effective interaction. For 212Po, such a comparison is not presented since there is a difference between the number applied in this work with the double-folding potential () and that applied with the (1 + Gaussian)(W.S. + W.S.3) potential in Ref. SMB2019 ().
3 Results
The g.s. bands of 20Ne, 44Ti, 94Mo, and 212Po are calculated with the + core potential defined in Section 2 and the parameter values in Table 1. The resolution of Schrödinger radial equation for the + core relative motion allows to determine the energy levels of the system and respective radial wave functions. Figure 3 shows the comparison of calculated and experimental energy levels. It is shown the + core potential provides a good description of experimental levels from to . For , the description of the experimental levels is rougher, as the double-folding potential produces an energy band with rotational behavior at higher spins for 20Ne, 44Ti, and 94Mo. However, it should be noted that the satisfactory results from to were obtained without using an -dependent intensity parameter. As shown in Figure 3, the double-folding and (1 + Gaussian)(W.S. + W.S.3) potentials produce similar bands for 20Ne, 44Ti, and 94Mo from to , and a more visible difference at , where the (1 + Gaussian)(W.S. + W.S.3) potential gives a better description of the experimental energy levels for 44Ti and 94Mo. In the case of 212Po, the double-folding potential produces an energy band compressed at , which favors a better reproduction of the experimental band compared to the (1 + Gaussian)(W.S. + W.S.3) potential.

In a next calculation, a single value of the parameter is determined for the 20Ne, 44Ti, 94Mo, and 212Po nuclei. For this, is varied to minimize the quantity
| (9) |
for the energy levels from to of the 20Ne, 44Ti, 94Mo, and 212Po g.s. bands. Using this procedure, the value MeV is obtained. In Figure 3, it is seen the bands calculated with the fixed value MeV are still satisfactory in describing the levels from to , showing it is possible to describe the four nuclei through an effective interaction with fixed parameters.
It is interesting to compare the g.s. bands calculated with and without the term of the effective interaction, to verify its level of importance in reproducing the experimental levels. Figure 4 shows the g.s. bands of 20Ne, 44Ti, 94Mo, and 212Po calculated with the effective interactions: M3Y-Reid (applying MeV) and the interaction of eq. (4). In the case of 20Ne and 44Ti, it is seen that the contribution of the term is relevant for a better reproduction of the experimental levels from to . However, in the case of 94Mo, the contribution of the term is more significant, providing a better reproduction of the experimental levels from to and canceling the rotational behavior produced with the M3Y interaction from to . In the case of 212Po, the contribution of the term is evident. For this nucleus, the g.s. band produced with the simple M3Y interaction is very compressed and incompatible with the experimental band; e.g., the calculated level is at MeV, which is far below the respective experimental energy. With the inclusion of the term in the effective interaction, the calculated band provides a good description of the experimental levels from to , also reproducing the compression trend of the experimental band from the level. As the compression of the 212Po calculated band remains above , only the experimental level is more roughly reproduced.

The model also allows the calculation of excited bands of the + core systems. Figure 5 shows the calculated negative parity bands for 20Ne (), 44Ti (), and 94Mo ()22 2 The 94Mo experimental negative parity band presents levels from (5)- ( MeV) to () ( MeV) connected by -transitions ZHG2009; however, the excited state (5)- undergoes a -transition to the state ( MeV) of the g.s. band. As the excited state (5)- does not undergo a transition of type, the band is assumed to be incomplete and the calculation of the corresponding theoretical band is made from . compared to experimental energies. For calculating these bands, the values of the intensity parameter of are: , 0.8050, and 0.7703 for 20Ne, 44Ti, and 94Mo, respectively. The relative variation of from the g.s. band to the negative parity band is very small for 20Ne (1.72 %) and 44Ti (1.32 %), showing the + core potential is weakly dependent on the band number for these two nuclei. In the case of 94Mo, the relative variation of is somewhat greater (7.64 %), and the experimental negative parity band is more compressed compared to the calculated band; however, the calculation for 94Mo should be interpreted as exploratory, since the spins and parities of the considered experimental levels are uncertain.

The g.s. band calculated for 104Te is shown in Fig. 6, case (b). In this calculation, the parameter is fitted to reproduce the energy MeV used in Ref. SMB2019 to describe the ground state of 104Te. In addition, MeV is adopted, since this value proved to be satisfactory for the set {20Ne, 44Ti, 94Mo, 212Po}. As in the other nuclei, the value of used in Ref. SMB2019 for the Coulomb potential is applied ( fm for 104Te). In Fig. 6, the 104Te g.s. band calculated in this work is compared with previous calculations in the excitation energy scale. Note that the energy levels calculated through the double-folding nuclear potential with interaction are close to the respective levels obtained with the (1 + Gaussian)(W.S. + W.S.3) nuclear potential from to , indicating the similarity of the two potential shapes. Furthermore, there is a clear proximity (mainly from to ) between the band calculated with the interaction and the band obtained by Mohr M2007 through the double-folding potential with DDM3Y interaction and -dependent parameter. The band calculated by D. Bai and Z. Ren BR2018 is more compressed and has strongly rotational behavior, which is produced by the double-folding potential with simple M3Y interaction. Also, it is seen the calculation of the present work generates energy spacings and similar to the shell-model calculation without isospin symmetry (SM1) by Jiang et al. JQL201333 3 Ref. JQL2013 presents other shell-model calculations for the 104Te g.s. band, such as the -pair approximation, the -pair approximation and the shell-model calculation with isospin symmetry (SM2); however, such calculations produce results similar to the SM1 calculation shown in Fig. 6.. The evaluation of the calculated energy bands is limited by the absence of experimental data related to the excited states of 104Te; nevertheless, the comparison of the different 104Te theoretical bands indicates the term added to the effective interaction produces an effect on energy levels similar to that generated by the -dependent intensity parameter applied to the double-folding potential (except at the highest spin levels).

The -decay width () of 104Te is calculated by the semi-classical approximation of Ref. GK1987, using an preformation factor ; such an approximation is derived from the two-potential approach GK1987; QRN2011_JPG; QRN2011_PRC, which is often applied in -decay studies. The -decay width obtained for the ground state at MeV is MeV, and the corresponding -decay half-life, given by , is ns. This value is compatible with the experimental measure of Auranen et al. ASA2018 ( ns). By varying the parameter , it is verified that the energy range MeV provides values compatible with the experimental measure, and simultaneously, is compatible with the experimental measure MeV. In agreement with the calculation in Ref. SMB2019, the production of such results with corroborates the indication of superallowed -decay of 104Te by Auranen et al.
The -decay widths calculated for the 20Ne resonant states are shown in Table 3 in comparison with experimental values. The widths are calculated by the semi-classical approximation of Ref. GK1987, except for the level ( MeV), where the -width is calculated by , where is the scattering phase shift for a given , and is the resonance energy. In this calculation, the parameter is smoothly modified so that the experimental energy of the state is reproduced precisely. The values calculated for the and levels of the g.s. band have an order of magnitude above that observed for the respective experimental values; these results repeat a discrepancy found in some previous calculations on 20Ne BMP95; IMP2019; BR2021 with different + core potentials. Concerning the band, the calculated values correctly reproduce the order of magnitude of the experimental -widths of , , , ( MeV), and ( MeV) states. Such results corroborate the statement of previous works BMP95; BJM1995 in which the ( MeV) and ( MeV) states are better candidates for members of the band of the O system; however, it is not excluded that both and both experimental levels in Table 3 can be associated with the theoretical and states of the band.
| (MeV) | (keV) | (keV) | ||
|---|---|---|---|---|
| 8 | 8.7776 | 1.08 | ||
| 8 | 11.951 | 0.74 | ||
| 9 | 5.7877 | 0.061 | ||
| 9 | 7.1563 | 18.5 | ||
| 9 | 10.262 | 302 | ||
| * | 9 | 13.692 | 240 | |
| 9 | 15.366 | 890 | ||
| * | 9 | 17.430 | 37.2 | |
| 9 | 22.87 |
- *
Energy levels not shown in Fig. 5.
Table 4 shows the -decay widths (), -decay widths (), -branching ratios (), and half-lives () calculated for the states from to of the 212Po g.s. band. The values are calculated through eq. (9) of Ref. HMS1994, and the values are calculated by the semi-classical approximation of Ref. GK1987. To calculate , it is necessary to previously determine the transition rates for the 212Po g.s. band; the rates calculated for 212Po are shown in Table 6. Also, the value of depends on the internal conversion coefficient (see values in Table 4), which is obtained from the internal conversion coefficient database KBT2008. An preformation factor % is applied to correctly reproduce the experimental half-life of 212Po in the ground state ( ns); this value is close to the one used by Hoyler, Mohr, and Staudt HMS1994 ( %) for the same nucleus. The -branching ratio is obtained by .
Analyzing the results in Table 4, it is noted the calculated -branching ratios reproduce the order of magnitude of the respective experimental data; in the case of and , such a statement takes into account the proximity between the calculated values and the experimental uncertainty range of %. The half-lives calculated for the , , , and levels also reproduce the order of magnitude of the respective experimental values and, in the cases of and , the calculated values are in complete agreement with the respective experimental data. It should be mentioned that the recent experimental work of von Tresckow et al. TRS2021 presents the measure ns, and the recent experimental work of Karayonchev et al. KRJ2022 presents the measures ps and ns, which are still in good level of agreement with the respective calculated values.
Table 5 shows the rms intercluster separations () and reduced -widths () calculated for the levels from to of the g.s. bands of the studied nuclei. These properties are calculated according to the procedure detailed in Subsection IV.B of our previous work in Ref. SM2015. For obtaining these properties, the parameter is slightly modified (see values in Table 5) so that the radial wave function of each state is calculated at the respective experimental energy, except to 104Te where the intensity parameter has the fixed value mentioned in Table 1; for 20Ne, 44Ti, 94Mo, and 212Po, such a procedure aims to determine the nuclear properties as , , , etc. in correspondence with the experimental energy levels. Analyzing the rms intercluster separations, it is noted that the antistretching effect, which is observed with other + core potential shapes (e.g., SM2015; MOR1998; O1995; M2017; IMP2019), also occurs with the potential proposed in this work; thus, the inclusion of the term in the effective interaction does not change this general property. The reduced -widths, together with the rms intercluster separations, indicate the first levels of each g.s. band have a stronger -cluster character.
| Nucleus | (fm) | (keV) | ||
|---|---|---|---|---|
| 20Ne | 0.8872 | 4.018 | 39.26 | |
| 0.8863 | 4.050 | 43.73 | ||
| 0.8872 | 4.009 | 38.65 | ||
| 0.8765 | 3.971 | 34.19 | ||
| 0.9286 | 3.500 | 6.97 | ||
| 44Ti | 0.7945 | 4.461 | 4.32 | |
| 0.7934 | 4.468 | 4.63 | ||
| 0.7945 | 4.427 | 3.78 | ||
| 0.7999 | 4.316 | 2.16 | ||
| 0.8034 | 4.180 | 1.02 | ||
| 94Mo | 0.71560 | 5.158 | 0.68 | |
| 0.71514 | 5.168 | 0.75 | ||
| 0.71560 | 5.137 | 0.60 | ||
| 0.71473 | 5.067 | 0.37 | ||
| 0.71854 | 4.949 | 0.15 | ||
| 104Te | 0.65310 | 5.469 | 2.00 | |
| 0.65310 | 5.480 | 2.19 | ||
| 0.65310 | 5.447 | 1.79 | ||
| 0.65310 | 5.351 | 1.05 | ||
| 0.65310 | 5.227 | 0.49 | ||
| 212Po | 0.79005 | 6.559 | 0.63 | |
| 0.78920 | 6.577 | 0.72 | ||
| 0.79007 | 6.556 | 0.61 | ||
| 0.78953 | 6.494 | 0.40 | ||
| 0.78940 | 6.405 | 0.21 |
| (W.u.) | ||||||||
| Buck | Ibrahim | Bai & Ren | Wang | Ni & Ren | ||||
| Nucleus | Expt. | This work | et al. BMP95 | et al. IMP2019 | BR2021 | et al. WPX2013 | NR2011 | |
| 20Ne | 20.3(10) | 16.646 | 14.6 | 14.3 | 13.0 | 13.3 | 12.2 | |
| 22(2) | 22.686 | 18.6 | 18.5 | 17.1 | 17.7 | 15.8 | ||
| 20(3) | 21.883 | 14.9 | 15.2 | 15.2 | 15.2 | 13.6 | ||
| 9.0(13) | 10.834 | 7.4 | 7.9 | 7.0 | 8.0 | 6.2 | ||
| 44Ti | 22.2(+22 18) ABS2017 | 11.291 | 11.0 | 10.6 | 9.9 | 10.1 | 9.3 | |
| 30(+4 3) ARB2020 | 15.423 | 14.7 | 14.1 | 13.4 | 13.7 | 12.6 | ||
| 15(+3 2) ARB2020 | 14.662 | 14.1 | 13.2 | 12.7 | 13.4 | 11.8 | ||
| 12.229 | 11.5 | 10.4 | 10.5 | 11.2 | 9.6 | |||
| 94Mo | 16.0(4) | 8.075 | 7.8 | 7.5 | 6.8 | |||
| 26(4) | 11.184 | 10.7 | 10.2 | 9.3 | ||||
| 11.232 | 10.2 | 9.3 | ||||||
| 0.0049(8) | 9.915 | 9.2 | 8.2 | |||||
| 212Po | 2.57(+38 29) | 7.521 | 6.3 | 6.7 | 5.8a | |||
| 9.4(13) TRS2021b | 10.632 | 8.8 | 9.5 | 8.2a | ||||
| 13.2(+49 29)c | 11.035 | 9.1 | 10.0 | 8.5a | ||||
| 4.56(12) | 10.519 | 8.7 | 9.8 | 8.1a | ||||
Table 6 shows the calculated transition rates between the levels from to of the 20Ne, 44Ti, 94Mo, and 212Po g.s. bands. The calculated values are compared with the respective experimental data and results from previous studies BMP95; IMP2019; BR2021; WPX2013; NR2011 in which the + core structure is systematically analyzed for a set of nuclei. The results of the present work provide a good general description of the experimental data, since the order of magnitude of most of the experimental data is reproduced correctly, and concerning the absolute values, there are cases of complete agreement between calculated and experimental values for the transitions: and of 20Ne; of 44Ti; and of 212Po.44 4 The recent experimental works of von Tresckow et al. TRS2021 and Karayonchev et al. KRJ2022 present the measures W.u. and W.u. for 212Po, respectively, which favors the theoretical predictions of Refs. BR2021; WPX2013; NR2011. However, the 2020 212Po experimental data compilation AM2020; ENSDF presents the value W.u. shown in Table 6. Also, in the transition of 20Ne, the calculated value is very close to the uncertainty range of the respective experimental measure. Such results are rewarding, taking into account they were obtained without introducing effective charges. In Table 6, it is seen the values of the present work are considerably higher than those obtained in Refs. BMP95; IMP2019; BR2021; WPX2013; NR2011 with different + core potentials; consequently, the values of this work are somewhat closer to the experimental data in most transitions. Thus, the results favor the + core interpretation for 20Ne, 44Ti, 94Mo, and 212Po by the methodology proposed here.
Table 7 presents the reduced -widths calculated for the g.s. band of 212Po with . The alternative use of for 212Po aims at a comparison with the (212Po) results obtained with and shown in Table 5. Using the (104Te) values, the ratios (104Te)/(94Mo), (104Te)/(212Po) with = 22, and (104Te)/(212Po) with = 24 were calculated (see Table 7). The (104Te)/(94Mo) values of this work are considerably higher than those shown in Ref. SMB2019, where the reduced -widths were obtained with the (1 + Gaussian)(W.S. + W.S.3) potential; however, it should be taken into account that small variations on the length or height of the Coulomb barrier can produce strong variations in the values. The use of produces values lower than in the case of , resulting in higher (104Te)/(212Po) ratios for . The (104Te)/(212Po) ratios in Table 7 are lower than those obtained in Ref. SMB2019; however, the calculation of Ref. SMB2019 applies , which naturally contributes to higher values of (104Te)/(212Po). Even with such quantitative differences, the calculations of the present work reinforce the interpretation of Ref. SMB2019 in which 104Te has a substantially higher degree of -clustering compared to 94Mo and 212Po. Such results also corroborate the analysis of Auranen et al. ASA2018 based on experimental 104Te -decay data.
| (212Po; ) | ||||
|---|---|---|---|---|
| (keV) | [] | [] | ||
| 0.393 | 2.935 | 5.092 | 3.196 | |
| 0.451 | 2.906 | 4.849 | 3.050 | |
| 0.379 | 2.990 | 4.712 | 2.918 | |
| 0.241 | 2.863 | 4.369 | 2.619 | |
| 0.119 | 3.261 | 4.092 | 2.319 |
4 Summary and conclusions
This work shows a systematic study of the + core structure in 20Ne, 44Ti, 94Mo, 104Te, and 212Po nuclei using a double-folding nuclear potential with effective interaction of M3Y + type, where the term acts only between the and core saturation regions. Using this nuclear potential plus the Coulomb term, a good description of the experimental g.s. bands of 20Ne, 44Ti, 94Mo, and 212Po is obtained, mainly from to . With a slight variation of the intensity parameter, the experimental negative parity bands of 20Ne and 44Ti are well reproduced. It is shown the additional term of the effective interaction is determinant for a better reproduction of the experimental levels, and produces an effect similar to the (1 + Gaussian) factor of the (1 + Gaussian)(W.S. + W.S.3) nuclear potential employed in previous works SM2017; SMB2019; SM2021; JQR2021.
The proposed potential is used to analyze the resonant energy levels of 20Ne and 212Po, and the -decay half-life of 104Te. Concerning 20Ne, the widths calculated for the negative parity band reproduce the order of magnitude of most experimental data. In the case of 212Po, the -branching ratios and half-lives calculated for the g.s. band reproduce the order of magnitude of the experimental data with a preformation factor %, and there is complete agreement with the experimental half-lives of the and states. With respect to 104Te, the model shows agreement with the experimental measurements of and in the energy range using an preformation factor ; this result corroborates the indication of superallowed -decay of 104Te in previous studies.
The transition rates calculated for the g.s. bands of 20Ne, 44Ti, 94Mo, and 212Po present a good level of agreement with the experimental data, as the order of magnitude of most experimental rates is reproduced correctly, and there is complete agreement with the experimental data in some transitions without the use of effective charges. The results of the present work are somewhat closer to the experimental rates than other systematic calculations on the + core structure in previous studies.
The calculated reduced -widths are used to determine the ratios (104Te)/(94Mo), (104Te)/(212Po) with , and (104Te)/(212Po) with ; the obtained values reinforce the interpretation of Souza et al. SMB2019 in which 104Te has an -clustering degree substantially higher than 94Mo and 212Po, and corroborate the analysis by Auranen et al. ASA2018 based on experimental 104Te -decay data.
In conclusion, the double-folding nuclear potential with M3Y + effective interaction provides a good general description of energy levels, rates, -widths and -decay half-lives through a systematics applied to the set {20Ne, 44Ti, 94Mo, 104Te, 212Po}. Additionally, this calculation allows reproducing the effect of the (1 + Gaussian) factor of the (1 + Gaussian)(W.S. + W.S.3) nuclear potential from the viewpoint of the double-folding model. The successful use of the term in the effective interaction suggests the importance of a further discussion on this phenomenological approach in terms of subnucleonic interactions.
Acknowledgements.
The authors thank the HPC resources provided by Information Technology Superintendence (HPC-STI) of University of São Paulo. Support from Instituto Nacional de Ciência e Tecnologia – Física Nuclear e Aplicações (INCT-FNA) is acknowledged.References
- (1) M. Freer, H. Horiuchi, Y. Kanada-En’yo, D. Lee, and Ulf-G. Meißner, Rev. Mod. Phys. 90, 035004 (2018).
- (2) Ma. von Tresckow, M. Rudigier, T. M. Shneidman, Th. Kröll, M. Boromiza, C. Clisu, et al., Phys. Lett. B 821, 136624 (2021).
- (3) Yuan-Zhe Wang, Song Zhang, Yu-Gang Ma, Phys. Lett. B 831 137198 (2022).
- (4) S. Bailey, T. Kokalova, M. Freer, C. Wheldon, R. Smith, J. Walshe, N. Soić, L. Prepolec, V. Tokić, F. M. Marqués, L. Achouri, F. Delaunay, M. Parlog, Q. Deshayes, B. Fernández-Dominguez, and B. Jacquot, Eur. Phys. J. A 57, 108 (2021).
- (5) Pingal Dasgupta, Guo-Liang Ma, Rupa Chatterjee, Li Yan, Song Zhang, and Yu-Gang Ma, Eur. Phys. J. A 57, 134 (2021).
- (6) B. Buck, A.C. Merchant, and S.M. Perez, Phys. Rev. C 51, 559 (1995).
- (7) S. M. Wang, J. C. Pei, and F. R. Xu, Phys. Rev. C 87, 014311 (2013).
- (8) M. A. Souza, H. Miyake, T. Borello-Lewin, C. A. da Rocha, and C. Frajuca, Phys. Lett. B 793, 8 (2019).
- (9) Dongdong Ni and Zhongzhou Ren, Phys. Rev. C 83, 014310 (2011).
- (10) M. A. Souza and H. Miyake, Phys. Rev. C 104, 064301 (2021).
- (11) T. T. Ibrahim, A. C. Merchant, S. M. Perez, and B. Buck, Phys. Rev. C 99, 064332 (2019).
- (12) Dong Bai and Zhongzhou Ren, Phys. Rev. C 103, 044316 (2021).
- (13) M. A. Souza and H. Miyake, Phys. Rev. C 91, 034320 (2015).
- (14) P. Mohr, The Open Nucl. & Particle Phys. Journal 1, 1 (2008).
- (15) A. M. Kobos, B. A. Brown, R. Lindsay, and G. R. Satchler, Nucl. Phys. A 425, 205 (1984).
- (16) S. Ohkubo, Phys. Rev. Lett. 74, 2176 (1995).
- (17) P. Mohr, G. G. Kiss, Zs. Fülöp, D. Galaviz, Gy. Gyürky, and E. Somorjai, At. Data and Nucl. Data Tables 99, 651 (2013).
- (18) P. Mohr, Eur. Phys. J. A 53, 209 (2017).
- (19) U. Atzrott, P. Mohr, H. Abele, C. Hillenmayer, and G. Staudt, Phys. Rev. C 53, 1336 (1996).
- (20) M. A. Souza and H. Miyake, Eur. Phys. J. A 53, 146 (2017).
- (21) Jianghua Jia, Yibin Qian, and Zhongzhou Ren, Phys. Rev. C 104, L031301 (2021).
- (22) Dao T. Khoa, G. R. Satchler, and W. von Oertzen, Phys. Rev. C 56, 954 (1997).
- (23) Y. Sakuragi, Prog. Theor. Exp. Phys. 2016, 06A106 (2016).
- (24) V. B. Soubbotin, W. von Oertzen, X. Viñas, K. A. Gridnev, and H. G. Bohlen, Phys. Rev. C 64, 014601 (2001).
- (25) G. R. Satchler and W. G. Love, Phys. Rep. 55, 183 (1979).
- (26) A. M. Kobos, B. A. Brown, P. E. Hodgson, G. R. Satchler, and A. Budzanowski, Nucl. Phys. A 384, 65 (1982).
- (27) R. F. Frosch, J. S. McCarthy, R. E. Rand, and M. R. Yearian, Phys. Rev. 160, 874 (1967).
- (28)
Nuclei Charge Density Archive, and references therein. http://discovery.phys.virginia.edu/research/
groups/ncd/index.html - (29) K. Wildermuth and Y.C. Tang, A Unified Theory of the Nucleus (Academic Press, New York, 1977).
- (30) B. Buck, A.C. Merchant, and S.M. Perez, J. Phys. G: Nucl. Part. Phys. 17, 1223 (1991).
- (31) B. Buck, A.C. Merchant, and S.M. Perez, Phys. Rev. C 45, 2247 (1992).
- (32) P. Mohr, Eur. Phys. J. A 31, 23 (2007).
- (33) Dong Bai and Zhongzhou Ren, Eur. Phys. J. A 54, 220 (2018).
- (34) H. Jiang, C. Qi, Y. Lei, R. Liotta, R. Wyss, and Y. M. Zhao, Phys. Rev. C 88, 044332 (2013).
- (35) ENSDF: Evaluated Nuclear Structure Data File, and references therein. https://www.nndc.bnl.gov/ensdf
- (36) Y. H. Zhang, M. Hasegawa, W. T. Guo, M. L. Liu, X. H. Zhou, G. de Angelis, T. M. Axiotis, A. Gadea, N. Marginean, Martinez, D. R. Napoli, C. Rusu, Zs. Podolyak, C. Ur, D. Bazzacco, F. Brandolini, S. Lunardi, S. M. Lenzi, R. Menegazzo, R. Schwengner, A. Gargano, W. von Oertzen, and S. Tazaki, Phys. Rev. C 79, 044316 (2009).
- (37) S.A. Gurvitz and G. Kalbermann, Phys. Rev. Lett. 59, 262 (1987).
- (38) Yibin Qian, Zhongzhou Ren, and Dongdong Ni, J. Phys. G: Nucl. Part. Phys. 38, 015102 (2011).
- (39) Yibin Qian, Zhongzhou Ren, and Dongdong Ni, Phys. Rev. C 83, 044317 (2011).
- (40) K. Auranen, D. Seweryniak, M. Albers, A. D. Ayangeakaa, S. Bottoni, M. P. Carpenter, et al., Phys. Rev. Lett. 121, 182501 (2018).
- (41) B. Buck, J. C. Johnston, A. C. Merchant, S. M. Perez, Phys. Rev. C 52, 1840 (1995).
- (42) D.R. Tilley, C.M. Cheves, J.H. Kelley, S. Raman, and H.R. Weller, Nucl. Phys. A 636, 249 (1998).
- (43) F. Hoyler, P. Mohr and G. Staudt, Phys. Rev. C 50, 2631 (1994).
- (44) T. Kibédi, T.W. Burrows, M.B. Trzhaskovskaya, P.M. Davidson, and C.W. Nestor Jr., Nucl. Instr. and Meth. in Phys. Res. A 589, 202 (2008); http://bricc.anu.edu.au
- (45) V. Karayonchev, G. Rainovski, J. Jolie, A. Blazhev, A. Dewald, A. Esmaylzadeh, C. Fransen, P. John, L. Knafla, D. Kocheva, K. Schomacker, V. Werner, and H. Naïdja, Phys. Rev. C 106, 064305 (2022).
- (46) XUNDL: Experimental Unevaluated Nuclear Data List Search and Retrieval, and references therein. https://www.nndc.bnl.gov/xundl
- (47) F. Michel, S. Ohkubo, and G. Reidemeister, Prog. Theor. Phys. Suppl. 132, 7 (1998).
- (48) K. Arnswald, T. Braunroth, M. Seidlitz, L. Coraggio, P. Reiter, B. Birkenbach, et al., Phys. Lett. B 772, 599 (2017).
- (49) K. Arnswald, P. Reiter, A. Blazhev, T. Braunroth, A. Dewald, M. Droste, C. Fransen, A. Goldkuhle, R. Hetzenegger, R. Hirsch, E. Hoemann, L. Kaya, L. Lewandowski, C. Müller-Gatermann, P. Petkov, D. Rosiak, M. Seidlitz, B. Siebeck, A. Vogt, D. Werner, K. Wolf, and K.-O. Zell, Phys. Rev. C 102, 054302 (2020).
- (50) K. Auranen and E. A. McCutchan, Nucl. Data Sheets 168, 117 (2020).