An ADMM approach for multi-response regression with overlapping groups and interaction effects
Abstract
In this paper, we consider the regularized multi-response regression problem where there exists some structural relation within the responses and also between the covariates and a set of modifying variables. To handle this problem, we propose MADMMplasso, a novel regularized regression method. This method is able to find covariates and their corresponding interactions, with some joint association with multiple related responses. We allow the interaction term between covariate and modifying variable to be included in a (weak) asymmetrical hierarchical manner by first considering whether the corresponding covariate main term is in the model. For parameter estimation, we develop an ADMM algorithm that allows us to implement the overlapping groups in a simple way. The results from the simulations and analysis of a pharmacogenomic screen data set show that the proposed method has an advantage in handling correlated responses and interaction effects, both with respect to prediction and variable selection performance.
Key Words: pliable lasso, Lagrange multipliers, drug sensitivity, interactions, tree lasso, overlapping groups.
1 Introduction
The pliable lasso (plasso) (Tibshirani and Friedman 2020) allows one to solve problems involving main effects and their corresponding interaction effects. Let represent the response from a linear regression model with observations, be the matrix of covariates with entries and be the matrix for the modifying variables with entries for , , . Let be the column of , be the column of and be an -vector of ones. The pliable lasso model is given as
| (1) |
where , is matrix of parameters with row and individual entries , is a matrix formed by multiplying each column of component-wise with the column vector and . The objective function of model (1) is given as
| (2) |
where and are tuning parameters, both . The model assumes an asymmetric weak hierarchy constraint which is introduced as an overlapping group in the first term of the penalty. The constraints ensure that the interaction term can be nonzero only if the corresponding main term is nonzero. Even though the idea is still young, it has been applied in different areas, for example to multinomial logistic regression (Asenso et al. 2022b), Cox’s proportional hazards model (Du and Tibshirani 2018) and support vector machines (Asenso et al. 2022a). However, in all the above studies, the block-wise coordinate descent procedure was used in solving the problem which includes overlapping groups. The algorithm involves multiple “if” statements and a generalized gradient at the final stage. This implies that extending the model to a multi-response case would require rigorous computations like the case of Li et al. 2015 Li et al. 2015, which might be difficult to handle.
In this paper, we introduce the alternating direction method of multipliers (ADMM) to handle this problem and extend the results from the single response model to a multi-response problem. We provide a publicly available software package MADMMplasso (Asenso and Zucknick 2022) implemented in R. We present a brief review on the ADMM algorithm in what follows.
1.1 A gentle introduction to ADMM
Details of the results in this section can be obtained from the works of Boyd et al. 2011, Ye et al. 2011b, Deng et al. 2013, Han and Yuan 2012, Humayoo and Cheng 2019a and Haris et al. 2016. Here we give a brief introduction to the ADMM algorithm. Given a separable objective function
| (3) |
where and are both convex, closed and proper, by introducing an auxiliary variable , ADMM allows (3) to be re-written as
| (4) |
The problem in (4) can have a corresponding augmented Lagrangian in the form
| (5) |
where is the augmented Lagrangian parameter or the multiplier. It has been established that the ADMM algorithm converges to the global optimum, under few simple conditions. The algorithm begins with initial parameters and in each step , with indexing the iterations, the ADMM algorithm updates and in an alternating or sequential manner in the following way until the convergence condition is met.
| (6) |
The algorithm meets the convergence condition if and , where and , representing the dual and primal residuals respectively. The augmented Lagrangian parameter can either be fixed or allowed to change by using the rule:
| (7) |
The method has received attention (for example in the works of Anbari et al. 2014, Ye et al. 2011a, Goldstein et al. 2014, Han and Yuan 2012, Humayoo and Cheng 2019b and Qin and Goldfarb 2012) and has been applied to different optimisation problems including lasso and group lasso and a possibility to include overlapping groups which was introduced in the work of Deng et al. 2013. In this paper, we study the possible application of the ADMM algorithm to handle the overlapping groups in the pliable lasso objective function.
The rest of the paper is organized as follows. In section (2), we present two ADMM algorithms. The first algorithm is an ADMM version of the original pliable lasso linear model. We show that ADMM can handle the overlapping groups in the objective function and will result in the same solution as using the block-wise coordinate descent method in the original pliable lasso paper. The second algorithm is to solve a multi-response problem that has the pliable lasso penalty, and in addition a penalty to consider the correlation between the responses. We assume that the correlation between the response follows a hierarchical tree structure and the responses form groups at various levels within the hierarchy. This implies that each response could belong to several groups, hence the need to allow for overlapping groups. In section (3) and (4), we show both the simulations and a real data application, respectively of the proposed method. Section (5) is for the conclusion.
2 Method
2.1 Model for single response
Let be a matrix of coefficients, with rows and columns indexed from to and to respectively, representing the combination of and with the row of B defined as . We can reconstruct the problem in (1) using array notations. Let be an array constructed as follows for , ,
| (8) |
then equation (1) is equivalent to the model solution
| (9) |
where is the matrix of the coefficients and denotes the vector whose element takes the form
| (10) |
In equation (10) above, . By using (9), the objective function of the pliable lasso model in (2) can be rewritten as
| (11) |
Here, the largest group is of the size (to represent ) and there are two groups (with elements ). Also, represents the row of without the first element i.e, without the coefficient of the main effect . In what follows in this section, we abuse notation and write unless otherwise stated. Let be the groupings of , where with is an index set corresponding to the group, and , which is a row vector, denotes the subvector of indexed by and represents the size of . This implies that . To solve the problem (11), we introduce 2 auxiliary variables as follows; we introduce a matrix , with each row vector , defined for the two groups , and let , as a row vector. This is constructed for the overlapping group part of the pliable lasso penalty and let us note that and and . The second auxiliary variable, is introduced to handle the -penalty term. By introducing these auxiliary variables in problem (11), we obtain the following optimization problem:
| (12) |
The augmented Lagrangian can be written as
| (13) |
where and are the Lagrange multipliers associated with and respectively and denotes the matrix inner product.
2.1.1 Updates for the ADMM algorithm
In each iteration, the algorithm will update and alternatively until the stopping conditions are met. We show the various updates in what follows:
- 1.
update: We begin by showing how is constructed. Let with each row of , defined as for and elsewhere, with rows indexed by such that and . For example given and knowing that in each are two groups (with elements ), will be represented as a matrix with elements,
(14) From (14) above, will have elements , which is the same as the original elements , which is an expansion of . The update for is given as
(15) where is the row of with individual elements . Let and define as the partial residual with the group removed, where we have represented as . Further computations will show that,
(16) - 2.
update: From (13), we can update by solving the problem
(17) This can be simplified as
(18) Further computations similar to the group lasso problem (Li et al. 2015; Deng et al. 2013) will show that (18) has a closed form solution by the soft threshold formula
(19) - 3.
update: To update , we should note that we added the main effect to the vector in the previous updates. However, since we wish to avoid the effect of the -norm on it, we remove the penalty effect here. The component of the optimization problem (13) is updated as
(20) which can further be expressed as
(21) Further computations similar to the lasso problem (Tibshirani 1996; Hastie et al. 2015) will show that
(22) where .
- 4.
and updates: The two Lagrange multipliers (), associated with the penalties in (13) are updated as follows;
(23)
2.2 Extension to multi-response model
With the motivation from the model for a single-response variable, we proceed to propose an ADMM method for a multi-response model, where the response variables are assumed to have some correlation structures. The section begins with the model formulation in what follows. Let represent the response from a regression model with number of observations, with each observation having responses, be the matrix of covariates with entries and be the matrix for the modifying variables with entries for , , . Let be the column of , be the column of and be an -vector of ones. The pliable lasso problem in (1) can be extended to a multi-response model with interaction effect, where each response can be modeled as
| (24) |
with and is a matrix formed by multiplying each column of component-wise with the column vector . The parameter is a vector of intercepts for the main effect, is the matrix of coefficients for the modifying variable with each column represented by , is a matrix of coefficients for the main effect with each row represented by , having individual entries , is a array of size with each element having matrix where each row of the matrix is represented by . Let be an array of size with each representing a matrix of coefficients for the main and interaction effects for response , with rows and columns indexed from to and to , respectively. This is to cater for the combination of and with the row of defined as . We can reconstruct the equation (24) using array notations. Let be an array with same construction as (8), then the model for all responses in equation (24) is equivalent to the model
| (25) |
We will abuse notation to define to denote the matrix whose element takes the form
| (26) |
The objective function for a general multi-response pliable lasso model can be written as
| (27) |
Here also, the largest group is of the size (to represent ) and there are two groups (with elements ). Also, represents the row of without the first element i.e, without the coefficient of the main effect .
2.2.1 Multi-response pliable lasso with tree-guided structure
The problem (27) can be solved as a single-response problem with interaction effects where each of the responses could be treated as independent of the others. However, in our case, we assume correlation among the response variables. To handle this correlation, we allow the response variables to form overlapping groups and having a structure, specifically a tree-like structure in this paper. More details about the tree-like structure can be found in the paper “Tree-guided group lasso for multi-response regression with structured sparsity, with an application to EQTL mapping” (Kim and Xing 2012) and similar structures can also be found in Li et al. 2015 and in Zhao and Zucknick 2020.
We represent the set of internal and leaf nodes of the tree as , of size and respectively, the group of responses forming an internal node as , where and let denotes the sub-vector of , indexed by with a group weight . Each sub-vector has elements . Adding the overlapping groups in the responses to the problem (27) gives us
| (28) |
The first penalty terms ensure that correlated responses are penalized within groups while ensuring sparsity among the coordinate and the second penalty term is the pliable lasso part to ensure that main and interaction effects are considered in a hierarchical format.
To solve the problem (28) by the ADMM approach, we introduce four auxiliary variables as follows. Let be the matrix with each to represent the groups formed by internal nodes on the coordinate , and being the block representation of group and equal to . This is defined for the overlapping groups in the responses for with . Note that we have defined to contain both the main effect and the interaction effect of each , hence each row of can be seen as having columns. We also introduce an array to handle the -penalty of the leaf node () in (28).
In what follows in this section, we abuse notation and write unless otherwise stated. Let be the grouping of elements of , where with is an index set corresponding to the group, and which is a row vector, denotes the subvector of , indexed by and represents the size of . We introduce the second auxiliary variable as an array of size with each of the index having a matrix , with each row vector , defined for the two groups . This is for the overlapping part of the pliable lasso penalty and let us note that and and . Also, let and be formed with elements from such that each row is .
Finally, we introduce an array to handle the -penalty of the pliable lasso. Implementing these auxiliary variables on problem (28) leads to the following;
| (29) |
In the above, is the component of each and since it is a leaf node, each will have a single element. Therefore the penalty can be rewritten as which is just a further shrinkage on each . The augmented Lagrangian form of (29) can be written as
| (30) |
In the problem (30) above, have the same dimensions as and respectively, and are called the Lagrange multipliers and is a penalty parameter.
2.2.2 Update for the ADMM algorithm
Just like for the single-response problem, the algorithm will update and alternatively in each iteration until the stopping criteria are met. We show the various updates in what follows:
- 1.
update: We begin by showing the construction of and . Let with each row of , defined as for and elsewhere, with rows indexed by such that and . Also, let with , and for and otherwise, indexed by such that and . An example of these two constructions is shown in (14). Note that we have written the matrix in the construction of above as a transformation of the array such that, each column (of matrix ) is a vectorized version of the matrix of the array . The component of (30) is updated as follows;
(31) Let denote the -dimensional matrix of and let , with each column being an column vector. Taking the derivative of (31) with respect to and equating to zero gives
(32) and we have allowed to represent for the sake of simplicity and is a vectorized form of . The resulting which is a vector, is then transformed into a matrix of dimension . To construct in (32), we first defined as the diagonal of and to be the diagonal of which has elements . Then we defined to be an array of size with each being a diagonal matrix with the first elements equal to and the to elements equal to since the elements of . This construction is to cater for the groupings within the responses and within each coordinate .
- 2.
update: from (30), we update by solving the problem
(33) With some few computations, this can be simplified as
(34) Further computations similar to the group lasso problem will show that,
(35) - 3.
update: The component of the optimization problem (30) is updated as
(36) which can further be expressed as
(37) Further computations, similar to the lasso problem will show that,
(38) - 4.
update: The component of the optimization problem (30) is updated as
(39) which can be simplified as
(40) Further computations, by following the group lasso example will show that,
(41) - 5.
update: The component of the optimization problem (30) is updated as
(42) which can be simplified as
(43) Further computations, by following the group lasso example will show that,
(44) - 6.
and updates: The three Lagrange multipliers, associated with the penalties in (30) are updated as follows;
(45)
3 Simulations
This section entails the simulation studies for our proposed model. In the first part, we show the results for the single-response problem. We compare the ADMM pliable lasso algorithm to the original pliable lasso implementation, which uses the block-wise coordinate descent (BCD) method. The second part of the simulation studies is dedicated to the multi-response problem. We compare our proposed method with the tree lasso and the original pliable lasso which assumes that the multiple responses are independent. For the original pliable lasso, we allowed each response to be modeled one at a time, since there is no multi-response version implemented.
3.1 Simulation of a single-response problem
We generated data with , or , and standard Gaussian independent predictors. The generative model is given as
| (46) |
Here, and is matrix such that and . The training, validation and test error plots are shown in figure (1). We find that both the proposed approach and the original plasso, which uses the coordinate descent method, give similar results. We should note here that our main purpose for the single response ADMM approach is to show how the algorithm can be used to effectively handle the overlapping group penalty in the problem.


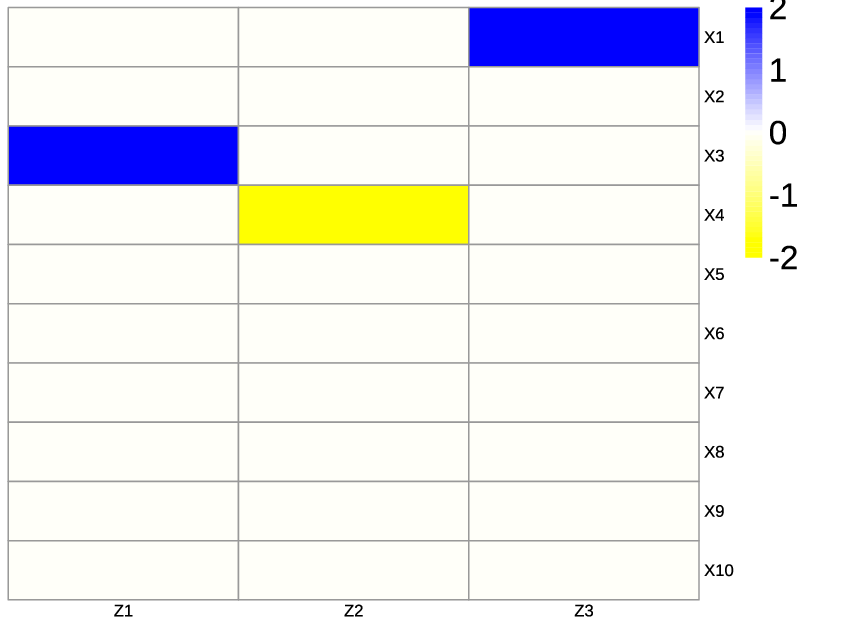
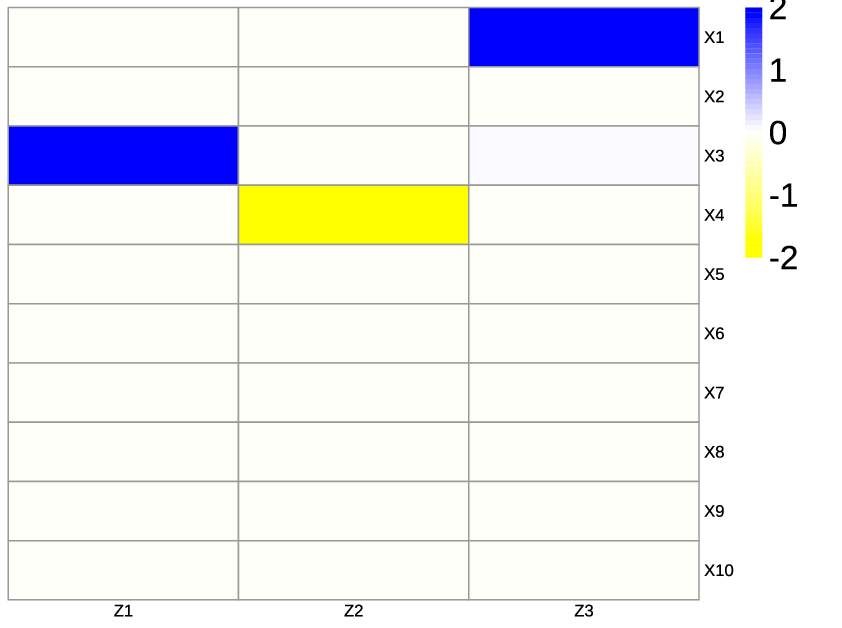
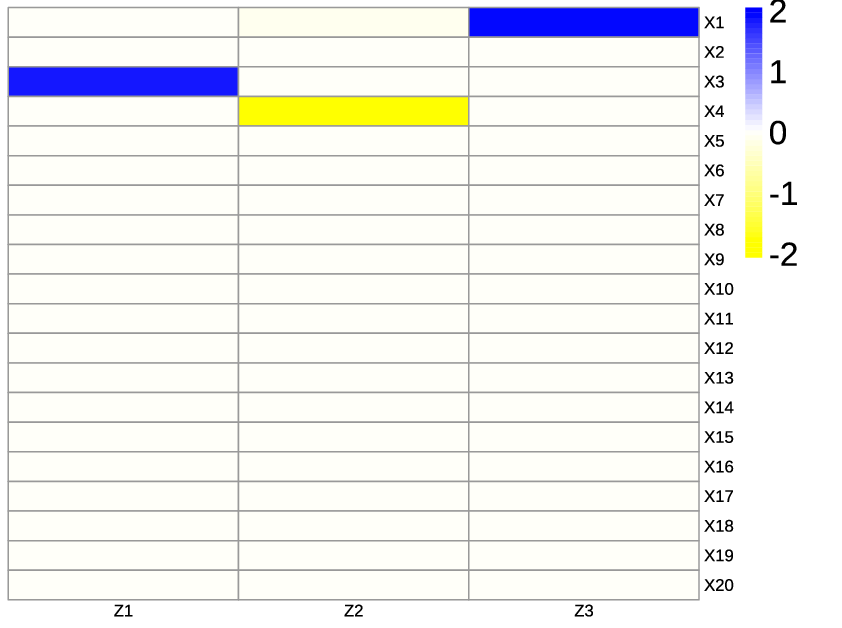
Figures (2) and (4) show the results for the selected coefficients along the path for ADMM, and the BCD for and , respectively, after implementing them on the model (46). The figures (3) and (5) show the matrix plot of the observed and the predicted coefficients of the interaction effects. We can see that our proposed algorithm is able to identify the true non-zero main effects as well as the non-zero interaction effects for model (46) starting from a position where all s are zero.




3.2 Simulation of a multi-response problem
To see the performance of the proposed method for the multi-response problem, we simulated two different datasets; one with a weak hierarchical structure within the response variables and the other with a strong hierarchical structure. Both datasets were allowed to have both main effects and interactions with a modifying variable .
3.2.1 Simulation 1
For the first simulation, we generated a multi-response problem with responses, observations, main effects and modifying variables. Both and were generated as standard Gaussian independent predictors. We allowed each response to have five non-zero main coefficients and also allowed four s in each response to have interactions with four s. The error term, was added to each response and we generated the responses from
| (47) |
We averaged the results over 10 simulations and compared our work with that of the tree lasso, which has been made available in R in the package ‘mixlasso’ version 0.1 available on Github (https://github.com/zhizuio/mixlasso) and the pliable lasso (Tibshirani and Friedman 2020) package (‘pliable’ version 1.1.1) also available in CRAN archive (https://cran.r-project.org/src/contrib/Archive/pliable/). To allow the tree lasso model to include the modifying variable, we allowed the modifier to be included without any penalty. This option has been made available in the mixlasso R package by selecting method="tree-lasso" and num.nonpen=K.


The structure of the response variables is shown in figure (6(a)). The summary of the results is shown in table (1), where we summarize the sensitivity (the proportion of non-zero coefficients correctly estimated as non-zeros), specificity (the proportion of zero-coefficients correctly estimated as zeros), the total number of the estimated non-zero coefficients (out of ) and the test error measured as the mean squared error on a separate test data with , and . It can be seen that our proposed model performs best in this case in terms of the test error (from figure (6(b))). In this setting with weak hierarchical structure in the response, the pliable lasso model performed better than tree lasso, indicating that the correctional structure in the responses is not so important. By looking at the averaged absolute errors of estimated coefficients () in table (1), it can be seen that the proposed model also performs best in terms of the accuracy of coefficients matrix estimation and variable selection for this particular case.
| Model | Sensitivity1 | Specificity2 | Non-zero3 | Test error (SD)4 | |
|---|---|---|---|---|---|
| Plasso | 0.021 | 1 | 0.763 | 733 | 19.693 (2.408) |
| Tree lasso | 0.066 | 1 | 0.142 | 2577 | 34.045 (1.802) |
| MADMMplasso | 0.006 | 1 | 0.991 | 237 | 5.050 (0.681) |
- 1
Sensitivity is the proportion of non-zero coefficients estimated as non-zeros.
- 2
Specificity is the proportion of zero-coefficients estimated as zeros.
- 3
The total number of non-zero coefficients in the model. We counted the coefficients with at least two non-zero values across the 10 simulations.
Number of non-zero coefficients . Note that the selection is out of features in total.
- 4
The MSE on an independent test dataset. We include the standard deviation (SD) across the 10 simulations.

Figure (7) shows the structure of the main effect coefficients () and how they correlate across the responses. It can be seen that our proposed model is able to recover the true relevant covariates for correlated responses significantly better than other methods. The plasso model seem not to handle the groups well since it not able to borrow statistical strength across different responses. Even though the tree lasso does well in recovering the groups, it seem to have a lot of false positives than our proposed model.
3.2.2 Simulation 2
For the second simulation in this section, we generated a multi-response problem with responses (imagined to be responses of cancer cells to drugs), observations (e.g. different cancer cell lines), or (e.g. gene expression variables characterizing the different cancer cell lines) and (e.g. cancer tissue type). The idea is to simulate a drug sensitivity response model that includes interaction effects to allow the cancer tissue types to modify the effects of gene expression features. was generated as standard Gaussian independent predictors to represent the gene expression features and the was was generated using the binomial distribution to represent the presence or absence of a certain tissue. The interaction in this scenario was to allow for inclusion of tissue effect, where we have assumed that certain drugs work best on specific tissues. The error term, was added to each response and we generated the drug sensitivity using the model
| (48) |
We generated by following the example in Zhao and Zucknick 2020. However, since we have only one source of data in , we decided to only use the first part of their matrix. To do this, we generated from the multivariate normal distribution with zero mean and non-diagonal covariance matrix . The covariance matrix has as the covariance of features and the remaining part being set to zero. We set , , and the variance of each feature is one. We averaged the results over 10 simulations and compared our work with that of the tree lasso and the pliable lasso. To allow the tree lasso model to include the modifying variable, we allowed the modifier to be included without any penalty. This option has been made available in the mixlasso R package selecting method="tree-lasso" and num.nonpen=K.


The structure of the response variables is shown in figure (8(a)). The results are shown in table (2), where we summarize the sensitivity, specificity, the total number of non-zero coefficients (out of ) and the test error measured as the mean squared error on a separate test dataset. Our proposed model performs best in this case in terms of the test error (in figures (8(b)) and (8(c))). In this setting with strong hierarchical structure in the responses, the tree lasso performs better than the pliable lasso, indicating the importance of the groups within the responses.
By looking at the the averaged absolute errors of estimated coefficients () in table (2), we see that the proposed model also performs best in terms of the accuracy of coefficients matrix estimation and variable selection for this particular case.
| Model | Sensitivity1 | Specificity2 | Non-zero3 | Test error (SD)4 | |
|---|---|---|---|---|---|
| Plasso | 0.034 | 1 | 0.446 | 2155 | 2.512 (0.181) |
| Tree lasso | 0.036 | 1 | 0.345 | 2483 | 2.072 (0.095) |
| MADMMplasso | 0.0299 | 1 | 0.727 | 2014 | 1.972 (0.112) |
| Plasso | 0.014 | 0.994 | 0.814 | 2514 | 4.57 (1.038) |
| Tree lasso | 0.023 | 1 | 0.360 | 7826 | 2.927 (0.163) |
| MADMMplasso | 0.010 | 1 | 0.912 | 1891 | 2.230 (0.116) |
- 1
Sensitivity is the proportion of non-zero coefficients estimated as non-zeros.
- 2
Specificity is the proportion of zero-coefficients estimated as zeros.
- 3
The total number of non-zero coefficients in the model. We counted the coefficients with at least two non-zero values across the 10 simulations.
Number of non-zero coefficients . Note that the selection is out of (for ) or (for ) features in total.
- 4
The MSE on an independent test dataset. We included the standard deviation (SD) across the 10 simulations.

Figure (9) shows the structure of the main effect coefficients () and how they correlate across the responses. It is clear that the tree lasso and our proposed method are able to recover the true relevant covariates for correlated responses significantly better than the pliable lasso even though the tree lasso seems to have rather more false positives (also see table 2).
4 Genomics of drug sensitivity in cancer (GDSC) data analysis
We obtained this data set from the archives of the GDSC database (ftp://ftp.sanger.ac.uk/pub4/cancerrxgene/releases/release-5.0/) (Yang et al. 2012). The data set contains 97 cancer drugs tested on 498 cell lines. The cell lines are representations of 13 cancer tissues. The drug responses were summarized by the logarithm of the half maximal inhibitory concentration, i.e. , estimated from the dose-response curves that measured drug response at specific drug concentrations in terms of normalized relative cell viability. The data set also contains gene expression features and other genomic data such as DNA copy numbers and mutations. In our experiment, we preselected 2602 gene expression features that explain of the variation as and represented the cancer types in a 12-column matrix of dummy variables as . We further selected seven drugs for illustrative purpose. The structure of the drugs is shown in figure (10(a)).


We randomly split the data into training and testing data and a high-dimensional multi-response regression model was fit using the training data, where was the values. We performed this procedure repeatedly on 10 random splits and present the average of the results. We show the efficiency our model by comparing with the tree lasso (using the mixlasso R package) and the pliable lasso. To allow the tree lasso to include the modifying variable, we allowed the cancer types to be included without any penalization. To use the pliable lasso, we modeled each response separately. The summary of the results for the 10 random splits is shown in table (3) and in figures (10(b)) and (10(c)). We find that the proposed model performs best in terms of prediction error on the test data. The proposed model is able to combine the information from the various cancer types with corresponding gene expression features to determine which drug will be suitable for each cancer type. It also borrows statistical strength from the correlations that exist among the responses. This is very essential in the area of drug discoveries where it important to identify individual drugs or groups of drugs that could be helpful in treating specific cancers and subtypes of cancers.
| Model | Non-zero coefficients1 | Test error (SD)2 |
|---|---|---|
| Plasso | 724 | 3.648 (0.270) |
| Tree lasso | 1016 | 3.404 (0.268) |
| MADMMplasso | 1424 | 3.227 (0.267) |
- 1
The number of non-zero coefficients in the model. We counted the coefficients with at least two non-zero values across the 10 repeated data splits. Number of non-zero coefficients
Note that the selection is out of features in total.
- 2
The MSE on an independent test data. We included the standard deviation (SD) across the 10 repeated data splits.
In figure (11), we show the prediction performance of the three models. We can see from the plots that all the models perform averagely well in terms of predicting the individual response variables . However, by looking at figure (10(c)) which gives the averages of the test errors for the individual drugs we see that our proposed approach performs best in terms of prediction error.
Further analyses on the proposed model are shown in figures (12) (for individual drugs) and (13)11 1 This was generated by using the R package “EnrichIntersect” created by Zhao et al. 2022,Zhao et al. 2022. (for all drugs together). These plots show the selected interactions between gene expression features and cancer types. We show the relationship between the identified genes (those considered to interact with cancer types), the cancer types and the associated drugs, identified by the model to be linked to specific cancer types. We note here that the gene expression features shown in the plots are only those that interact with at least one cancer type. It can be seen that not all the seven drugs were identified to be linked to specific cancer types. Specifically, methotrexate was not found by the model to be associated with a specific cancer type as no interactions between cancer type and gene expression features were selected in the MADMMplasso model for this drug. This is as expected as methotrexate is a generic chemotherapy agent that does not target specific molecular features or pathways in the cell. One of the interesting drugs identified is nilotinib which is associated with blood cancers, specifically it is a is a Bcr-Abl tyrosine kinase inhibitor which targets chronic myelogenous leukemias (CML) with the Philadelphia chromosome. A common gene associated with blood cancers as identified by all the three models is the suppressor of cytokine signaling 2 (SOCS2). In figure (12), we can see that this gene is seen to interact with the blood cancer type. In fact,SOCS2 is highly expressed in many of the blood cancer cell lines in this data set. Studies have shown that SOCS2 is involved in the signal transduction cascades in CML cells (Schultheis et al. 2002). From the GDSC data set, we also realized that most of the cell lines with high expression of SOCS2 and having low score of for nilotinib are CML tumors. This provides evidence that the proposed model can help in identifying genes that are associated with diseases and their corresponding drugs in drug discoveries.
We see from figure (13) that the total number of identified interactions is quite small. Most interactions are observed for the blood cancer type. Blood cancers are biologically quite different from solid tumours, and the interaction effects allow the MADMMplasso model to modify the gene expression effect estimates to allow different effects for blood cancer compared to the solid tumours. Most interaction effects with the blood cancer type are identified for the nilotinib and axitinib drug response variables. This makes sense as both these drugs are Bcr-Abl tyrosine kinase inhibitor which are only applied to chronic myelogenous leukemias with Bcr-Abl mutations.


5 Conclusion
In this paper, we proposed a novel regularized regression method, which we named the MADMMplasso, to represent a multi-response pliable lasso regression model in combination with an ADMM algorithm for model fitting. This method is able to find covariates and their corresponding interactions with modifying variables , with some joint association with multiple related responses. The joint association takes into consideration the correlational structure in the response variables, assumed to form some overlapping groups, and specifically in this paper a hierarchical tree structure. We allowed the interaction term to be included in an asymmetrical weak hierarchical manner by first considering whether the corresponding main term is in the model. For optimization, we implemented an ADMM algorithm that allowed us to model the overlapping groups in a simple way. The results from the simulations and from the application to a pharmacogenomic screening dataset show that the ability of the proposed method to account for correlated responses and to include interaction effects can result in a clear improvement in prediction and variable selection performance. An implementation of the package is available on Github through the link https://github.com/ocbe-uio/MADMMplasso and the version used throughout this paper is 1.0.0.
Acknowledgements
This work received funding from the European Union’s Horizon 2020 Research and Innovation program, under the Marie Skłodowska-Curie Actions Grant, agreement No. 801133 (Scientia fellowship), and under grant agreement No. 847912 (“RESCUER”).
References
- Anbari et al. [2014] M. E. Anbari, S. Alam, and H. Bensmail. Cofadmm: A computational features selection with alternating direction method of multipliers. Procedia Computer Science, 29:821–830, 2014. ISSN 1877-0509. https://doi.org/10.1016/j.procs.2014.05.074. URL https://www.sciencedirect.com/science/article/pii/S1877050914002518. 2014 International Conference on Computational Science.
- Asenso and Zucknick [2022] T. Q. Asenso and M. Zucknick. MADMMplasso, 12 2022. URL https://github.com/ocbe-uio/MADMMplasso.
- Asenso et al. [2022a] T. Q. Asenso, P. Wang, and H. Zhang. Pliable lasso for the support vector machine. Communications in Statistics - Simulation and Computation, 0(0):1–13, 2022a. 10.1080/03610918.2022.2032160. URL https://doi.org/10.1080/03610918.2022.2032160.
- Asenso et al. [2022b] T. Q. Asenso, H. Zhang, and Y. Liang. Pliable lasso for the multinomial logistic regression. Communications in Statistics - Theory and Methods, 51(11):3596–3611, 2022b. 10.1080/03610926.2020.1800041. URL https://doi.org/10.1080/03610926.2020.1800041.
- Boyd et al. [2011] S. Boyd, N. Parikh, E. Chu, B. Peleato, J. Eckstein, et al. Distributed optimization and statistical learning via the alternating direction method of multipliers. Foundations and Trends® in Machine learning, 3(1):1–122, 2011.
- Deng et al. [2013] W. Deng, W. Yin, and Y. Zhang. Group sparse optimization by alternating direction method. In Wavelets and Sparsity XV, volume 8858, pages 242–256. SPIE, 2013.
- Du and Tibshirani [2018] W. Du and R. Tibshirani. A pliable lasso for the cox model, 2018.
- Goldstein et al. [2014] T. Goldstein, B. O’Donoghue, S. Setzer, and R. Baraniuk. Fast alternating direction optimization methods. SIAM Journal on Imaging Sciences, 7(3):1588–1623, 2014. 10.1137/120896219. URL https://doi.org/10.1137/120896219.
- Han and Yuan [2012] D. Han and X. Yuan. A note on the alternating direction method of multipliers. Journal of Optimization Theory and Applications, 155(1):227–238, 2012.
- Haris et al. [2016] A. Haris, D. Witten, and N. Simon. Convex modeling of interactions with strong heredity. Journal of Computational and Graphical Statistics, 25(4):981–1004, 2016. 10.1080/10618600.2015.1067217. URL https://doi.org/10.1080/10618600.2015.1067217. PMID: 28316461.
- Hastie et al. [2015] T. Hastie, R. Tibshirani, and M. Wainwright. Statistical Learning with Sparsity: The Lasso and Generalizations. Chapman & Hall/CRC, 2015. ISBN 1498712169, 9781498712163.
- Humayoo and Cheng [2019a] M. Humayoo and X. Cheng. Parameter estimation with the ordered 2 regularization via an alternating direction method of multipliers. Applied Sciences, 9(20):4291, oct 2019a. 10.3390/app9204291. URL https://doi.org/10.3390%2Fapp9204291.
- Humayoo and Cheng [2019b] M. Humayoo and X. Cheng. Parameter estimation with the ordered regularization via an alternating direction method of multipliers. Applied Sciences, 9(20), 2019b. ISSN 2076-3417. 10.3390/app9204291. URL https://www.mdpi.com/2076-3417/9/20/4291.
- Kim and Xing [2012] S. Kim and E. P. Xing. Tree-guided group lasso for multi-response regression with structured sparsity, with an application to eqtl mapping. The Annals of Applied Statistics, 6(3):1095–1117, 2012. ISSN 19326157, 19417330. URL http://www.jstor.org/stable/41713516.
- Li et al. [2015] Y. Li, B. Nan, and J. Zhu. Multivariate sparse group lasso for the multivariate multiple linear regression with an arbitrary group structure. Biometrics, 71(2):354–363, 2015.
- Qin and Goldfarb [2012] Z. T. Qin and D. Goldfarb. Structured sparsity via alternating direction methods. Journal of Machine Learning Research, 13(5), 2012.
- Schultheis et al. [2002] B. Schultheis, M. Carapeti-Marootian, A. Hochhaus, A. Weisser, J. M. Goldman, and J. V. Melo. Overexpression of SOCS-2 in advanced stages of chronic myeloid leukemia: possible inadequacy of a negative feedback mechanism. Blood, 99(5):1766–1775, 03 2002. ISSN 0006-4971. 10.1182/blood.V99.5.1766.
- Tibshirani [1996] R. Tibshirani. Regression shrinkage and selection via the lasso. Journal of the Royal Statistical Society. Series B, 58(1), 1996.
- Tibshirani and Friedman [2020] R. Tibshirani and J. Friedman. A pliable lasso. Journal of Computational and Graphical Statistics, 29(1):215–225, 2020. 10.1080/10618600.2019.1648271. URL https://doi.org/10.1080/10618600.2019.1648271.
- Yang et al. [2012] W. Yang, J. Soares, P. Greninger, E. J. Edelman, H. Lightfoot, S. Forbes, N. Bindal, D. Beare, J. A. Smith, I. R. Thompson, S. Ramaswamy, P. A. Futreal, D. A. Haber, M. R. Stratton, C. Benes, U. McDermott, and M. J. Garnett. Genomics of Drug Sensitivity in Cancer (GDSC): a resource for therapeutic biomarker discovery in cancer cells. Nucleic Acids Research, 41(D1):D955–D961, 11 2012. ISSN 0305-1048. 10.1093/nar/gks1111. URL https://doi.org/10.1093/nar/gks1111.
- Ye et al. [2011a] G. Ye, Y. Chen, and X. Xie. Efficient variable selection in support vector machines via the alternating direction method of multipliers. In G. Gordon, D. Dunson, and M. Dudík, editors, Proceedings of the Fourteenth International Conference on Artificial Intelligence and Statistics, volume 15 of Proceedings of Machine Learning Research, pages 832–840, Fort Lauderdale, FL, USA, 11–13 Apr 2011a. PMLR. URL https://proceedings.mlr.press/v15/ye11a.html.
- Ye et al. [2011b] G.-B. Ye, Y. Chen, and X. Xie. Efficient variable selection in support vector machines via the alternating direction method of multipliers. In Proceedings of the Fourteenth International Conference on Artificial Intelligence and Statistics, pages 832–840. JMLR Workshop and Conference Proceedings, 2011b.
- Zhao and Zucknick [2020] Z. Zhao and M. Zucknick. Structured penalized regression for drug sensitivity prediction. Journal of the Royal Statistical Society: Series C (Applied Statistics), 69(3):525–545, 2020.
- Zhao et al. [2022] Z. Zhao, M. Zucknick, and T. Aittokallio. EnrichIntersect: an R package for custom set enrichment analysis and interactive visualization of intersecting sets. Bioinformatics Advances, 2(1), 09 2022. ISSN 2635-0041. 10.1093/bioadv/vbac073. URL https://doi.org/10.1093/bioadv/vbac073.