Activity Recognition from Newborn Resuscitation Videos
Abstract
Objective: Birth asphyxia is one of the leading causes of neonatal deaths. A key for survival is performing immediate and continuous quality newborn resuscitation. A dataset of recorded signals during newborn resuscitation, including videos, has been collected in Haydom, Tanzania, and the aim is to analyze the treatment and its effect on the newborn outcome. An important step is to generate timelines of relevant resuscitation activities, including ventilation, stimulation, suction, etc., during the resuscitation episodes. Methods: We propose a two-step deep neural network system, ORAA-net, utilizing low-quality video recordings of resuscitation episodes to do activity recognition during newborn resuscitation. The first step is to detect and track relevant objects using Convolutional Neural Networks (CNN) and post-processing, and the second step is to analyze the proposed activity regions from step 1 to do activity recognition using 3D CNNs. Results: The system recognized the activities newborn uncovered, stimulation, ventilation and suction with a mean precision of 77.67 %, a mean recall of 77,64 %, and a mean accuracy of 92.40 %. Moreover, the accuracy of the estimated number of Health Care Providers (HCPs) present during the resuscitation episodes was 68.32 %. Conclusion: The results indicate that the proposed CNN-based two-step ORAA-net could be used for object detection and activity recognition in noisy low-quality newborn resuscitation videos. Significance: A thorough analysis of the effect the different resuscitation activities have on the newborn outcome could potentially allow us to optimize treatment guidelines, training, debriefing, and local quality improvement in newborn resuscitation.
Index Terms:
Newborn Resuscitation, Automatic Video Analysis, Object Detection, Activity Recognition, Deep Learning, Convolutional Neural NetworksI Introduction
In 2017 the average global mortality rate for newborns was 18 deaths per 1000 live births [1]. Low- and middle-income countries account for 99 % of deaths for neonates under four weeks of age [2]. Birth asphyxia is one of the leading causes of neonatal deaths, and mortality rates due to this complication have not seen the same rate of improvement as other common causes of newborn mortality [3]. The immediate presence of properly trained and equipped Health Care Providers (HCPs) lessens these preventable newborn deaths [4]. The main therapeutic resuscitation activities for birth asphyxia in this setting comprise the following; positive pressure ventilations using a Bag-Mask Resuscitator (BMR), stimulation, suction using a Suction Device (SD), and keeping the newborn warm using a blanket [5].
The collaborative research and development project Safer Births11 1 www.saferbirths.com aims to establish new knowledge and develop new products to support HCPs in low resource countries with the purpose of saving more lives at birth. Since 2013 the project has been collecting various data during newborn resuscitation episodes at Haydom Lutheran Hospital in Tanzania. The acquired data, such as ECG, flow during ventilation, videos, and the newborn outcome, can be used to gain critical insight into the effects of the different resuscitation activities, as well as facilitating ongoing training of HCPs, debriefing, and continuous quality improvement. This could be achieved by creating activity timelines from the collected data and study them together with information on the condition of the newborn during resuscitation, found from the ECG, and the resuscitation outcome.

An activity detector based on signals from a Heart Rate Sensor (HRS), (which is a prototype of the NeoBeat22 2 https://laerdalglobalhealth.com/products/neobeat-newborn-heart-rate-meter/), previously proposed by our research group in Vu et al., separated the activities stimulation, chest compressions and other with a precision of 78.7 % [7]. Automatic analysis of video collected during newborn resuscitation could be utilized to potentially improve the precision achieved by using HRS signals, as well as to detect activities and information when the HRS signals are not available. In addition, video analysis could also allow us to detect activities that are difficult or impossible to obtain from ECG and accelerometer measurements.
Video analysis of newborn resuscitation episodes has been documented to have a positive effect on both evaluation and training purposes [8, 9, 10, 11]. However, such analysis involves manual inspection, which are both time-consuming and entails privacy issues. Hence, it would be beneficial to perform the analysis automatically.
Automatic video analysis and activity recognition using deep learning models has become very popular in the last few years. However, recognizing temporal information in an image series is a far more complex problem than recognizing spatial information in individual images. Quite recently DeepMind33 3 https://deepmind.com/ and Carreira et. al [12] proposed a two-stream activity recognition network, I3D, that utilized CNNs and transfer learning to achieve state-of-the-art results on the activity recognition dataset UCF-101. I3D is based on a 3D inflated version of the well-known CNN Inception v1 [13], and Carreira et. al demonstrated that 3D CNNs can benefit from pre-trained 2D CNNs, and that transfer learning is highly efficient also in activity recognition.
In 2016 Guo et al. proposed an automatic activity detection system for newborn resuscitation videos [14]. The system was based on a pre-trained Faster RCNN network and the person class was used to detect the newborn and finding the region of interest. Further, linear Support-Vector Machines (SVMs) were trained on individual video frames to perform activity recognition. In our dataset the newborn is covered with a sheet most of the time, making a person detection not the best approach. We have chosen a different approach that we consider more suited for our dataset and the activities we want to detect - which are not necessarily newborn position-dependent. Our approach for activity recognition is to learn deep neural networks to recognize the typical movement for an activity by utilizing sequential frames instead of individual frames in the activity analysis, e.g. the BMR used in ventilation has to be in a correct position and squeezed in order to be assigned to the activity class. This approach is also more suited for our low-quality videos where it can be difficult to detect activities from individual frames due to motion blurring. The proposed system consist of the main parts; Object detection, Region proposal, Activity recognition, Activity timelines, and is named ORAA-net for short. We consider it as being a two-step approach where the first step comprise the OR, i.e detect and track relevant objects and propose regions surrounding them, and the second step comprise the AA i.e activity recognition and the generation of the activity timelines.
Results from the first step in the ORAA-net was presented in [6]. The step utilized the YOLOv3 [15] object detection architecture and subsequent post-processing to propose regions surrounding the objects throughout the resuscitation videos. The performance of the object region proposal during activities was 97 % on ventilation, 100 % on attaching or removing the heart rate sensor, and 75 % on suctioning. Additionally, the number of HCPs present in the image frames were estimated with a performance of 71 %. Potential for improvement for object detection, particularly in the detection of the suctioning device, was however recognized.
In this paper, we present results from step two of the ORAA-net. Short sequences from the proposed regions are used as input to I3D models trained to recognize the different resuscitation activities and to generate activity timelines. Besides, the paper also presents improvements of the ORAA-net‘s first step, which has been attained through experiments with three additional state-of-the-art object detection networks, and by proposing a method for finding the region surrounding the newborn.
The paper uses several acronyms and the most commonly used are listed below for increased readability.
| Term | Acronym |
|---|---|
| Heart Rate Sensor | HRS |
| Bag-Mask Resuscitator | BMR |
| Suction Device | SD |
| Health Care Provider | HCP |
| Health Care Provider Hand | HCPH |
| Inception 3D | I3D |
| Linear Frame Interpolation | LFI |
| YOLOv3 [15] | RetinaNet [16] | SSD MultiBox [17] | Faster R-CNN [18] | ||||
| Base CNN | Darknet53* | Optional (ResNet-50) | VGG-16* | Optional (ResNet-50) | |||
| Approach | One-stage | One-stage | One-stage | Two-stage | |||
| Feature pyramid network | Yes | Yes | No | No | |||
| # Feature map scales | 3 | 5 | 6 | 1 | |||
| Anchors | 9 | 9 | 6 | 9 | |||
| Hard negative mining | No | No | Yes | No | |||
| Classification loss function |
|
Focal loss |
|
| |||
| Regression loss function |
|
Smooth L1 | Smooth L1 | Smooth L1 |
II Objectives
We aimed to recognize the following therapeutic activities, provided in this setting and known to affect the condition of a newborn during resuscitation [5]:
- •
Uncovered - the newborn is not covered by a blanket.
- •
Stimulation - thoroughly drying and rubbing the newborn.
- •
Ventilation - positive pressure ventilation using a BMR.
- •
Suction: removal of liquid from the mouth/airways using a SD, where in this datamaterial the Penguin44 4 https://laerdalglobalhealth.com/products/penguin-newborn-suction/ is used.
In addition, we also aim to recognize other activities and parameters that could be of interest:
- •
Attaching/adjusting HRS - relevant for the analysis of the ECG signals collected by the HRS.
- •
Remove HRS - relevant for the analysis of the ECG signals collected by the HRS.
- •
Number of HCPs treating the newborn - might have an impact on the newborn outcome.
Uncovered and Stimulation could be detected by analyzing an area around the newborn, Ventilation, Suction, Attaching/adjusting HRS, and Remove HRS by tracking the objects BMR, SD, and HRS, and by analyzing their surrounding areas, and finally, Number of HCPs by counting the number of detected HCPH.
III Data material
The dataset was collected at Haydom Lutheran Hospital in Tanzania using Laerdal Newborn Resuscitation Monitor (LNRM) [7] and with cameras mounted over the resuscitation tables. The dataset contains 481 newborn resuscitation episodes with video, LNRM data, state of the newborn during resuscitation, and information on the newborn outcome. The videos only include the time period when a newborn is placed on the resuscitation table and the duration of the videos range from 1-60 minutes with a median duration of approximately 7 minutes. In this work, 96 randomly selected videos from the dataset were used to develop and evaluate the performance of the proposed system. The LNRM signals were recorded by measuring signals with a BMR and a HRS, both connected to the LNRM. The HRS of the LNRM is an early version of the NeoBeat55 5 https://laerdalglobalhealth.com/products/neobeat-newborn-heart-rate-meter/. The recorded videos were not initially intended for automatic video analysis, but rather as support material for human interpretation when needed. As a consequence, no standardization in camera type and camera settings were applied. The videos are recorded with different kinds of low-quality cameras and have variable frame rates - ranging from 0.5-30 fps, resolutions, focus settings and quality. Furthermore, there are also variations in the position of the mounted cameras and in light settings in the labor rooms. These variations make it more challenging to perform object detection and activity recognition.
IV Methods
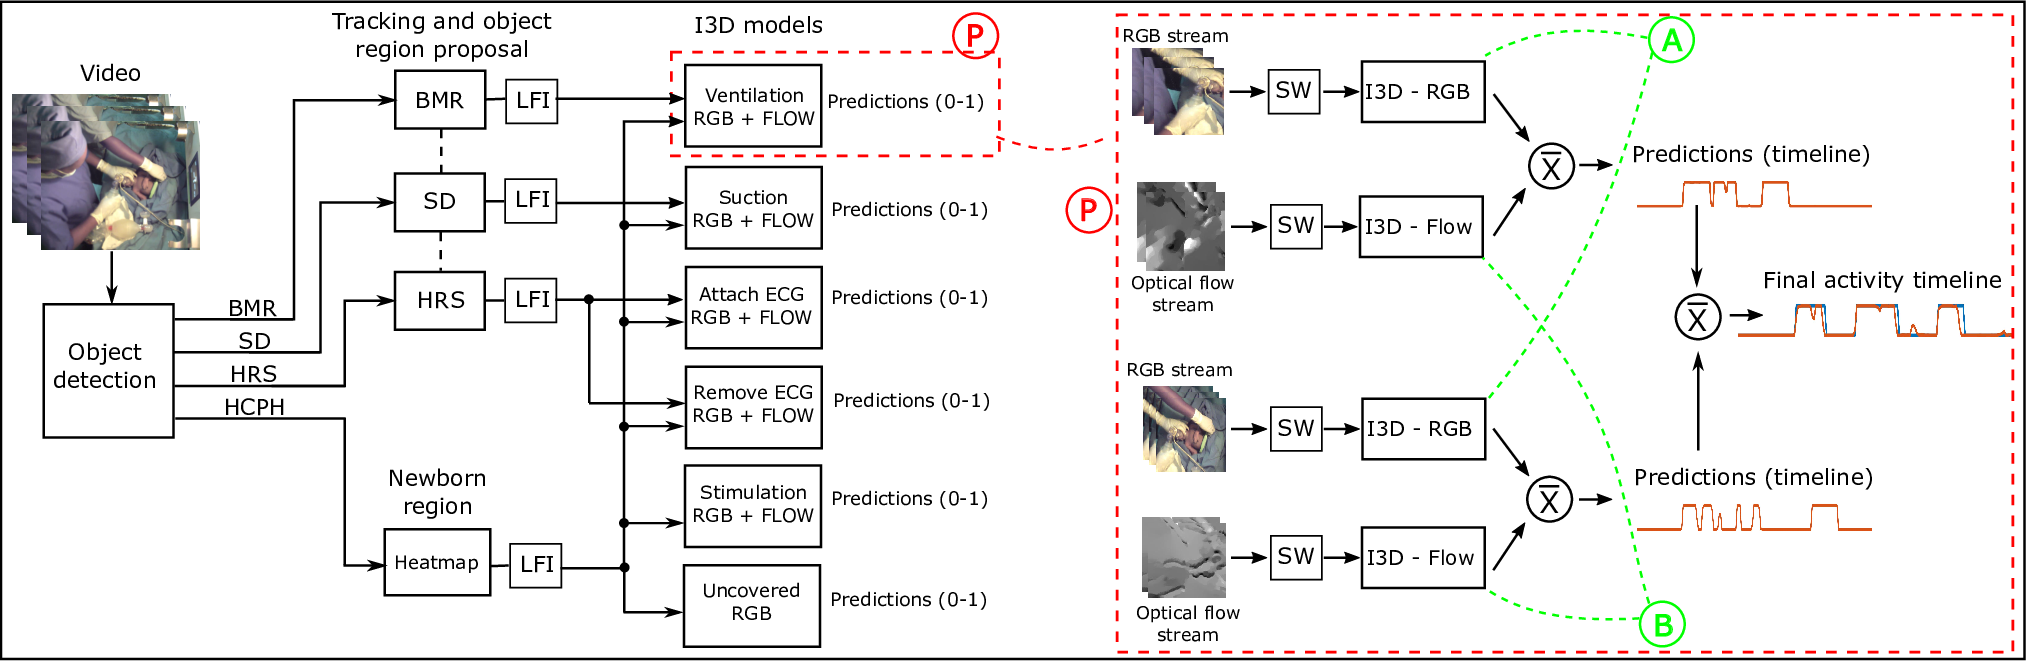
An overview of the proposed ORAA-net is illustrated in Figure 1. The system is divided into 2 main steps - 1 - object detection and region proposal, and 2 - activity recognition and timeline generation, and they are explained seperately in the following.
IV-A ORAA-net Step 1 - Object Detection and Region Proposal
In our previous work we achieved encouraging results using the YOLOv3 architecture as the object detector on the presented dataset and challenge [6]. However, especially the small SD, (labled SP in [6]) had improvement potential. In this work we implement, further trained and tested RetinaNet [16], SSD MulitBOx [17] Faster R-CNN [18], in addition to YOLOv3 [15] on our dataset to find the best solution for step 1 (see Figure 1). A comparison of the main features of the object detection networks considered in this work are shown in Table I.
Object tracking and region proposal of the class BMR, SD and HRS are performed on the object detection results as follows:
- •
Localize the most likely true object position in each image using the object detections probability scores.
- •
Fill detection gaps by choosing the previous detected value.
- •
Remove short peaks by checking, in time, if a rapid position change is an actual large position change or if the position quickly returns to the same area as prior to the change.
- •
Signal smoothing using a moving average filter.
- •
Region proposal for further activity analysis. 500 500 pixel regions around the tracked objects as shown in Figure 1, step 1.
This is consistent with the method we proposed in [6], were more details can be found.
In this work, we propose an additional region of interest to further analyze; the newborn region. Analyzing this region would make it possible to detect the activities which are not object dependent, like if the newborn is covered or not. Moreover, the newborn region may also allow us to recognize object dependent activities for cases where the object tracking is poor.
For each episode, a fixed newborn region is found by first generating a heatmap of the whole image, , where and are pixel coordinates. The are initialized with zeros, and for each detection of a HCPH a value of 1 is added to the pixel area of the detection. Denote to represent the pixel area of each detected HCPH, , of the total HCPH detections, , in frame :
and For do:
| (1) |
The fixed and squared newborn region with size pixels, is selected by finding the and that
| (2) |
where and . An example of the generated heatmap with its proposed region is shown in Figure 2.

IV-B ORAA-net Step 2 - Activity Recognition and Activity Timelines
Dataset pre-processing
An important step in activity recognition is to ensure that the data is of sufficient quality. This is especially important in our case where the video frame rates range from 0.5-30 fps. For videos with a very low frame rate it is difficult to separate the repetitive activities we are searching for, such as stimulation, where the HCP typically rubs the baby‘s back, from random movements. We have observed that for frame rates below 5 fps it can be very difficult to identify stimulations even by careful visual inspection. Thus, only videos with frame rates 5 fps are included in the dataset for training. Videos with frame rates of 5 fps or lower accounts for 27 % of the original dataset and the distribution of average fps for all videos can be seen in Figure 3.

Thereafter, a pre-processing step is performed to convert the videos, now ranging from 5-30 fps, to a fixed and adequate frame rate. Although videos with frame rate below 5 fps are now removed, many of the remaining videos are still of low quality. Thus, advanced up-sampling techniques that include motion analysis and require a certain frame rate, would not be well-suited, and a simple Linear Frame Interpolation (LFI) [19] technique is chosen for the up-sampling. The artifacts from the LFI have a visual appearance similar to the blurring in some of the videos. To represent the implementation of the LFI technique, first let f(t) be a frame at time from the original video. Given frames at times and we construct a new frame for time () by:
| (3) |
where
| (4) |
and where , and .
Activity Recognition
For the activity recognition in step two of the ORAA-net, we have chosen to use multiple versions of the Inception 3D (I3D) architecture proposed by Carreira et. al [12]. The I3D is a state-of-the-art activity recognition network that currently holds the first place on the UCF-101 Leaderbord66 6 https://paperswithcode.com/sota/action-recognition-in-videos-on-ucf101. I3D utilize both RGB and Flow images during predictions and combining these two data representations have been proven by others to be important for solving activity recognition tasks [12, 23, 24]. Moreover, the authors have made their pre-trained models publicly available77 7 https://github.com/deepmind/kinetics-i3d which allows us to benefit from transfer learning. We have further trained these models on newborn resuscitation activities data to perform activity recognition on the proposed regions from Section IV-A as shown in step 2 Figure 1.
Inception 3D
I3D is created by converting all the filters and pooling kernels in Inception v1 into a 3D CNN. Squared filters of size N N are made cubic and becomes N N N filters. The pre-trained 2D ImageNet weights from Inception v1 are repeated along the time dimension and rescaled by normalization over N. The 3D version is further trained on the large activity recognition dataset, Kinetics Human Action Video Dataset which has 400 different classes and over 400 clips per class. An I3D model is trained for both data representations, i.e. optical flow and RGB stream.
Predictions and Timeline generation
Figure 4 illustrates how the timelines are predicted and generated for different activities. The red squared section marked P shows in more detail how the prediction of the activity ventilation is performed using both the BMR region and the newborn region, and both an RGB model and an optical flow model. Since the activities can overlap in time and the video quality makes the activity recognition difficult, the models are trained on individual activities to do binary classification - activity or no activity. The object dependent activities that analyze both an object region and a newborn region use the same RGB and Flow models in the two analyses, indicated with A and B, and the models are trained on data from both regions. This is done similarly for all the 6 activities, resulting in 11 different I3D models learned (6 RGB and 5 flow). From the left in Figure 4: First, a video undergoes object detection, tracking, and region proposal. Next, the videos from the regions are linear frame interpolated and optical flow is estimated using the TV-L1 algorithm [20], as proposed by [12]. Further, a sliding window (SW) generates sub-signals of the RGB stream and the optical flow stream, and the sub-signals are fed to their corresponding model. The logits from the final I3D layer of the two models are averaged before softmax is applied to perform predictions. The predictions from the two activity-relevant regions are further averaged to generate the final predicted timeline for that specific activity.
The activities stimulation and uncovered are not object-dependent, and only the newborn region is used to generate the activity timeline. Since the activity uncovered is not motion dependent, the computational demanding TV-L1 flow prediction is not performed for this activity and the predictions are generated by using only the RGB data and model.
Estimation of the Number of Health Care Providers
The timeline estimation of the number of HCP present in the resuscitation episode, , is found by counting the number of detected HCPH for each time index , and is consistent with the method we proposed in [6]. The method only does roughly estimate of the number of HCPs present but makes it possible to recognize if no HCP is present and cases where there are certainly more than one HCP present.
V Experiments
In this section, we present 4 different experiments for the two steps in the proposed ORAA-net, Figure 1. For step 1, we present an object detection experiment, Ex.1, where the 4 different network architectures of Table I are tested. The best architecture, RetinaNet, is further used in a second experiment, Ex.2, to investigate if object tracking and region proposal is improved compared to our recent work employing the YOLOv3 architecture [6].
For step 2, Figure 1, which is the main experiments producing timelines of the resuscitation activities, we evaluate the I3D models trained on the specific activities, in Ex. 3, and investigate if the results could be improved by finding optimal thresholds for the generation of the activity timelines, in Ex. 4.
We used the video annotation tool ELAN to manually annotate ground-truth timelines in all videos included in the training and validation set of Ex. 3, and in the test set for Ex. 2, Ex. 3 and Ex. 4. The following is annotated:
- •
Activities
- –
Uncovered: The newborn is not covered by a blanket.
- –
Stimulation: Thoroughly drying and rubbing.
- –
Ventilation: Bag-mask ventilations
- –
Suction: Removal of liquid from the mouth/airways.
- –
Attaching/adjusting the ECG sensor
- –
Removing the ECG sensor
- –
- •
The number of HCPs present
An overview of the datasets used in the four experiments can be seen in Figure 5. From the 481 videos in the dataset we use 76 videos, and synthetic and augmented data, split for training and validation of the neural network models. The details for the splits and the different experiments can be seen in Figure 5. In addition, 20 videos are used to create a test set for evaluation of the models.

| YOLOv3 | RetinaNet | SSD MultiBox | Faster R-CNN | |||||||||
| 416 416 | 1024 1280 | 512 512 | 600 750 | |||||||||
| AP | TP | FP | AP | TP | FP | AP | TP | FP | AP | TP | FP | |
| HCPH | 71.58 (70.07*) | 1636 (1607*) | 165 (192*) | 74.58 | 1752 | 240 | 78.34 | 1815 | 231 | 61.85 | 1625 | 507 |
| BMR | 65.89 (62.07*) | 644 (602*) | 91 (71*) | 69.75 | 708 | 168 | 64.89 | 633 | 85 | 55.14 | 596 | 161 |
| HRS | 80.44 (79.38*) | 486 (478*) | 32 (22*) | 78.57 | 475 | 58 | 82.77 | 500 | 33 | 64.18 | 387 | 46 |
| SD | 22.98 (19.25*) | 152 (124*) | 156 (89*) | 44.22 | 265 | 71 | 34.29 | 201 | 16 | 33.23 | 217 | 118 |
| mAP50 | 60.22 (57.69*) | 66.78 | 65.08 | 53.60 | ||||||||
V-A Performance metrics
In Ex. 1, the object detection results were evaluated by use of the Average Precision (AP) and the mean Average Precision (mAP) metrics defined in the PASCAL VOC 2012 challenge. The required accuracy of the localization task was defined by an Intersection over Union (IoU) threshold of 0.5. In addition to the mAP criterion, the number of True Positives (TP) and False Positive (FP) detections were assessed. This was due to FP detections being highly undesirable for object tracking and poor TP/FP ratios not being sufficiently penalized by mAP. As an aid in setting probability thresholds for desirable trade-offs of TPs and FPs, the distribution of probability scores was assessed. Distributions were drawn from network predictions on the validation dataset.
In Ex. 2, a performance measure, , from [6], is used to evaluate the tracking performance of each object-dependent activity and each episode. is defined by the general equation:
| (5) |
where is the number of frames in the episode and an indicator function defined as 1 on correct detections if and 0 otherwise. An object is classified as detected during an activity sequence if the detection overlaps with the ground-truth data of the time.
In Ex.3 and Ex. 4 the activity recognition and activity timelines results are evaluated by comparing the ground-truth activity timelines with the predicted activity timelines and estimating True Positivies, (TP), True Negatives (TN), False Positive (FP) and False Negatives (FN). To handle class-imbalance in the binary activity classification we evaluate the results by using the two metrics; precision and recall, in addition to the accuracy metric. Ex. 4 also utilize the F1-score in a K-fold Cross-Validation (K-FCV) experiment.
V-B ORAA-net Step 1 - Object Detection and Region Proposal
In Ex.1, where we compared different object detectors, RetinaNet and Faster R-CNN employed ResNet-50 [21] with pre-trained weights on the ImageNet dataset as the initial network. SSD MultiBox used VGG-16 [22] with weights pre-trained on the COCO dataset as the initial network. YOLOv3 was included in the experiment for reference, using the same setup as recently presented by the authors in [6]. The networks were all further trained on a dataset consisting of manually labeled images from the videos, augmented images using histogram matching, and synthetic images. The details can be seen in the upper-right corner of Figure 5. The datasets are similar to those used in [6], however the number of synthetic images were reduced due to experiencing that models were overfitting on synthetic data in the experiments. A built-in image augmentation pipeline recommended in [17] was used for the SSD MultiBox network, which included random flips, crops and photometric distortions. The object detection networks were tested on the same dataset used in [6].
In Ex. 2, we evaluated the region proposal performance during activity sequences for the objects SD, BMR, and HRS using the best object detector from Ex. 1, RetinaNet, and compared it to [6].
V-C ORAA-net Step 2 - Activity Recognition and Activity Timelines
In Ex. 3, the I3D flow and RGB weights pre-trained on ImageNet, and Kinetics 400 [12] are further trained on the individual activities to do binary classification - activity or no activity. The threshold, for detection of class or not, is here set to 0.5. The videos are Linear Frame Interpolated (LFI) to a fixed frame rate of 15 fps, which are reasonably close to the pre-trained I3D weights that are trained on 25 fps videos. 76 videos are used in training of the models, and the details can be seen in Figure 5.
The test set consists of 20 videos as in [6] and in Ex. 1 and Ex. 2. The test set includes 5 videos of frame rates between 4.5-5 fps and one with a frame rate as low as 2 fps.
The input sequences to the RGB and flow I3D models during training and testing are 45 frames long, corresponding to 3 seconds of activity. The frame size is x pixels. During training the activity sequence examples overlap with 1/2, and during testing they overlap with 2/3 - resulting in a new analysis every second. The training examples are also augmented by random cropping, flipping, 90-degree rotation, noise adding and motion blurring. During training we use a batch size of 6 and train for 15000 steps. The learning rate is initially set to 0.0001, and every 3000 step it is decreased by a factor of 0.1
The experiment also compare the usage of both RGB and Flow models in the predictions versus using the individual models alone. This is performed to investigate if acceptable results can be achieved using only the RGB models since the TV-L1 algorithm is highly computational demanding and limits the possibility for real-time usage.
For the activity uncovered, we only use the RGB data and model since this activity is not motion dependent and does not require a motion analysis.
In Ex. 3 we also evaluate the performance of the estimation of number of HCP present in the videos, and compare it to [6].
In Ex. 4, a K-fold Cross-Validation (K-FCV) experiment is performed to find the optimal for the best I3D models from Table IV for each of the included activity classes. is set to 20, i.e., one fold for each of the 20 videos included in the test set.
VI Results
VI-A ORAA-net Step 1 - Object Detection and Region Proposal
The results for Ex. 1 are listed in Table II. Both the RetinaNet architecture and the SSD MultiBox architecture show improved object detection results compared to the YOLOv3 416 416 architecture used in [6], with RetinaNet as the overall winner. In [6] we also split the original images into five 608 606 sub-images and achieved an mAP close to the one achieved by RetinaNet for the class SD, mAP 42.02, but with a much smaller TP/FP ratio, YOLOv3‘s 1.316 vs. RetinaNet‘s 3.73.
The results for Ex. 2 are listed in Table III. Here, the best object detector architecture, RetinaNet, resulted in a large improvement in the detection of the SD during the suction activity.
|
Activities | |||
|---|---|---|---|---|
| BMR | 96.97 % (96.97*) | Ventilation | ||
|
100 % (100*) | Attach/remove HRS | ||
| SD | 88.33 % (75.00*) | Suction |
VI-B ORAA-net Step 2 - Activity Recognition and Activity Timelines
Table IV shows the results for Ex.3, activity recognition using the I3D models for the activities uncovered, stimulation, ventilation, suction, attach/adjust HRS, and remove HRS. In Table V, the results from the estimation of the number of HCP present in the resuscitation episodes are presented. Here, the results are compared to the results from [6].
| I3D RGB | I3D Flow | I3D RGB+Flow | |||||
| Prec. | Rec. | Prec. | Rec. | Prec. | Rec. | ||
|
92.89 | 78.74 | - | - | - | - | |
|
75.48 | 73.13 | 67.45 | 79.80 | 79.41 | 78.15 | |
|
81.70 | 83.57 | 80.03 | 84.26 | 88.64 | 88.34 | |
|
44.96 | 59.81 | 44.98 | 64.92 | 56.01 | 65.61 | |
|
56.02 | 49.18 | 23.84 | 45.88 | 50.00 | 50.83 | |
|
4.59 | 58.49 | 3.06 | 45.28 | 6.73 | 52.83 | |
|
Q (25,50,75) | ||||
|---|---|---|---|---|---|
|
68.32 % (71.16*) |
| |||
|
0.34 (0.32*) |
|
Figure 6 shows two test set video examples of the raw output for the timeline predictions of the 6 activity detected by the I3D models, and two examples of the estimated number of HCP present in the resuscitation. The predictions are shown with orange lines, and the reference data with blue lines.
Table VI shows the results for Ex. 4, the K-fold cross validation experiment. The Table lists both the mean results for the four therapeutic activities, and the overall mean results for all the six activities.
| Activity recognition - I3D | ||||||||
| Mod. | K-FCV threshold test | |||||||
| Prec. | Rec. | Acc. |
| |||||
| Uncovered | RGB | 87.75 | 83.99 | 88.31 | .29, .29, .29 | |||
| Stimulation | RGB+Flow | 78.79 | 74.59 | 91.61 | .46, .50, .80 | |||
| Ventilation | RGB+Flow | 87.30 | 90.64 | 96.90 | .34, .34, .34 | |||
| Suction | RGB+Flow | 56.85 | 61.32 | 92.78 | .51, .51, .51 | |||
|
77.67 | 77.64 | 92.40 | |||||
| Att./adj. HRS | RGB+Flow | 52.65 | 47.77 | 96.76 | .51, .60, .60 | |||
| Remove HRS | RGB+Flow | 10.24 | 27.67 | 98.27 | .86, .92, .92 | |||
| mean all | 62.26 | 64.00 | 94.11 | |||||

VII Discussion
VII-A ORAA-net Step 1 - Object Detection and Region Proposal
The results give reason to suggest the RetinaNet as the overall best architecture for this specific task - object detection during noisy newborn resuscitation videos. Compared to the YOLO v3 architecture and our results in [6], the RetinaNet architecture gave a large increase in AP for SD-detection with an acceptable number of false positives.
The comparison of the networks in Table I indicate that using a larger selection of feature map scales was crucial for the improvement. Producing predictions from different sized scales allow the networks to easier recognize objects of both small and large sizes. Tsung-Yi Lin et al. also emphasize that RetinaNet are capable of state-of-the-art results due to their novel focal loss [16]. The focal loss function introduces a weight term that down-weights easy training examples, i.e. examples where the predicted confidence score is high, during training. Thus, the main contributions in the estimated loss come from predictions with low confidence score, and the network is better equipped to handle the class imbalance between background/negatives and objects.
Using RetinaNet as the base for our object detector resulted in a substantial improvement in the detection of the SD during activity compared to what we achieved in [6] - the performance increased from 75 % to 88.33 %.
Although the object detector benefits from using histogram match augmentation and synthetic images in the training, we will consider pre-processing steps that could standardize the images in future work instead of attempting to create all the variations by augmenting the training data.
VII-B ORAA-net Step 2 - Activity Recognition and Activity Timelines
The results for the activities presented in Table IV and Table VI demonstrate that activity recognition from noisy low-quality videos recorded during newborn resuscitation could be achieved using the presented pre-processing steps for region proposal and the I3D network architecture for temporal analysis. The results also show that although the TV-L1 optical flow algorithm is highly computational demanding and thus limit the possibilities for real-time usage, we achieve better performance by using both RGB and optical flow data representations when predicting the activities, as suggested by others [12, 23, 24].
A larger ablation study should also be performed to identify where the system could be further improved. Since the inputs to the activity recognition models in the ORAA-net step 2 are based on analyzing regions outputted by the ORAA-net step 1, it would be interesting to evaluate if we would achieve improved activity recognition results if the inputs were regions from perfect object detection and tracking. For this to be carried out we would need to label all objects used to propose the regions in each frame of the 20-video test set, which would be very time consuming.
For the activity uncovered most of the examples where the models failed to recognize the activity is in cases where the newborn is only partially covered, and the ground truth can be a matter of definition.
For the activity stimulation, where we labeled massaging and both large and small stimulation sequences as stimulation, the models sometimes struggle to identify the sequences. Especially for cases where the stimulation is performed under the newborn lying on its back. Here, we also experienced more false detections in the videos of lower frame rates, and by excluding the 6 videos that originally had 5 fps or lower from the 20 video test set, the precision increased from 79.41 to 82.36 % and the recall from 78.15 to 81.86 %. This supports the problem explained in Section IV-B - that low frame rates make recognition of activities that involve fast and large movement more difficult. From Table VI we can also see that different from the other activities, the quantile measurement for the thresholds used in the stimulation K-FCV test is highly dependent on which video is used in the validation, causing both the precision and the recall to drop compared to when 0.5 was used as the threshold in table IV.
For the activity ventilation, the results is highly promising, with a precision and a recall of almost 90 %.
The models have difficulties with the activity suction, where the precision and recall are around 60 %. Examples of two detection results can be seen in the middle section of Figure 6. The first example demonstrate the models‘ ability to recognize the activity, and the second one illustrate that the models suffer from both FP and FN. When considering that the object detector had difficulties recognizing the SD object itself, it is reasonable to believe that this could also be the case for the I3D models. Thus, an explanation could be that the activity‘s movement, where the SD is moved back and forth between the newborn‘s mouth or nose and the resuscitation table, are sometimes not distinguishable enough from other hand movements occurring during the resuscitations. This is also the activity out of the presented four therapeutic activities in Table IV with the smallest amount of training data - 2707 seconds of unaugmented suction activity (see Figure 5). The videos with the poorest results were videos of poor quality, i.e. motion-blurred and unfocused, and videos where the camera are positioned further away from the resuscitation table relative to other videos. It also had more difficulties with videos recorded with a wide-angle format, suggesting the need for a pre-processing step to standardize the videos in some way. Excluding videos of poor quality would most likely increase the performance of the activity recognition, but considering that this would remove most of the videos in the present dataset, this option would limit our data analysis.
The results for the classes Attach/adjust HRS and Removing HRS are poor. As illustrated in Figure 5, the occurrences of these two activities in the 76 videos used in training, was relatively short, 446, and 172 seconds, and considering that a deep neural network requires a lot of training data, the results are understandable. However, we did observe that the models learned to recognize the activities in some cases, as can be seen in Figure 6.
In the estimation of the number of HCP present we achieved slightly poorer results using the RetinaNet architecture than with the YOLO v3 architecture [6]. As before, the network struggled to recognize hands in poor video quality due to motion smoothing, but also in cases where the HCP does not wear gloves. The proposed method is based on counting the number of detected HCP hands in each frame, which is a quite naive approach that require all hands to be visible at all time. Moreover, the method only does roughly estimate of the number of HCPs present and a detection of four HCPHs could correspond to 2-4 HCPs present. However, the method makes it possible to recognize if no HCP is present and cases where there are certainly more than one HCP present. A better approach would most likely be to detect both right and left hands, but with these low-quality videos it is very difficult to discriminate between the two. Moreover, in some videos the camera is positioned in a side-position, causing HCPs to occlude other HCP’s hands. A potential solution for future recordings could be to include an additional camera, positioned further away, that could be used to recognize the number of HCPs participating in the resuscitation.
In [6], we also suggested that it would be possible to recognize chest compressions, but because this activity only occurred in 2 of the 76 videos annotated for training, and none of the videos in the test set, we made no attempt of training I3D models for this activity. This activity could instead, as suggested by Vu [7] and Gonzalez-Otero [25], be detected from the ECG signal measured with the HRS.
Some of the discussed problems should be possible to solve by further training of the models on more data. This would especially be true for the activities with the smallest amount of training data. Manual annotations are expensive and time consuming, and a potential solution could be to record resuscitation simulation on a manikin, where we focus on the cases where the models struggle to recognize the activities.
The results suggest that we should consider pre-processing steps that could simplify our data in future work. The videos contain a lot of variations and by standardizing them in some way it could be easier for the I3D models to learn the relevant features.
There are also some video quality limitations in the current dataset, e.g. motion blurring, low frame rates etc., making it challenging to recognize activities - regardless of the amount of training data or the deep learning architecture used. In future recordings this could be solved by clearly defining a protocol for standardization of video recordings for automatic activity recognition in a newborn resuscitation setting.
VIII Conclusion and Future Work
The results suggest that the proposed two-step ORAA-net, utilizing object detection and tracking to propose detection regions for temporal activity analysis, is well suited for activity recognition in noisy and low-quality newborn resuscitation videos where sometimes the activities are largely occluded.
Potential future applications for such a system could be to implement it on-sight, as a real-time feedback system, or as a debriefing tool for newborn resuscitation training. The ORAA-net could also be adapted for in-hospital emergency situations involving adults.
In future work, we will investigate if adding more training data to the object detection and the activity recognition could further improve the system and make it possible to detect if the HRS is attached to the newborn or not. We also plan an ablation study to identify where the system could be further improved. The system could potentially also be simplified by using fewer models in the activity recognition. A possible solution could be to train activities that cannot overlap in time, such as ventilation and suction, in the same model. Besides, we plan to develop a multisensor fusion system that incorporate the activity recognition from the ECG signals [7] into our video-based method in an attempt to increase the system‘s performance.
IX Acknowledgement
IX-A Funding
Our research is part of the Safer Births project which has received funding from: Laerdal Global Health, Laerdal Medical, University of Stavanger, Helse Stavanger HF, Haydom Lutheran Hospital, Laerdal Foundation, University of Oslo, University of Bergen, University of Dublin – Trinity College, Weill Cornell Medicine and Muhimbili National Hospital. The work was partly supported by the Research Council of Norway through the Global Health and Vaccination Programme (GLOBVAC) project number 228203.
For the specific study of this paper; Laerdal Medical provided the video equipment. Laerdal Global Health funded data collection in Tanzania and IT infrastructure. The University of Stavanger funded the interpretation of the data.
IX-B Ethical approval
This study was approved by the National Institute of Medical Research (NIMR) in Tanzania (NIMR/HQ/R.8a/Vol. IX/1434) and the Regional Committee for Medical and Health Research Ethics (REK), Norway (2013/110/REK vest). All women were informed about the ongoing studies, but consent was not deemed necessary by the ethical committees for this descriptive sub-study.
IX-C Conflict of interests
Myklebust is employed by Laerdal Medical. He contributed to study design and critical revision of the manuscript, but not in the analysis and interpretation of the data.
References
- [1] L. Hug, M. Alexander, D. You, L. Alkema, and U. I.-a. G. for Child, “National, regional, and global levels and trends in neonatal mortality between 1990 and 2017, with scenario-based projections to 2030: a systematic analysis,” The Lancet Global Health, vol. 7, no. 6, pp. e710–e720, 2019.
- [2] J. E. Lawn, S. Cousens, J. Zupan, L. N. S. S. Team et al., “4 million neonatal deaths: when? where? why?” The lancet, vol. 365, no. 9462, pp. 891–900, 2005.
- [3] J. Reisman, L. Arlington, L. Jensen, H. Louis, D. Suarez-Rebling, and B. D. Nelson, “Newborn resuscitation training in resource-limited settings: a systematic literature review,” Pediatrics, vol. 138, no. 2, p. e20154490, 2016.
- [4] D. Chou, B. Daelmans, R. R. Jolivet, M. Kinney, and L. Say, “Ending preventable maternal and newborn mortality and stillbirths,” Bmj, vol. 351, p. h4255, 2015.
- [5] M. H. Wyckoff, K. Aziz, M. B. Escobedo, V. S. Kapadia, J. Kattwinkel, J. M. Perlman, W. M. Simon, G. M. Weiner, and J. G. Zaichkin, “Part 13: neonatal resuscitation: 2015 american heart association guidelines update for cardiopulmonary resuscitation and emergency cardiovascular care,” Circulation, vol. 132, no. 18_suppl_2, pp. S543–S560, 2015.
- [6] O. Meinich-Bache, K. Engan, I. Austvoll, T. Eftestol, H. Myklebust, L. Yarrot, H. Kidanto, and H. Ersdal, “Object detection during newborn resuscitation activities,” IEEE Journal of Biomedical and Health Informatics, pp. 1–1, 2019.
- [7] H. Vu, K. Engan, T. Eftestøl, A. Katsaggelos, S. Jatosh, S. Kusulla, E. Mduma, H. Kidanto, and H. Ersdal, “Automatic classification of resuscitation activities on birth-asphyxiated newborns using acceleration and ecg signals,” Biomedical Signal Processing and Control, vol. 36, pp. 20–26, 2017.
- [8] C. Skåre, A. M. Boldingh, J. Kramer-Johansen, T. E. Calisch, B. Nakstad, V. Nadkarni, T. M. Olasveengen, and D. E. Niles, “Video performance-debriefings and ventilation-refreshers improve quality of neonatal resuscitation,” Resuscitation, vol. 132, pp. 140–146, 2018.
- [9] B. Gelbart, R. Hiscock, and C. Barfield, “Assessment of neonatal resuscitation performance using video recording in a perinatal centre,” Journal of paediatrics and child health, vol. 46, no. 7-8, pp. 378–383, 2010.
- [10] S. Maya-Enero, F. Botet-Mussons, J. Figueras-Aloy, M. Izquierdo-Renau, M. Thió, and M. Iriondo-Sanz, “Adherence to the neonatal resuscitation algorithm for preterm infants in a tertiary hospital in spain,” BMC pediatrics, vol. 18, no. 1, p. 319, 2018.
- [11] I. Nadler, P. M. Sanderson, C. R. Van Dyken, P. G. Davis, and H. G. Liley, “Presenting video recordings of newborn resuscitations in debriefings for teamwork training,” BMJ quality & safety, vol. 20, no. 2, pp. 163–169, 2011.
- [12] J. Carreira and A. Zisserman, “Quo vadis, action recognition? a new model and the kinetics dataset,” in proceedings of the IEEE Conference on Computer Vision and Pattern Recognition, 2017, pp. 6299–6308.
- [13] S. Ioffe and C. Szegedy, “Batch normalization: Accelerating deep network training by reducing internal covariate shift,” arXiv preprint arXiv:1502.03167, 2015.
- [14] Y. Guo, J. Wrammert, K. Singh, K. Ashish, K. Bradford, and A. Krishnamurthy, “Automatic analysis of neonatal video data to evaluate resuscitation performance,” in Computational Advances in Bio and Medical Sciences (ICCABS), 2016 IEEE 6th International Conference on. IEEE, 2016, pp. 1–6.
- [15] J. Redmon and A. Farhadi, “Yolov3: An incremental improvement,” arXiv, 2018.
- [16] T.-Y. Lin, P. Goyal, R. Girshick, K. He, and P. Dollár, “Focal loss for dense object detection,” in Proceedings of the IEEE international conference on computer vision, 2017, pp. 2980–2988.
- [17] W. Liu, D. Anguelov, D. Erhan, C. Szegedy, S. Reed, C.-Y. Fu, and A. C. Berg, “Ssd: Single shot multibox detector,” in European conference on computer vision. Springer, 2016, pp. 21–37.
- [18] S. Ren, K. He, R. Girshick, and J. Sun, “Faster r-cnn: Towards real-time object detection with region proposal networks,” in Advances in neural information processing systems, 2015, pp. 91–99.
- [19] M. Koren, K. Menda, and A. Sharma, “Frame interpolation using generative adversarial networks.”
- [20] C. Zach, T. Pock, and H. Bischof, “A duality based approach for realtime tv-l 1 optical flow,” in Joint pattern recognition symposium. Springer, 2007, pp. 214–223.
- [21] K. He, X. Zhang, S. Ren, and J. Sun, “Deep residual learning for image recognition,” in Proceedings of the IEEE conference on computer vision and pattern recognition, 2016, pp. 770–778.
- [22] K. Simonyan and A. Zisserman, “Very deep convolutional networks for large-scale image recognition,” arXiv preprint arXiv:1409.1556, 2014.
- [23] ——, “Two-stream convolutional networks for action recognition in videos,” in Advances in neural information processing systems, 2014, pp. 568–576.
- [24] C. Feichtenhofer, A. Pinz, and A. Zisserman, “Convolutional two-stream network fusion for video action recognition,” in Proceedings of the IEEE conference on computer vision and pattern recognition, 2016, pp. 1933–1941.
- [25] D. M. González-Otero, S. R. de Gauna, J. Ruiz, M. R. Daya, L. Wik, J. K. Russell, J. Kramer-Johansen, T. Eftestøl, E. Alonso, and U. Ayala, “Chest compression rate feedback based on transthoracic impedance,” Resuscitation, vol. 93, pp. 82–88, 2015.