As observed during the global SARS-CoV-2 (COVID-19) pandemic, high-income countries, such as the United States, may exhibit vaccine nationalism during a pandemic: stockpiling doses of vaccine for their own citizens and being reluctant to distribute doses of the vaccine to lower-income countries. While many cite moral objections to vaccine nationalism, vaccine inequity during a pandemic could possibly worsen the global effects of the pandemic, including in the high-income countries themselves, through the evolution of new variants of the virus. This paper uses the COVID-19 pandemic as a case study to identify scenarios under which it might be in a high-income nation’s own interest to donate vaccine doses to another country before its own population has been fully vaccinated. We develop an extended SEIR (susceptible-exposed-infectious-recovered) epidemiological model embedded in an optimization framework and examine scenarios involving a single donor and multiple recipient (nondonor) geographic areas. We find that policies other than donor-first can delay the emergence of a more-contagious variant compared to donor-first, sometimes reducing donor-country deaths in addition to total deaths. Thus, vaccine distribution is not a zero-sum game between donor and nondonor countries: an optimization approach can achieve a dramatic reduction in total deaths with only a small increase in donor-country deaths. We also identify realistic scenarios under which the best policy found has a switching form rather than adhering to a strict priority order. The iterative linear programming approximation approach we develop can help confirm those instances when a priority policy is optimal and, when not optimal, can identify superior policies. Policies with fewer switching points, which are easier to implement, can be constructed from the best policy found. This optimization framework can be used to guide equitable vaccine distribution in future pandemics.
International Vaccine Allocation: An Optimization Framework
keywords
COVID-19, pandemic, vaccine inequity, SEIR, optimizationHighlights
- -
Vaccine inequity during a pandemic could possibly worsen the global effects of the pandemic, including in nations with ample supply of vaccine, through the evolution of new variants of the virus.
- -
We use an extended SEIR (susceptible-exposed-infectious-recovered) epidemiological model embedded in an optimization framework to examine vaccine distribution scenarios involving a single donor and multiple recipient (nondonor) geographic areas.
- -
We find that policies other than donor-first can delay the emergence of a more-contagious variant compared to donor-first, sometimes reducing donor-country deaths in addition to total deaths. Thus, vaccine distribution is not a zero-sum game between donor and nondonor countries.
- -
This optimization framework can be used to guide equitable vaccine distribution in future pandemics.
1 Introduction
COVID-19 illustrated the huge effect that both pharmaceutical and non-pharmaceutical interventions could have on the course of a pandemic. In this context, a possible contributing factor for the persistence of the pandemic after vaccines first came to market is so-called vaccine nationalism. Initial development of vaccines against COVID-19 was largely funded by high-income nations, including the United States. Meanwhile, access to COVID-19 vaccines in mid- and low-income nations depended largely on vaccine donations from high-income nations (GAVI 2022). This dependence was a major reason for imbalanced vaccination. By April 2022, high income countries enjoyed a 73% vaccination rate, and low-income countries achieved only an 11% vaccination rate (COVID-19 Vaccine Delivery Partnership 2022).
Moral objections to vaccine nationalism during a pandemic abound (Hunter et al. 2022; Asundi et al. 2021; Ghebreyesus 2021). There are also several ways it may harm the nations that practice it. The COVID-19 pandemic illustrated the inability to contain a virus geographically: closing borders proved generally ineffective, only temporarily delaying surges and the spread of variants. Leaving other countries unvaccinated prolongs their surges, resulting in more international transmission and longer travel and trade disruptions. Without vaccination there is also a greater risk of mutation, leading to more contagious variants. For these reasons, it has been argued that vaccine nationalism could undermine a wealthy nation’s own interests (Asundi et al. 2021). Instead, Emanuel et al.’s Fair Priority Model recommends prioritizing countries with the highest transmission rates (Emanuel et al. 2020).
This paper looks ahead to the next global pandemic and examines the circumstances under which a nation with large vaccine supply might prioritize donating some of their supply to other nations, even before fully vaccinating their own populations, in order to reduce local deaths. We use data from the COVID-19 pandemic as an exemplar of this generalizeable approach. We extend an epidemiological disease transmission model to include vaccination and emergence of variants, then embed it within an optimization framework to determine the optimal dynamic allocation of vaccine to geographic regions. The optimization uses iterative linear programming approximation; we also search over static priority policies. We compare four policies: donor-first, nondonor-first, optimized, and optimized with a fairness constraint. To study the emergence of variants, we apply the model in a global context; it could also focus on a group of countries with significant travel between them. The model is high-level and intended for vaccination policy insights, not for short-term forecasting which requires finer data on a smaller geographic area, divided into age/risk groups.
The main contributions of this study are
- -
A compartmental model is developed that includes partial vaccine effectiveness, behavioral or governmental response to surges in cases, and a new model of the emergence of variants.
- -
We show that policies other than donor-first can significantly delay the emergence of a variant compared to donor-first, sometimes reducing donor-country deaths in addition to total deaths.
- -
We demonstrate that vaccine distribution is not a zero-sum game between donor and nondonor countries: policies other than donor-first can achieve dramatic reduction in total deaths with only a small increase (and occasionally even a decrease) in donor-country deaths.
- -
We identify realistic scenarios under which the best policy found has a switching form rather than adhering to a strict priority order. Policies with fewer switching points, which are easier to implement, can be constructed from the best policy found. Policies with this structure could be used to guide vaccine distribution in future pandemics.
The next section presents recent literature on COVID-19 transmission and vaccine allocation policies. Section 3 develops the SEIR (Susceptible-Exposed-Infected-Recovered) model with vaccination and variants and analyzes this model to develop herd immunity thresholds. In Section 4 we embed the epidemiological framework into an optimization model to identify optimal vaccine allocations. Section 5 describes the scenarios used, presents the results of our approach, and analyzes the structure of the policies yielded by the model. We conclude and present ideas for future work in Section 6.
2 Literature Review
The COVID-19 pandemic triggered a wave of research related to prediction of disease trajectory, estimation of disease characteristics, and operational decision-making regarding interventions to control the disease. There are several surveys of pandemic-related research in the management science and operations management literature (Gupta et al. 2022; Choi 2021; Jordan et al. 2021; Kaplan 2020). In particular, Jordan et al. note a gap in the literature in the area of decision support (Jordan et al. 2021), which is one purpose of our paper. Although the recent COVID-19 pandemic is a focal point of our literature review, our modeling approach generalizes to future pandemics.
We focus our review on compartmental models that predict how many people in a population are susceptible (S), exposed (E), infected (I) or recovered (R) from the disease. Other approaches include agent-based models (Salem and Moreno 2022; Mahmood et al. 2020; Angelopoulou and Mykoniatis 2022; Thompson and Wattam 2021), statistical methods (Kaplan et al. 2021; Lotfi et al. 2022; Wang 2022), and various other techniques (Duarte et al. 2022; Khalilpourazari and Doulabi 2021; Medrek and Pastuszak 2021).
2.1 SEIR Models for Simulation
In the COVID-19 pandemic, SIR and SEIR models have been used for estimating transmission rate and basic reproduction number of the virus (Wang et al. 2020), validating assumptions about disease transmission and vaccine efficacy (Algarni et al. 2022), and predicting pandemic dynamics in light of policy, societal behaviors, travel, and social network characteristics (Bagger et al. 2022; Kumar et al. 2021; Parro et al. 2021; Perakis et al. 2022; Qian and Ukkusuri 2021). SEIR models can also be used to simulate the effectiveness of interventions, such as hospital admission policies (Chen and Kong 2022), contact tracing and testing (Sainz-Pardo and Valero 2021), nonpharmacological interventions such as social distancing, masking, isolating, or quarantining (Kumar et al. 2021; Yu and Hua 2021), and vaccine rollout (Kemp et al. 2021; Mak et al. 2022).
These models are useful for short- or medium-term prediction. For longer predictions, SIRS models are used that allow for reinfection by the same or other strains of the virus after immunity wears off (Lazebnik and Blumrosen 2022). Several models include vaccination, including the DELPHI-V model (Bertsimas et al. 2021), (Lazebnik and Blumrosen 2022), and (Shami and Lazebnik 2022).
Another key feature of high-fidelity models for COVID-19 is partitioning into subpopulations, either by geographic area (Lazebnik and Blumrosen 2022), age and risk groups (Volpert et al. 2021; Dolbeault and Turinici 2020; Gillis et al. 2021), or both (Bertsimas et al. 2021). Volpert, Vitaly, and Sharma examine the effectiveness of vaccination within a heterogeneous population of high transmission and low transmission subpopulations that arise due to characteristics such as age, religious practices, professional experiences, and cultural norms. They find that the effectiveness of vaccination depends on vaccine uptake in each group: achieving a high vaccination rate within the high transmission subpopulation leads to lower overall population rates of infection, but a high vaccination rate only within the low transmission subpopulation serves only to protect the low transmission population against infection. Dolbeault and Turinici also consider the impacts of high- and low-transmission subpopulations in the context of lockdown policies in France. Our work also incorporates interaction between groups, but the groups are countries or regions, and the interaction occurs through the emergence of a variant.
2.2 Mutation and Multistrain Models
A key aspect of our model is the emergence of an additional strain, or variant. The simplest multistrain models assume both strains are initially present and interact (Bellomo et al. 2022; Khyar and Allali 2020). Similarly, a second strain can emerge at a fixed time, exogenous to the model (Lazebnik and Blumrosen 2022; Shahmanzari et al. 2022). More relevant to our work, Schwarzendahl et al. incorporate multiple variants and argue that the average transmission rate is expected to grow linearly with time or with the number of cases (Schwarzendahl et al. 2022). Our paper assumes that a new variant will emerge after a randomly distributed number of infectious person-days.
2.3 Vaccine Allocation Using SEIR Models
The rapid development of vaccines against COVID-19 raised numerous questions about how nascent vaccines should be allocated during a pandemic, both among countries and among subpopulations within a given country. Bicher et al. consider allocation to risk groups in Austria (Bicher et al. 2022). Westerink-Duijzer, Schlicher, and Musegaas use cooperative game theory to identify market prices that lead to stable allocations of influenza vaccines between agencies representing non-interacting regions of the US (Westerink-Duijzer et al. 2020). Gutjahr incorporates equity in health outcomes via a Gini mean absolute difference term to allocate vaccine between interacting geographic regions (Gutjahr 2023). The model assumes that the entire stockpile is available at the outset of the time horizon, and therefore the model is not time-based; the disease burden as a function of allocation is known a priori. Duijzer et al. considers allocating influenza vaccine stockpiles to interacting subpopulations, and find that as interaction increases between the subpopulations, disparities caused by inequitable vaccine allocation persist but diminish (Duijzer et al. 2018).
Bertsimas, Li, and co-authors develop the DELPHI-V-OPT model to optimize COVID-19 vaccine allocation to non-interacting geographic areas and age/risk groups in the US (Li et al. 2022 and Bertsimas et al. 2021). Our optimization method is based on their iterative linear programming approximation.
None of the previous studies consider allocation between countries. Rotesi et al. consider interacting countries and examine when it is in a donor country’s best interest to donate vaccines (Rotesi et al. 2021). They demonstrate that it is beneficial to donate vaccines when the donor and recipient countries are close to the herd immunity limit. While we do not model travel directly, we do model the emergence of more contagious variants that appear in the donor country after a time lag. To our knowledge, our paper is the first work that examines the question of optimal vaccine-sharing between countries in the context of geographic interaction and mutation.
2.4 Other Policy Optimization
SEIR and other epidemiological models have been used to optimize pandemic mitigation policies other than vaccination. Shahmanzari et al. develop a stochastic multiobjective dynamic program that weighs lives lost against economic impacts to compare dynamic and static mitigation strategies to contain COVID-19 disease spread in the context of mutation and vaccination (Shahmanzari et al. 2022). Mitcham and Keisler use a multi-attribute utility decision-making framework that identifies pandemic mitigation strategies which robustly trade-off lives saved, personal liberties, and economic considerations (Mitcham and Keisler 2022). Gillis et al. combine a genetic algorithm with an age-stratified SEIR model to identify effective public health responses under various budgetary assumptions (Gillis et al. 2021). Salgotra et al. intertwine an SEIR model with multi-objective optimization models to examine the tradeoffs between economic costs and health impacts inherent in policies to control COVID-19 transmission (Salgotra et al. 2021). Vaccine distribution networks have also been optimized (Pan et al. 2022; Tavana et al. 2021).
3 SEIR Model
This section presents a Susceptible, Exposed, Infectious, and Recovered (SEIR) model with additional states for vaccinated individuals, making it a “SEIR-V” model. There are a small number of geographic areas that interact through virus mutation: a more contagious variant emerges after some number of infections and then spreads to the other areas after a fixed time lag. Separate age or risk groups are not considered.
3.1 SEIR-V for a Given Variant Emergence
First we present the epidemic dynamics for a given timing of variant emergence. We make the following assumptions about dynamics.
- -
Vaccinations: Vaccinated individuals have lower rates of becoming infected, lower mortality, and are less contagious. Note that, unlike other models, all vaccinated individuals are susceptible to infection.
- -
Vaccine willingness: A proportion of the population is willing to be vaccinated. We assume that “willingness” is independent of risk of infection (e.g., age or behavior), so that individuals who are willing to be vaccinated are infected at the same rate as unwilling individuals. When there are no more willing susceptible individuals, vaccinations are stopped.
- -
Infectious time and testing: A person is infectious until their contagious period ends, they are hospitalized, they are deceased, or they self-isolate or are quarantined due to symptoms or a positive test result. Thus, the rate out of infectious states depends on testing.
- -
Mutation: The infection rate of the new variant is larger than the previous variant (Schwarzendahl et al. 2022). The timing of when the variant appears and spreads to other areas is addressed in Section 3.2.
- -
Behavior: The infection rate also changes due to social distancing behavior. We assume that the rate is linearly decreasing in the effective number of infectious individuals, i.e., people are more cautious when there is a surge in cases. This feedback loop limits the size of surges. In contrast, many other models treat behavior as fixed or exogenous.
- -
Reinfection: Individuals cannot be infected twice. This assumption is reasonable because the time horizon is assumed to be short enough that recovered individuals do not lose their immunity and re-enter the susceptible class.
- -
Logistics: We exclude supply chain considerations and assume that vaccines may be immediately reallocated from one country to the other.
- -
Time dependence: All parameters are assumed constant over time except for the amount of vaccine available and the infection rate, which changes due to mutation.
The states of the model are diagrammed in Figure 1. These and other variables that vary over time are defined in Table 1. For example, denotes the number of people in state in area after days. All quantities that depend on area have the subscript ; however, it will be suppressed whenever possible. We do not track hospitalizations; instead, the proportion of hospitalized patients that will recover are already counted in and the rest in .
| Variable | Description |
| Susceptible unvaccinated (number of people) | |
| Susceptible vaccinated | |
| Exposed unvaccinated | |
| Exposed vaccinated | |
| Infectious unvaccinated | |
| Infectious vaccinated | |
| Recovered | |
| Deceased | |
| In state and willing to be vaccinated | |
| Equivalent number infectious, considering vaccination and behavior. See (2) | |
| Infection rate (cases/day/person) | |
| Proportion of new infections that are the variant |
The parameters of the model are listed in Tables 2 and 3. More discussion of their values is given in Section 5 and in Holleran et al (Holleran et al. 2024).
| Parameter | Base Value | Description |
| 100,000 | Initial population | |
| 0.78 | Proportion of population willing to be vaccinated | |
| 0 | Initial proportion of population vaccinated | |
| 0.00072 | Initial new cases per day as a proportion of the population | |
| Policy-dependent | Rate of vaccinations available at time (people/day) | |
| Rate out of the infectious state without testing (proportion/day) | ||
| 0.035 (donor areas) | Contribution of testing to the rate out of the infectious state (proportion/day) | |
| Rate out of the infectious state (proportion/day) | ||
| 1 | Infection multiplier for an area |
| Parameter | Base Value | Description |
| 0.6 | Nominal infection rate, original strain (cases/day/person). | |
| 0.6 | Change in infection rate for variant (cases/day/person) | |
| 0.03 | Upper limit on proportion of population infectious, due to behavioral changes | |
| 1/5 | Rate out of the exposed state (proportion/day) | |
| 0.014 | Unvaccinated case mortality rate | |
| 0.0079 | Vaccinated case mortality rate | |
| 0.6 | Transmission rate from a vaccinated person as a proportion of rate for an unvaccinated person; is the vaccine effectiveness against transmitting the virus | |
| 0.6 | Infection rate for a vaccinated person as a proportion of rate for an unvaccinated person | |
| 45,000 | Mean person-days in the infectious state before new variant appears. Only nondonor areas and unvaccinated individuals are counted. | |
| 1/3 | Coefficient of variation of person-days in the infectious state before new variant appears. | |
| 15 | Lag for the variant to reach other areas (days) | |
| 25 | Time for a variant to dominate, i.e., represent half the new cases in an area (days) | |
| 180 | Scenario length (days) |
We model the state evolution depicted in Figure 1 using discrete time dynamics with an interval of one day (). Given infection rate (which depends on the timing of variant emergence; see Sec. 5.2), the dynamics can be solved separately for each area. Vaccination and social distancing behavior change the usual SEIR dynamics in two ways.
First, the force of infection, , typically used in a SEIR model becomes , where represents the equivalent number infectious. If we assume no social distancing behavior dynamics, simply accounts for the reduced infectiousness of those in the vaccinated class relative to those in the unvaccinated class:
| (1) |
To include behavior dynamics, we mimic the approach of Van Oorschot et al. 2022 and multiply the above by a behavior factor that decreases linearly with this equivalent number infectious:
| (2) |
The parameter is the proportion of equivalent infections at which drops to zero; it is an upper limit on the proportion of equivalent infections.
Second, vaccination moves people from to with nominal rate given by the vaccine allocation policy11 1 Throughout this paper, we refer to any schedule of allocations of vaccine to the regions as a policy. When a vaccine allocation follows a static ordering of regions, such as donor-first, then nondonor1, nondonor2, etc., we call that a priority policy. When a vaccine allocation distributes vaccine to a particular region, switches to distributing vaccine to another region, and then switches back to distributing vaccine to the previous region, we say that the policy exhibits a switching form. The vaccine allocation that arises as the solution to an optimization problem is referred to as an optimal policy.. However, vaccinations will stop when the number of people in state at time who are willing to be vaccinated, , reaches . Let be the last day that . Thus, the rate of vaccinations administered is , which is prior to time and is after time . At time , is chosen so that . This is achieved by subtracting from the number of people moving from state to state . We have:
| (3) |
Using (2) and (3), the difference equations are
| (4) |
In these equations, is the infection rate for unvaccinated individuals (), while is the smaller infection rate for vaccinated (). From (or ), the rate into (or ) is and the rate out of (or ) is . The units of these rates are per day, so that in steady state the time spent in the infectious state is days. The total rate out of state (or ) is split with proportion (or ) dying and the rest recovering.
3.2 Emergence of the Variant
We propose a new model of when the variant emerges and the resulting infection rate . The rate also depends on the area (age distribution, population density, and baseline behavior such as masking and distancing). Behavior dynamics are captured in , not in ; see (2). Initially, a constant mix of strains is assumed to be in all areas, with nominal infection rate . The infection rate of the new variant is larger by . We assume appearance of a variant depends on the number of unvaccinated infectious person-days accumulated over nondonor areas. The assumption that donor areas do not contribute to mutation risk is based on the idea that nondonor areas are largely low-income countries with less immunization against other diseases and more vulnerability to long infections with high viral load. While ideally one could model donor areas as having lower mutation risk, rather than none, we are not aware of any source to estimate the relative risk. Sensitivity to this assumption is checked in Section 5.2. On day , this cumulative number of infectious days is
| (5) |
Making depend on (5) links the areas; their dynamics (4) can no longer be solved separately.
We model the number of infectious days until the variant emerges as a random variable with distribution function . If we assume that a variant emerges after a fixed number, , of successive, independent mutations, and that the time elapsed between each mutation is exponentially distributed with mean , then will follow a gamma distribution with mean , and coefficient of variation .
The model with random is not tractable for optimization. We approximate the random dynamics with deterministic dynamics by computing the expected infection rates. At each , we will compute the expected , given . Using these , the dynamics can be solved for , obtaining . Define as the day when the variant emerges, using the expected to compute , which maps into . Then
| (6) |
We also will specify the area in which the variant emerges, , using the deterministic dynamics (using the expected to compute ). In a random model, is the nondonor area with the largest number of unvaccinated infection-days when the variant emerges; in our deterministic dynamics, we define as the nondonor area with the largest number of unvaccinated infection-days when reaches (the mean number at which the variant emerges). This occurs on day
| (7) |
Next we model the expected proportion of new infections in area that are the variant at . Conditioning on when the variant emerges, we use the sigmoid
| (8) |
At , , i.e., when the variant emerges it represents 1% of new cases. At , , i.e., is the time until dominance (50% of new cases). Next we take the expectation over :
| (9) |
Note that for , so these terms are not needed in the sum.
A deterministic time until the variant emerges is the special case . While a deterministic model is useful for simulating a given vaccination policy, and we have used it in Holleran et al (Holleran et al. 2024), it is not realistic to assume is known in advance in an optimization model. Also, in a deterministic model of a single variant, infections after the variant emerges pose no risk, while in a random model infections continue to increase the risk of the variant emerging. For these reasons, we use the random model for optimization. In the deterministic case, the variant emerges when at , with probability one, for and 1 for , and for and for .
The proportion of the variant determines the average nominal infection rate in area ,
| (10) |
Infection rates in other areas have a lag of days. Including the behavior factor, the time-varying infection rates are
| (11) | ||||
Figure 5 in Section 5 shows how increases over time. This shape seems more realistic than the linear function of used in Schwarzendahl et al. 2022.
3.3 Simulating SEIR-V
To solve SEIR-V numerically for a given vaccination policy , the difference equations for all areas are solved at successive . The state variables are initialized using the initial proportion vaccinated and initial cases per day. To estimate the exposed states, we use the steady state mean time in these states, . Multiplying by the new cases per day,
Similarly, for the infectious states
To allocate between vaccinated and unvaccinated states, we use the initial proportion vaccinated and assume cases are only as prevalent among vaccinated individuals. To initialize , is the number willing to be vaccinated and we assume that those initially in states and have the same proportion willing to be vaccinated as . Then the initial conditions are
| (12) | ||||
Note that these values, excluding , sum to , so that .
The vaccination policy needs to be modified as shown in (3) if reaches 0 (in which case may also be 0). However, if an area cannot use all of its planned vaccinations, we assume that they can be reallocated to other areas. First, we compute the vaccinations before reallocation as in (3), now calling them and using the more convenient, equivalent equation
| (13) |
The first expression is the number in state willing to vaccinate before the vaccinations occur.
Now we reallocate the unused vaccinations
| (14) |
to other areas. First, choose a priority order and arrange the areas in order of descending priority . Starting with , the vaccinations after reallocation in area are computed as
| (15) |
and the amount reallocated, , is subtracted from the available reallocation Q. This is repeated for all (or until ).
3.4 Herd Immunity
This section presents herd immunity conditions for the continuous time version of our model that will be useful in interpreting the numerical results. Herd immunity is defined as stability to a small injection of infections, from an initial state with no infections. We can remove the states for the purpose of stability analysis and assume that and are infinitesimal, so that , and are constant over the time scale of stability analysis. Because they are infinitesimal, we can also use (1), ignoring the behavior dynamics in (2). Let , etc. denote derivatives. From (4) and (2),
If no vaccinations occur, and the stability condition for the unvaccinated group is , or
| (16) |
where is the unvaccinated basic reproduction number. Since varies after the variant emerges, so does . If all susceptible individuals are vaccinated, then , and the stability condition is , or
| (17) |
where is the vaccinated basic reproduction number. This is weaker than (16), since . Also define the critical proportion as the proportion that must not be susceptible in order to reach herd immunity. With no vaccination, the critical proportion is , and similarly when all are vaccinated.
Stability conditions for the general case where are more complex; stability of a similar model is analyzed in (Fudolig and Howard 2020). The local stability condition for a system of differential equations is that the eigenvalues of the Jacobian all have negative real components. The Jacobian is
with eigenvalues and
Thus, the stability condition is
| (18) |
Another quantity of interest is the proportion of cases that are vaccinated. Let be the ratio of vaccinated to unvaccinated infectious at time . For a given and , equilibrium for occurs when
with solution
Further, at equilibrium the relative risk of a new infection (vaccinated to unvaccinated) is
and the proportion of new cases that are vaccinated is
We conjecture that the equilibrium for is stable, so that the proportion of cumulative cases that are vaccinated will tend to track this value even as and change slowly over time.
4 Optimization Framework
In this section we formulate a model that allocates the vaccines available each day to areas in order to minimize deaths. Let be the set of donor areas. The optimization problem, called SEIR-OPT, is \col@sep \@classx\prepnext@tok\prepnext@tok\@classx\prepnext@tok\prepnext@tok\@classx\prepnext@tok\prepnext@tok\@classx\prepnext@tok\prepnext@tok\@classx\prepnext@tok\prepnext@tok\@acol
|
|||||||||||||||||||||||||||||||||||||||||||||||||||||||||||||||||||||||||||||||||||||||||||
The variables in SEIR-OPT are all of the state variables, , and at times . Their initial values at are computed in (12). Also, is a variable because the timing of variant emergence depends on ; see Section 3.2. Nondonor deaths are given a weight in the objective. We consider deaths in the donor areas (self-interest) by setting or all areas (altruism) by setting . Constraint (4) limits vaccinations to the budget of doses available for day , (4)-(4) are the difference equations, and (4) computes . There is no need to adjust using (13) - (15) because the constraints make feasible.
One cannot directly solve SEIR-OPT due to the complex dependence of on through the timing of the variant. Instead, we iteratively solve a “Lagrangian” problem. As a surrogate for the cost of the variant emerging earlier, we use the unvaccinated, nondonor infectious-days to construct a “Lagrangian” term. Weighting infections by the time remaining in the scenario gives somewhat better numerical results. The new objective is
| (32) |
Instead of letting depend on in (11), we fix their values. For the first iteration we use the value from an initial policy, then update it each iteration using the policy found in the previous iteration.
Even with constant , the constraints contain cubic terms, such as (recall that is quadratic), in (4-4). These terms result in nonconvex constraints, making the Lagrangian problem very difficult to solve. If the behavior dynamics in (2) are removed, using (1) instead, the constraints are nonconvex quadratics. Bertsimas, et. al (Bertsimas et al. 2020) solve a similar problem by solving a sequence of linear approximations. At each iteration, given the current vaccine allocation , (4) - (4) are solved to get the current infectious population estimates , , and , as well as . Then we replace the variables and in (4) - (4) with the constants and . To keep the linearization error from being too large, we add linearized regularization constraints to prevent from differing too much from :
| (33) |
Without behavior dynamics, to match (1). With behavior,
to match (2). Here, is an exploration tolerance that is updated at each iteration by a multiplicative factor . To summarize, the approximation is a linear program (LP) that differs from SEIR-OPT in the objective (32), fixed , fixed , and added constraints (33).
The iterative approach to the Lagrangian problem solves this LP to find the best solution that gives effective infections that are close to . The current solution is updated and the difference equations solved to find , and . We call this step “Simulate”. The process is repeated until the objective function converges. Because the Lagrangian problem is not convex, this algorithm is not guaranteed to converge to a global minimum; see Section 5.1. To start the algorithm, an initial policy is chosen and simulated. We use static priority policies that allocate vaccine in priority order.
Algorithm 1 describes how we solve SEIR-OPT. It has an outer loop that updates and an inner loop that updates and . The inner loop seeks to solve the Lagrangian problem. Let denote the optimal value of the Lagrangian (32) and be the corresponding SEIR-OPT objective (4). Each iteration of the inner loop solves the LP to find , then simulates to obtain a valid solution to the difference equations. Let be the Lagrangian (32), evaluated for this and , and be the corresponding SEIR-OPT objective (4). Successive LPs may not be improving, so the best for the current is stored in . Similarly, it may not terminate at the LP with the best SEIR-OPT objective (4), so the best is stored in and the corresponding best simulated policy in . The stopping criterion shown for the inner loop is that changes by less than in one iteration; however, because does not always improve between iterations, instead of we used an iteration limit and checked convergence by computing the maximum change in the LP variables .
The outer loop searches for the minimum of . Since is the SEIR-OPT objective function, this minimum occurs at the best solution to SEIR-OPT found by the Lagrangian problem. We use a global search method, using geometrically spaced ’s over an initial range, selecting the best interval(s), and iterating with a finer partition for . The parameters used in the algorithm are listed in Table 4.
| Parameter | Base Value | Description |
| 1500 | Vaccine doses available on day | |
| 0 | Objective function weight on nondonor deaths | |
| to | Range of Lagrange multiplier in search | |
| 500 | Initial exploration tolerance for LP | |
| 0.8 | Exploration convergence parameter for LP |
5 Results
All numerical tests used Gurobi 11.0 on a laptop with a 1.70GHz processor, 16 GB of RAM, and four physical cores. We focus on scenarios with more than two areas, where more interesting optimal policies were found. Baseline parameter values are shown in Tables 2 and 3. These parameter estimates are based on COVID-19 data and are derived in Holleran et al (Holleran et al. 2024), except where noted here:
- -
(initial population): We assume the donor population is twice as large as in each nondonor area. For three areas, then, the donor comprises 50%. This approximates a global scenario with the main producers of COVID-19 vaccine (China, the European Union, India, the Unites States, and Russia) as the donor area, since they represent 47% of global population, and other countries divided into two areas with equal populations (roughly, they could be Africa and all others). The scenario with 10 areas assumes more geographic isolation. It could apply to a pandemic model where China and India are sufficiently isolated to be excluded, the European Union and the United States are the donor area, and other nations are grouped into nine nondonor areas. The donor population is arbitrarily set to 100,000, i.e., the donor deaths reported are per 100,000.
- -
(initial rate of new infections): is multiplied by the average duration of infectiousness to obtain the initial prevalence. Thus, . One COVID-19 study estimates a prevalence in the U.S. of on December 31, 2020 (Chiu and Ndeffo-Mbah 2021). Converting, . However, cases were higher in January 2021 and much higher in January 2022, so we use as a baseline in all areas.
- -
Person-days of infection before appearance of new variant: The mean is set so that the variant risk increases in the middle of the 180 day scenario; see Figure 5. The coefficient of variation is set to , reasoning that the number of independent mutations is on the order of and , as described in Section 3.2.
Table 5 lists parameter changes for the scenarios referenced in the following sections. Scenario 3.1 uses the baseline values, so it is based on COVID-19 data when available.
For Scenario 3.1, policies other than donor-first, and policies that do not use static priorities, are beneficial. We then explored other scenarios to find when this benefit was most significant, resulting in those in Table 5. In the other scenarios, , meaning that vaccination does not reduce the case mortality rate. While this is not realistic for COVID-19, it may be for some viruses.
| Scenario | 3.1 | 3.2 | 4.1 | 10.1 |
| Areas | 3 | 3 | 4 | 10 |
| Population (1000’s) | 100, 50, 50 | 100, 50, 50 | 100, 50, 50, 50 | 100, 50,…,50 |
| Initial new cases | 0.00072, | 0.0018, | 0.0018, | 0.001, |
| per person | 0.00072, | 0.00072, | 0.00072,… | 0.002, 0.0018,… |
| per day | 0.00072 | 0.00072 | 0.00072 | 0.0006, 0.0004 |
| Infection multiplier | 1, 1, 1 | 1, 1, 1 | 1, 1, 1, 1 | 1.5, 1,…,1 |
| Vaccinated mortality rate | 0.0079 | 0.014 | 0.014 | 0.014 |
| Mean infectious days | ||||
| before variant (1000’s) | 55 | 50 | 75 | 300 |
| Coefficient of variation | ||||
| of infectious days | ||||
| before variant | 1/3 | 0.71 | 1/3 | 1/3 |
| Vaccine doses available | ||||
| each day | 1500 | 1500 | 2000 | 3000 |
5.1 Convergence of the Algorithm
In this section we test the convergence of the algorithm. Three questions are of interest:
- 1.
Is the solution of the Lagrangian problem (32) for some near-optimal for the original problem? That is, is the surrogate for the Lagrangian adequate?
- 2.
Does the global search find (nearly) the best value of ?
- 3.
Does the iterative LP approximation converge to a near-optimal solution of the Lagrangian problem, independent of the initial policy?
We cannot definitively answer the first question because the original problem is intractable. Thus, we refer to the best policy found by the algorithm, rather than the optimal policy. However, after extensive testing on scenarios with three areas, it is encouraging that when one of the priority policies is much better than the others, our algorithm converges to that policy and that when priority policies are nearly tied, our algorithm usually finds a policy noticeably better than the best priority policy.
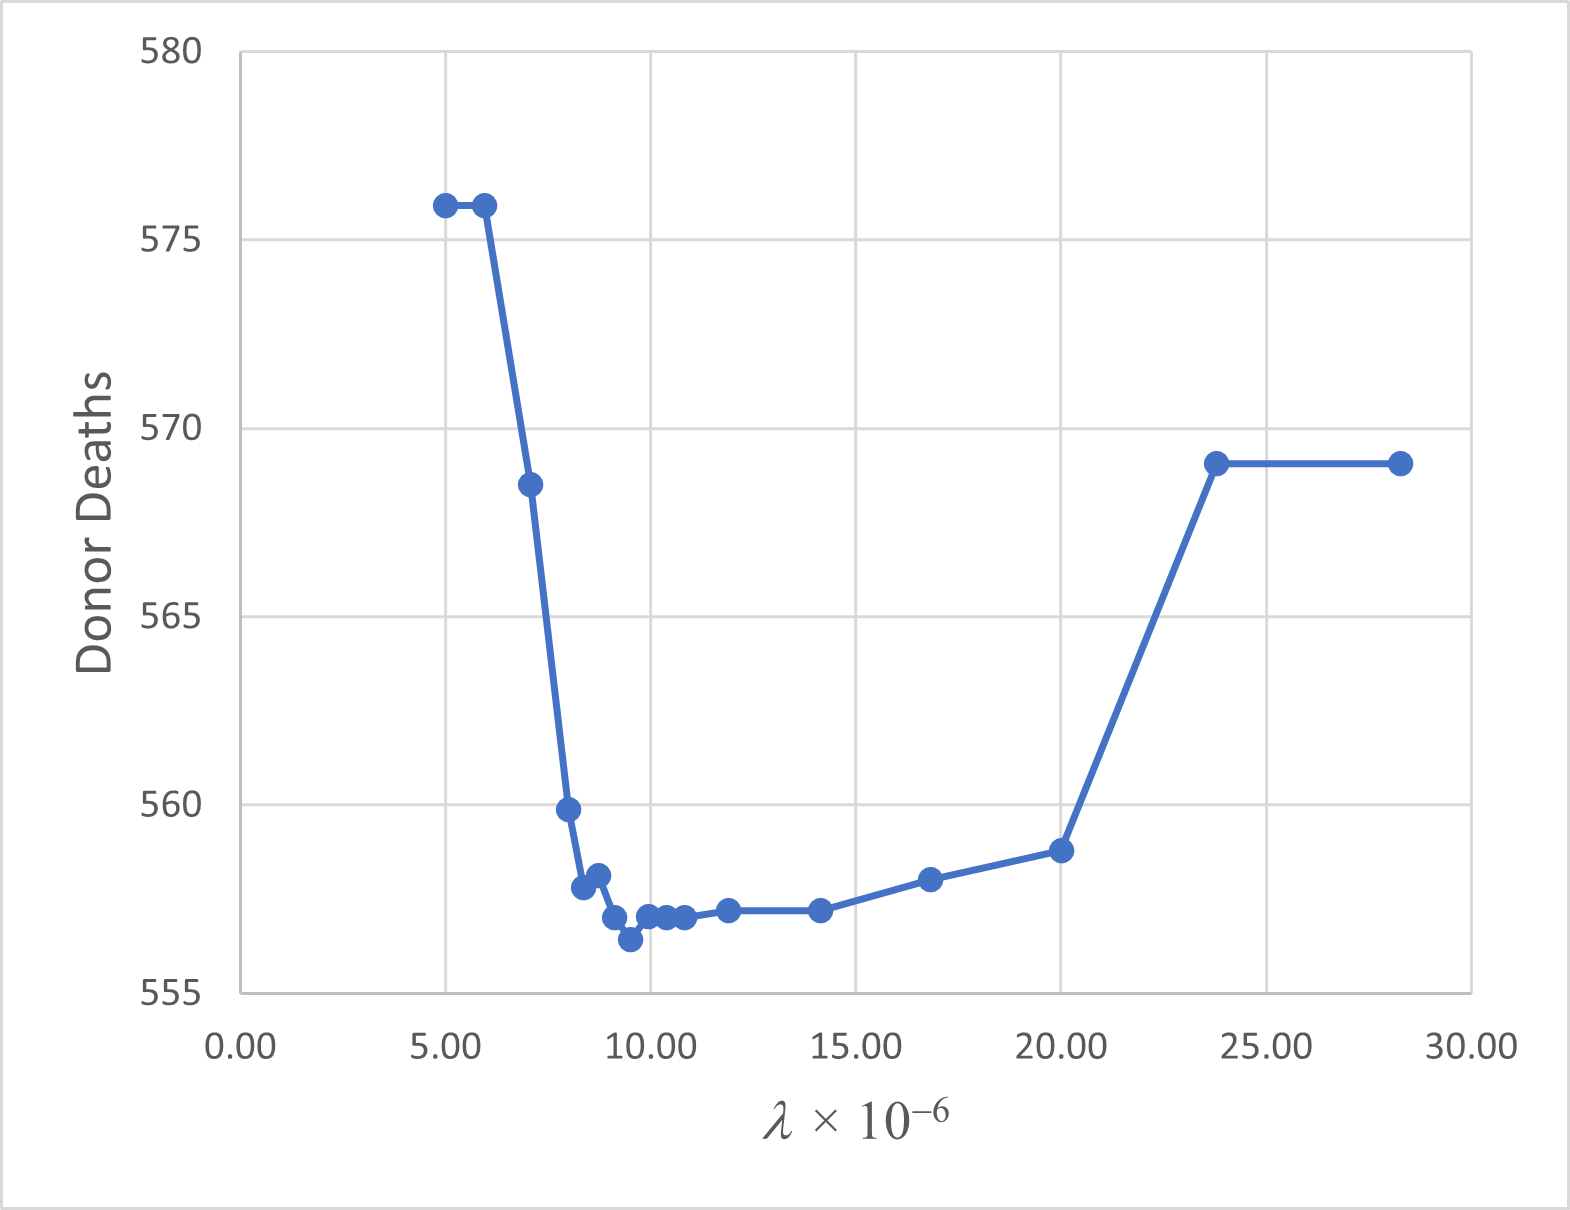
Figure 2 is a representative example of how the objective of the best policy found varies with . The policy structure generally varies as expected with : for small , a donor-first policy is used and as increases, donor vaccinations begin later. At the largest two values of graphed, they start on day 47 and the policy is essentially donor-last (the last 140 vaccinations in the nondonor areas occur on day 85 at the end of all vaccinations, but this appears to be due to not finding the exact optimum).
This graph is not quite unimin: there are two local minima with slightly larger objective function values between them. It also has a flat spot to the right of the global minimum, where the objective and the policy are essentially constant. These features necessitate a global search. Also, the fact that the non-monotone behavior occurs close to the global minimum motivates our use of a search algorithm that iteratively refines the grid near the best found. The slightly non-monotone behavior appears to be an artifact. The iterative LP convergence is approximate, so the best objective value found is also approximate. The solution for a given can also depend slightly on the previous solution, as its policy is used for initialization. These tests suggest that the search over is finding the global minimum, or very nearly so.
We tested the convergence of the iterative LP approximation for to 1000 and to 0.9 for Scenario 3.2. We found that when these step size parameters were large, the algorithm gets close to the best policy in very few iterations. However, after that the objective and policy oscillate with a period of two, presumably because it overshoots the reallocation to other areas (for more than three areas the period might be different). For smaller tolerances, the algorithm takes smaller steps, usually requires 10-30 iterations to reach its best policy, and again oscillates once it gets close to the best policy. We also measured the maximum change in , which is restricted by the regularization constraint (33). We found that when the best policy is complex, this change remains large, i.e., the disease trajectory continues to change significantly between iterations, until it is limited by (33). When the best policy is a priority policy, the policy converges quickly and so does the change in . We chose and because they found a slightly better policy than the other values tested; they also performed well in slight variants of Scenario 3.2. This is surprising, given the oscillating behavior. For simplicity, we used these values in all scenarios, rather than varying them for each scenario.
To check sensitivity to the initial policy, we tried every priority policy for Scenario 3.2. All objective values found were within 0.04%. The number of iterations required to find the best policy was also similar (14 or 15) for every initial policy, presumably because the optimal policy is far from a static priority.
These tests suggest that, while the algorithm does not find the exact optimal policy, it consistently finds a better, more complex policy. The parameter values, initial policy, and iteration limits used appear adequate to obtain the best, or very close to best, policy the algorithm can find. The structure of the policies found, discussed in the next section, also seem reasonable, suggesting that they are close to optimal.
5.2 Policy Structure
Results for Scenario 3.2 under the donor-first and best policy found are shown in Figures 3 and 4. Because the nondonor areas are identical, we arbitrarily give nondonor1 priority over nondonor2. Cumulative vaccinations, cases, and deaths, as well as the current susceptible and infectious () populations are shown by area. For both policies, the variant emerges in area nondonor2. The two vertical lines indicate the expected time when the variant arrives in this area and then the other areas (more precisely, the time when the number of cases reaches the mean number of cases at which the variant emerges). Figure 5 shows how, for the donor-first policy, the transmission rate increases from that of the current variant (0.6) to almost that of the new variant (1.2) as the risk of the variant appearing increases. The transmission rate increases more quickly than for the best policy because there are more cases in the nondonor unvaccinated populations.
We also observe in Figure 3 the emergence of a second wave of infections, which can be understood from the herd immunity critical proportions in Table 6. For the donor-first policy, the donor area reaches its vaccination limit of 78% at day 46. However, by day 82 the variant is 50% of cases in the donor area and infections rebound, forming a second wave. Before the variant, herd immunity in a fully unvaccinated donor area would require a critical (protected) proportion of 51%, whereas a fully vaccinated donor area would require a critical proportion of 0%. Thus, the actual critical proportion prior to variant emergence is within this range. This is reached before roughly day 20, when cases are 10% and susceptible vaccinated are 30%. However, as the transmission rate increases the population moves out of herd immunity. For example, in the donor area on day 82 the transmission rate is , there are 19,482 cumulative cases, 16,636 susceptible, and 63,198 susceptible vaccinated. The left side of (18) equals 0.394 and the right side is 0.409, barely meeting herd immunity; just after this the donor area loses herd immunity as increases. The donor area moves back into herd immunity near the end of the scenario as cases build.
For the best policy, the donor area has a larger first wave, but even without vaccination, it is moderated by behavior (fewer contacts). The variant arrives later, having little impact on transmission rates until all areas are vaccinated, and there is only a very small second wave. Comparing the nondonor areas in Figures 3 and 4, the first surge is much smaller under the best policy, resulting in the variant arriving much later. Under the best policy, total cases are only slightly reduced but are delayed significantly, both in donor and nondonor areas.
The best policy has a switching form. As can be seen from the vaccinations plotted in Figure 4, it switches between the nondonor areas, then switches to the donor area for days 33-73 until its vaccination limit is reached, then switches back to nondonor1. Some additional switching occurs, however, it amounts to less than one day’s vaccination budget and may be due to the algorithm not finding the exact optimal. As shown in Section 5.3, the best policy found is significantly better than any of the priority policies.
| Critical proportion | ||||||
| Before variant | 50% variant | 100% variant | ||||
| Unvacc. | Vacc. | Unvacc. | Vacc. | Unvacc. | Vacc. | |
| donor area | 0.51 | 0 | 0.68 | 0.10 | 0.76 | 0.33 |
| nondonor area | 0.57 | 0 | 0.72 | 0.21 | 0.79 | 0.41 |


5.3 Optimization Results
For the scenarios in Table 5, the optimization found a policy that is better than any priority policy. The results are shown in Table 7. Area 1 is the donor; the nondonor areas 2, 3, and 4 are identical. The best policies found give the vaccine to the donor on the days listed, though on a few of these days it is split between areas. In Scenario 3.2, the best policy has 0.7% fewer donor deaths than the best priority policy (where the donor has second priority) and 3.5% fewer than the donor-first policy. The improvement is somewhat larger for Scenarios 3.1 and 4.1 and is negligible for Scenario 10.1. Although these improvements are modest, the best policy also reduces total deaths and delays the arrival of the variant. The best policy for Scenarios 3.1 and 4.1 has a switching form.
In Scenario 10.1, area 1 is the donor and nondonor areas 2-10 have different initial infection rates, with area 2 having the greatest. The priority order of the nondonor areas is 2,…,10, i.e., the greatest infection rate is given highest priority. The best policy found is nearly identical to the best priority policy, both in structure and in donor deaths. This is the priority policy shown in Table 7. It gives priority 3 to the donor. Donor deaths for other priority policies are graphed in Figure 6. Because of the large number of areas and possible forms of policy, we are less confident that the algorithm found a near-optimal policy. However, the number of possible priority policies is much larger and it makes sense that one of them is near-optimal.
These results demonstrate that optimal policies can use switching, not static priority. The more complex policies found can also be used to construct switching policies with fewer switch points, which are easier to implement, that also outperform priority policies.
| Deaths | Time of | ||||
| Scenario | Policy | Donor | Total | variant (days) | Best |
| 3.1 | priority 1,2,3 | 414.6 | 1028.2 | 49.0 | |
| priority 2,1,3 | 412.9 | 902.4 | 69.5 | ||
| priority 2,3,1 | 417.7 | 739.1 | 165.1 | ||
| days 36-78 | 402.3 | 813.8 | 93.8 | ||
| 3.2 | priority 1,2,3 | 576.6 | 1301.4 | 45.5 | |
| priority 2,1,3 | 560.4 | 1200.0 | 61.8 | ||
| priority 2,3,1 | 570.0 | 1112.1 | 104.2 | ||
| days 33-73, 85 | 556.6 | 1180.02 | 71.4 | ||
| 4.1 | priority 1,2,3,4 | 560.3 | 1628.4 | 45.8 | |
| priority 2,1,3,4 | 538.2 | 1517.3 | 56.1 | ||
| priority 2,3,1,4 | 518.8 | 1385.6 | 68.5 | ||
| priority 2,3,4,1 | 521.0 | 1256.1 | 100.3 | ||
| days 42-73, 76 | 510.0 | 1352.4 | 76.5 | ||
| 10.1 | priority 2,3,1,4,…,10 | 838.7 | 3810.2 | 61.4 | |
| days 28-48 | 838.3 | 3873.9 | 62.4 | ||

5.4 Sensitivity Analysis
This section examines the sensitivity of the best policy and predicted deaths to several model parameters. Starting with Scenario 3.2 (because it showed the most benefit of policies that are not donor-first), parameters were varied one at a time. For each parameter value, all priority policies were simulated and the optimization algorithm was run. The best policy found is compared to a donor first policy in Table 8.
For the first sensitivity, we assumed that all areas contribute to emergence of the variant, not just the nondonor areas (“global variant”) and doubled , since a larger population is contributing to the variant. The donor-first policy is much better than other priority policies, and all policies have very similar time until the variant may appear. Next, the time horizon was extended. For both 270 and 360 days, the best policy found vaccinates the donor last; before that, it has some switching between the nondonor areas. In contrast, for the baseline scenario, the best policy vaccinates the donor after partially vaccinating both nondonor areas. Generally, we found that a donor-last policy performs better when the time horizon extends well beyond the mean time when the variant appears, so that the variant has more impact.
When behavior dynamics are increased (by decreasing ), the best policy vaccinates the donor slightly earlier than in the baseline scenario. Eliminating behavior dynamics (=0) leads to much higher deaths. The best policy, by far, is donor-first in this more severe scenario.
When the mean infectious days until the variant is increased, the best policy is a priority policy that gives second priority to the donor, beginning donor vaccinations nine days earlier than in the baseline scenario. When the mean infectious days until the variant is decreased to 40,000, this policy, which is fairly close to the baseline best policy, is again best. However, when the mean is decreased to 35,000, the donor-first policy is best, but only sightly better than the donor-second policy. These results show that the best policy is very sensitive to when the variant emerges and that a switching policy is only needed in a narrow range of parameter values.
| Best Policy | Deaths | Donor-first Policy | Variant | |||
| Parameter (baseline) | Value | Vacc. Donor | Donor | Total | Donor Deaths | (days) |
| Scenario 3.2 (used as baseline) | – | days 33-73, 85 | 556.6 | 1180.02 | 576.6 | 71.4 |
| Global variant, infectious days | – | priority 1,2,3 | 588.8 | 1267.6 | 588.8 | 52.7 |
| until variant | ||||||
| Time horizon (180 days) | 270 | days 47-86 | 666.9 | 1425.2 | 762.1 | 104.6 |
| 360 | days 47-86 | 632.8 | 1333.4 | 728.8 | 104.6 | |
| Behavior dynamics (0.03) | 0.02 | days 25-69 | 425.8 | 911.0 | 437.9 | 82.7 |
| 0 | priority 1,2,3 | 836.7 | 2049.7 | 836.7 | 30.3 | |
| Infectious days until variant | 70,000 | priority 2,1,3 | 488.6 | 1060.4 | 510.1 | 87.8 |
| (50,000) | 40,000 | priority 2,1,3 | 604.4 | 1279.6 | 607.5 | 50.6 |
| 35,000 | priority 1,2,3 | 621.4 | 1377.7 | 621.4 | 35.9 | |
6 Future Work and Conclusions
We have developed an SEIR-embedded optimization framework that determines vaccine allocation policies during a pandemic between a donor nation and one or more recipient (nondonor) nations. We present an iterative linear programming approximation approach to confirm those instances where a static priority policy is optimal and, when not optimal, to find switching policies that are superior. Policies with fewer switching points, which are easier to implement, can be constructed from the best policy found. The optimization method was demonstrated for up to 10 geographic areas and should be tractable for significantly more. Thus, it can be used to study a global pandemic by aggregating non-donor countries into groups.
The optimization model identifies realistic scenarios in which the donor nation prefers to give away vaccines before vaccinating its own population in order to minimize local deaths. Additionally, we find that policies other than donor-first can significantly delay the emergence of a more-contagious variant compared to donor-first, allowing more time for the development of improved treatments against the virus. Moreover, in all scenarios studied, policies other than donor-first achieve dramatic reduction in total deaths with only a small increase (and occasionally even a decrease) in donor-country deaths. Thus, vaccine distribution is not a zero-sum game between donor and nondonor countries.
Our SEIR model and optimization framework permits a flexible weighting of multiple objectives to minimize COVID-19 deaths in the donor country and in total so that questions of equitable distribution of vaccines during a pandemic can be thoroughly examined.
Our model does not consider logistical delays in globally distributing and administering vaccinations; vaccine supply is assumed to be the key constraint. Further, we assume the timeline is short enough so that vaccine willingness does not change significantly and that immunity does not wane enough to need to administer additional vaccine doses. Thus, there is no incentive to stockpile vaccine for future needs. Although almost all parameters of the model were estimated using COVID-19 data, we generally did not use country-specific data. To use the model for specific donor countries and groups of interacting countries, country-specific population, infection rate, and transmission data could be used. We leave this to future work.
Declarations
The authors declare that they have no competing interests.
References
- GAVI (2022) GAVI: COVAX Dose Donation Table. https://www.gavi.org/news/document-library/covax-dose-donation-table. Accessed 18 Aug. 2022 (2022)
- COVID-19 Vaccine Delivery Partnership (2022) COVID-19 Vaccine Delivery Partnership: Accelerating COVID-19 vaccine deployment: Removing obstacles to increase coverage levels and protect those at high risk. Technical report (April 2022). Accessed at https://www.who.int/publications/m/item/accelerating-covid-19-vaccine-deployment on 7 June 2022
- Hunter et al. (2022) Hunter, D.J., Karim, S.S.A., Baden, L.R., Farrar, J.J., Hamel, M.B., Longo, D.L., et al.: Addressing vaccine inequity — Covid-19 vaccines as a global public good. New England Journal of Medicine 386, 1176–1179 (2022). https://www.nejm.org/doi/full/10.1056/NEJMe2202547
- Asundi et al. (2021) Asundi, A., O’Leary, C., Bhadelia, N.: Global COVID-19 vaccine inequity: The scope, the impact, and the challenges. Cell Host Microbe 29(7), 1036–1039 (2021)
- Ghebreyesus (2021) Ghebreyesus, T.A.: Five steps to solving the vaccine inequity crisis. PLOS Global Public Health 1(10) (2021). https://doi.org/10.1371/journal.pgph.0000032
- Emanuel et al. (2020) Emanuel, E.J., Persad, G., Kern, A., Buchanan, A., Fabre, C., Halliday, D., et al.: An ethical framework for global vaccine allocation. Science 369(6509), 1309–1312 (2020)
- Gupta et al. (2022) Gupta, S., Starr, M.K., Farahani, R.Z., Asgari, N.: Pandemics/epidemics: Challenges and opportunities for operations management research. Manufacturing & Service Operations Management 24(1), 1–23 (2022) https://doi.org/10.1287/msom.2021.0965
- Choi (2021) Choi, T.-M.: Fighting against COVID-19: what operations research can help and the sense-and-respond framework. Annals of Operations Research (2021) https://doi.org/10.1007/s10479-021-03973-w
- Jordan et al. (2021) Jordan, E., Shin, D.E., Leekha, S., Azarm, S.: Optimization in the context of COVID-19 prediction and control: A literature review. IEEE Access 9, 130072–130093 (2021) https://doi.org/10.1109/ACCESS.2021.3113812
- Kaplan (2020) Kaplan, E.H.: COVID-19 scratch models to support local decisions. Manufacturing & Service Operations Management 22(4), 645–655 (2020) https://doi.org/10.1287/msom.2020.0891
- Salem and Moreno (2022) Salem, F.A., Moreno, U.F.: A multi-agent-based simulation model for the spreading of diseases through social interactions during pandemics. Journal of Control Automation and Electrical Systems (2022) https://doi.org/10.1007/s40313-022-00920-3
- Mahmood et al. (2020) Mahmood, I., Arabnejad, H., Suleimenova, D., Sassoon, I., Marshan, A., Serrano-Rico, A., et al.: FACS: a geospatial agent-based simulator for analysing COVID-19 spread and public health measures on local regions. Journal of Simulation (2020) https://doi.org/10.1080/17477778.2020.1800422
- Angelopoulou and Mykoniatis (2022) Angelopoulou, A., Mykoniatis, K.: Hybrid modelling and simulation of the effect of vaccination on the COVID-19 transmission. Journal of Simulation (2022) https://doi.org/10.1080/17477778.2022.2062260
- Thompson and Wattam (2021) Thompson, J., Wattam, S.: Estimating the impact of interventions against COVID-19: From lockdown to vaccination. PLOS One 16(12) (2021) https://doi.org/10.1371/journal.pone.0261330
- Kaplan et al. (2021) Kaplan, E.H., Wang, D., Wang, M., Malik, A.A., Zulli, A., Peccia, J.: Aligning SARS-CoV-2 indicators via an epidemic model: application to hospital admissions and RNA detection in sewage sludge. Health Care Management Science 24(2, SI), 320–329 (2021) https://doi.org/10.1007/s10729-020-09525-1
- Lotfi et al. (2022) Lotfi, R., Kheiri, K., Sadeghi, A., Tirkolaee, E.B.: An extended robust mathematical model to project the course of COVID-19 epidemic in Iran. Annals of Operations Research (2022) https://doi.org/10.1007/s10479-021-04490-6
- Wang (2022) Wang, G.: Stay at home to stay safe: Effectiveness of stay-at-home orders in containing the COVID-19 pandemic. Production & Operations Management (2022) https://doi.org/10.1111/poms.13685
- Duarte et al. (2022) Duarte, H.O., Siqueira, P.G., Antunes Oliveira, A.C., Moura, M.d.C.: A probabilistic epidemiological model for infectious diseases: The case of COVID-19 at global-level. Risk Analysis (2022) https://doi.org/10.1111/risa.13950
- Khalilpourazari and Doulabi (2021) Khalilpourazari, S., Doulabi, H.H.: Designing a hybrid reinforcement learning based algorithm with application in prediction of the COVID-19 pandemic in Quebec. Annals of Operations Research (2021) https://doi.org/10.1007/s10479-020-03871-7
- Medrek and Pastuszak (2021) Medrek, M., Pastuszak, Z.: Numerical simulation of the novel coronavirus spreading. Expert Systems with Applications 166 (2021) https://doi.org/10.1016/j.eswa.2020.114109
- Wang et al. (2020) Wang, K., Ding, L., Yan, Y., Dai, C., Qu, M., Jiayi, D., Hao, X.: Modelling the initial epidemic trends of COVID-19 in Italy, Spain, Germany, and France. PLOS One 15(11) (2020) https://doi.org/10.1371/journal.pone.0241743
- Algarni et al. (2022) Algarni, A.D., Ben Hamed, A., Hamdi, M., Elmannai, H., Meshoul, S.: Mathematical COVID-19 model with vaccination: a case study in Saudi Arabia. PeerJ Computer Science 8 (2022) https://doi.org/10.7717/peerj-cs.959
- Bagger et al. (2022) Bagger, N.-C.F., Hurk, E., Hoogervorst, R., Pisinger, D.: Reducing disease spread through optimization: Limiting mixture of the population is more important than limiting group sizes. Computers & Operations Research 142 (2022) https://doi.org/10.1016/j.cor.2022.105718
- Kumar et al. (2021) Kumar, S., Xu, C., Ghildayal, N., Chandra, C., Yang, M.: Social media effectiveness as a humanitarian response to mitigate influenza epidemic and COVID-19 pandemic. Annals of Operations Research (2021) https://doi.org/10.1007/s10479-021-03955-y
- Parro et al. (2021) Parro, V.C., Lafeta, M.L.M., Pait, F., Ipolito, F.B., Toporcov, T.N.: Predicting COVID-19 in very large countries: The case of Brazil. PLOS One 16(7) (2021) https://doi.org/10.1371/journal.pone.0253146
- Perakis et al. (2022) Perakis, G., Singhvi, D., Lami, O.S., Thayaparan, L.: Covid-19: A multiwave SIR-based model for learning waves. Production & Operations Management (2022) https://doi.org/10.1111/poms.13681
- Qian and Ukkusuri (2021) Qian, X., Ukkusuri, S. V: Connecting urban transportation systems with the spread of infectious diseases: A trans-SEIR modeling approach. Transportation Research Part B-Methodological 145, 185–211 (2021) https://doi.org/10.1016/j.trb.2021.01.008
- Chen and Kong (2022) Chen, Z., Kong, G.: Hospital admission, facility-based isolation, and social distancing: An SEIR model with constrained medical resources. Production & Operations Management (2022) https://doi.org/10.1111/poms.13702
- Sainz-Pardo and Valero (2021) Sainz-Pardo, J.L., Valero, J.: COVID-19 and other viruses: Holding back its spreading by massive testing. Expert Systems with Applications 186 (2021) https://doi.org/10.1016/j.eswa.2021.115710
- Kumar et al. (2021) Kumar, A., Choi, T.-M., Wamba, S.F., Gupta, S., Tan, K.H.: Infection vulnerability stratification risk modelling of COVID-19 data: a deterministic SEIR epidemic model analysis. Annals of Operations Research (2021) https://doi.org/10.1007/s10479-021-04091-3
- Yu and Hua (2021) Yu, M., Hua, Z.: Embedding isolation, contact tracing, and quarantine in transmission dynamics of the coronavirus epidemic-a case study of COVID-19 in Wuhan. Service Science (2021) https://doi.org/10.1287/serv.2021.0291
- Kemp et al. (2021) Kemp, F., Proverbio, D., Aalto, A., Mombaerts, L., d’Herouel, A.F., Husch, A., et al.: Modelling COVID-19 dynamics and potential for herd immunity by vaccination in Austria, Luxembourg and Sweden. Journal of Theoretical Biology 530 (2021) https://doi.org/10.1016/j.jtbi.2021.110874
- Mak et al. (2022) Mak, H.-Y., Dai, T., Tang, C.S.: Managing two-dose COVID-19 vaccine rollouts with limited supply: Operations strategies for distributing time-sensitive resources. Production and Operations Management 31, 4424–4442 (2022) https://doi.org/10.1111/poms.13862
- Lazebnik and Blumrosen (2022) Lazebnik, T., Blumrosen, G.: Advanced multi-mutation with intervention policies pandemic model. IEEE Access 10, 22769–22781 (2022)
- Bertsimas et al. (2021) Bertsimas, D., Boussioux, L., Cory-Wright, R., Delarue, A., Digalakis, V., Jacquillat, A., et al.: From predictions to prescriptions: A data-driven response to COVID-19. Health Care Management Science 24, 253–272 (2021). https://doi.org/10.1007/s10729-020-09542-0
- Shami and Lazebnik (2022) Shami, L., Lazebnik, T.: Economic aspects of the detection of new strains in a multi-strain epidemiological–mathematical model. Chaos, Solitons & Fractals 165(112823) (2022) https://doi.org/10.1016/j.chaos.2022.112823
- Volpert et al. (2021) Volpert, V., Banerjee, M., Sharma, S.: Epidemic progression and vaccination in a heterogeneous population. application to the Covid-19 epidemic. Ecological Complexity 47 (2021) https://doi.org/10.1016/j.ecocom.2021.100940
- Dolbeault and Turinici (2020) Dolbeault, J., Turinici, G.: Heterogeneous social interactions and the COVID-19 lockdown outcome in a multi-group SEIR model. Mathematical Modelling of Natural Phenomena 15 (2020) https://doi.org/10.1051/mmnp/2020025
- Gillis et al. (2021) Gillis, M., Urban, R., Saif, A., Kamal, N., Murphy, M.: A simulation-optimization framework for optimizing response strategies to epidemics. Operations Research Perspectives 8 (2021) https://doi.org/10.1016/j.orp.2021.100210
- Bellomo et al. (2022) Bellomo, N., Burini, D., Outada, N.: Multiscale models of Covid-19 with mutations and variants. Networks & Heterogeneous Media 17(3), 293–310 (2022) https://doi.org/10.3934/nhm.2022008
- Khyar and Allali (2020) Khyar, O., Allali, K.: Global dynamics of a multi-strain SEIR epidemic model with general incidence rates: application to COVID-19 pandemic. Nonlinear dynamics 102(1), 489–509 (2020)
- Shahmanzari et al. (2022) Shahmanzari, M., Tanrisever, F., Eryarsoy, E., Sensoy, A.: Managing disease containment measures during a pandemic. Production & Operations Management (2022) https://doi.org/10.1111/poms.13656
- Schwarzendahl et al. (2022) Schwarzendahl, F.J., Grauer, J., Liebchen, B., Löwen, H.: Mutation induced infection waves in diseases like COVID-19. Scientific Reports 12, 9641 (2022) https://doi.org/10.1038/s41598-022-13137-w
- Bicher et al. (2022) Bicher, M., Rippinger, C., Zechmeister, M., Jahn, B., Sroczynski, G., Muehlberger, N., et al.: An iterative algorithm for optimizing COVID-19 vaccination strategies considering unknown supply. PLOS One 17(5) (2022) https://doi.org/10.1371/journal.pone.0265957
- Westerink-Duijzer et al. (2020) Westerink-Duijzer, L.E., Schlicher, L.P.J., Musegaas, M.: Core allocations for cooperation problems in vaccination. Production and Operations Management 29(7), 1720–1737 (2020) https://doi.org/10.1111/poms.13184
- Gutjahr (2023) Gutjahr, W.J.: Fair and efficient vaccine allocation: A generalized Gini index approach. Production and Operations Management, 1–21 (2023) https://doi.org/10.1111/poms.14080
- Duijzer et al. (2018) Duijzer, L.E., van Jaarsveld, W.L., Wallinga, J., Dekker, R.: Dose-optimal vaccine allocation over multiple populations. Production & Operations Management 27, 143–159 (2018)
- Li et al. (2022) Li, M.L., Bouardi, H.T., Lami, O.S., Trikalinos, T.A., Trichakis, N., Bertsimas, D.: Forecasting COVID-19 and analyzing the effect of government interventions. Operations Research (2022). https://doi.org/10.1287/opre.2022.2306
- Rotesi et al. (2021) Rotesi, T., Pin, P., Cucciniello, M., Malik, A.A., Paintsil, E.E., Bokemper, S.E., et al.: National interest may require distributing COVID‑19 vaccines to other countries. Scientific Reports 11, 18253 (2021). https://www.nature.com/articles/s41598-021-97544-5
- Mitcham and Keisler (2022) Mitcham, J., Keisler, J.: Multi-attribute COVID-19 policy evaluation under deep uncertainty. Annals of Operations Research (2022) https://doi.org/10.1007/s10479-022-04592-9
- Salgotra et al. (2021) Salgotra, R., Moshaiov, A., Seidelmann, T., Fischer, D., Mostaghim, S.: Optimal control policies to address the pandemic health-economy dilemma. In: 2021 IEEE Congress on Evolutionary Computation (CEC 2021). IEEE Congress on Evolutionary Computation, pp. 720–727 (2021)
- Pan et al. (2022) Pan, Y., Ng, C.T., Dong, C., Cheng, T.C.E.: Information sharing and coordination in a vaccine supply chain. Annals of Operations Research (2022) https://doi.org/10.1007/s10479-022-04562-1
- Tavana et al. (2021) Tavana, M., Govindan, K., Nasr, A.K., Heidary, M.S., Mina, H.: A mathematical programming approach for equitable COVID-19 vaccine distribution in developing countries. Annals of Operations Research (2021) https://doi.org/10.1007/s10479-021-04130-z
- Holleran et al. (2024) Holleran, A., Martonosi, S.E., Veatch, M.: To give or not to give? Pandemic vaccine donation policy. Public Health 233, 164–169 (2024) https://doi.org/10.1016/j.puhe.2024.05.011
- Van Oorschot et al. (2022) Van Oorschot, K.E., Van Wassenhove, L.N., Jahre, M.: Collaboration–competition dilemma in flattening the COVID-19 curve. Production & Operations Management, 1–17 (2022) https://doi.org/10.1111/poms.13709
- Fudolig and Howard (2020) Fudolig, M., Howard, R.: The local stability of a modified multi-strain SIR model for emerging viral strains. PLoS ONE 15(12), 0243408 (2020) https://doi.org/10.1371/journal.pone.0243408
- Bertsimas et al. (2020) Bertsimas, D., Ivanhoe, J., Jacquillat, A., Li, M., Previero, A., Lami, O.S., Bouardi, H.T.: Optimizing vaccine allocation to combat the COVID-19 pandemic. medRxiv (2020). Preprint. [Available at https://www.medrxiv.org/content/10.1101/2020.11.17.20233213v1]
- Chiu and Ndeffo-Mbah (2021) Chiu, W.A., Ndeffo-Mbah, M.L.: Using test positivity and reported case rates to estimate state-level COVID-19 prevalence and seroprevalence in the United States. PLOS Computational Biology 17, 1–19 (2021)