Deep Laser Cooling of Thulium Atoms to Sub-µK Temperatures in Magneto-Optical Trap
Abstract
Deep laser cooling of atoms, ions, and molecules facilitates the study of fundamental physics as well as applied research. In this work, we report on the narrow-line laser cooling of thulium atoms at the wavelength of with the natural linewidth of , which widens the limits of atomic cloud parameters control. Temperatures of about , phase-space density of up to and number of trapped atoms were achieved. We have also demonstrated formation of double cloud structure in an optical lattice by adjusting parameters of the magneto-optical trap. These results can be used to improve experiments with BEC, atomic interferometers, and optical clocks.
keywords
spectroscopy; magneto-optical trap; Doppler cooling; thulium1 Introduction
In modern atomic physics, laser cooling of atoms, ions, and molecules is an essential technique for producing cold and dense clouds of particles. Such ensembles are the subject of study in many fields, including few- and many-body physics Blume 2012; Bloch et al. 2012, absolute and differential quantum gravimetry Janvier et al. 2022; Ménoret et al. 2018; Del Aguila et al. 2018, quantum simulations Bloch et al. 2012, Bose–Einstein condensate (BEC) Ketterle et al. 1996; Warner et al. 2021; Miyazawa et al. 2022; Schreck and Druten 2021; Davletov et al. 2020, and optical lattice clocks Ludlow et al. 2015; bou 2021.
Bose–Einstein condensation requires the atomic de Brogile wavelength to be compared with atom–atom distance. The main aim of laser cooling techniques in such experiments is to achieve a better starting point for evaporative cooling. Laser cooling techniques typically allows to reach the temperatures of about () with the typical phase-space density (PSD) of Griesmaier et al. 2005; Lu et al. 2011; Kraft et al. 2009; Aikawa et al. 2012; Stellmer et al. 2009, while the PSD of 2.612 is required to achieve BEC Ketterle et al. 1996. A further increase in PSD is achieved with evaporative cooling which reduces the number of particles.
Another application of laser-cooled ensembles is the optical lattice clocks. The state-of-the-art level of relative frequency uncertainty of lattice optical clocks is on a scale of Ludlow et al. 2015. In such experiments, cold atoms are trapped in optical lattices at the magic wavelengths to reduce the lattice-induced frequency shifts of the clock transition, but high-order polarizabilities lead these frequency shifts to be dependent on vibrational states of atoms in the potential Ushijima et al. 2018. High temperature means that more vibrational states are occupied, leading to undesirable frequency shifts and to decoherence of the clock transition excitation Blatt et al. 2009; Fedorova et al. 2020. It is desirable that a significant number of atoms should be in the lowest vibrational state, which usually corresponds to temperatures of the order of ().
Thulium atoms are proven to be a convenient platform for optical clocks Golovizin et al. 2019, quantum simulators, and experiments with BEC Khlebnikov et al.; Davletov et al. 2020. The clock transition in thulium has low sensitivity to most environmental frequency shifts while others can be eliminated by the interrogation protocol Golovizin et al. 2021. In the case of quantum simulators and BEC experiments, thulium atoms are promising due to large number of Fano–Feshbach resonances and relatively high magnetic moment of the ground state () Khlebnikov et al. 2021.
All current experiments with cold atomic thulium are performed with the single stable bosonic isotope thulium-169. The experimental procedure starts with two-stage laser cooling which typically produces several millions of atoms at a temperature of . In experiments with BEC, this results in PSD of after the second stage cooling Davletov et al. 2020. In optical clock experiments, such temperature leads to mean vibrational number , which corresponds to the relative frequency shift at the level and hard-to-control uncertainty Mishin et al. 2022.
Thus, a deeper cooling of thulium atoms is preferable to solve both of these problems. The minimal temperature attainable with Doppler cooling is related to the linewidth of cooling transition according to the relationship , where —the Planck constant, and —the Boltzmann constant. The first transition used for laser cooling of Tm atoms is the transition at the wavelength of (“blue”, 1st stage magneto-optical trap, MOT, Figure 1a) with the natural linewidth of . While Doppler limit for this transition equals , it is possible to work in a sub-Doppler regime with temperatures as low as . However, the atomic cloud in this case becomes larger with lower number of atoms. The second laser cooling transition has the wavelength of (“green”, 2nd stage MOT, Figure 1a) and the linewidth of . The recapture efficiency from the first stage MOT is close to 100%, and the Doppler limit equals .
In this work, we present a detailed experimental analysis of not yet studied transition for deep cooling of thulium atoms, at the wavelength of with the linewidth of . The Doppler limit for this transition is which is lower than the recoil limit for this transition , where —atomic mass of thulium.
In Section 2 we describe our experimental results: the efficient recapture of atoms from the 1st and the 2nd into the 3rd-stage MOT (Section 2.1), the optimization of the narrow line cooling process (Section 2.2), the confirmation of the low temperature of MOT with the Doppler broadening of the clock transition spectroscopy (Section 2.3), the effect of the intermediate 2nd-stage MOT (Section 2.4), and the possibility to form double-structured clouds in an optical lattice (Section 2.5). Finally, we draw the conclusions in Section 3.
2 Results
2.1 Loading of Broadband MOT
As a starting point, we cool and trap thulium atoms using two-stage MOT (see Figure 1b). The Zeeman slower and the first-stage MOT work on the strong transition at a wavelength of with the natural linewidth of . This transition is also used for the probe radiation. The second-stage MOT works on transition with natural linewidth of . The transfer efficiency of atoms from the 1st to 2nd stage MOT is near , and the final temperature of atoms is about . More details can be found in Sukachev et al. 2014; Kalganova et al. 2017.
In this work, we follow a common approach of working with narrow-line magneto-optical trap Katori et al. 1999; Kraft et al. 2009; Yamaguchi et al. 2019, when in the beginning of narrow-line cooling the cooling radiation frequency is modulated to broaden its spectrum and increase the velocity capturing range. Note that the laser itself is stabilized to an ultrastable cavity (see Appendix A). We use triangle-shaped frequency modulation for convenience, as it was readily available for our direct digital synthesizers (DDS), based on AD9910 chip. The spectrum of triangle-shaped modulated signal differs only slightly from the spectrum of a more commonly used harmonic frequency modulation.
We determined modulation parameters that work well for our setup: amplitude of and frequency of about . The center frequency of the modulated radiation is typically red-detuned further from the line center than the frequency of the narrow-line cooling stage radiation (see Figure 1b). Note that there is a wide range of acceptable modulation parameters which may depend on magnetic fields and the atomic cloud geometry and temperature.
In our case, since we start with much lower temperature of atoms ( vs. 0.5–3 mK in Katori et al. 1999; Lu et al. 2011; Maier et al. 2014), the -long broadband cooling results in stable trapping of atoms from the 2nd stage MOT and temperature of the atoms. We use it as a starting point for investigation of single-frequency MOT performance.
2.2 Optimal MOT Parameters
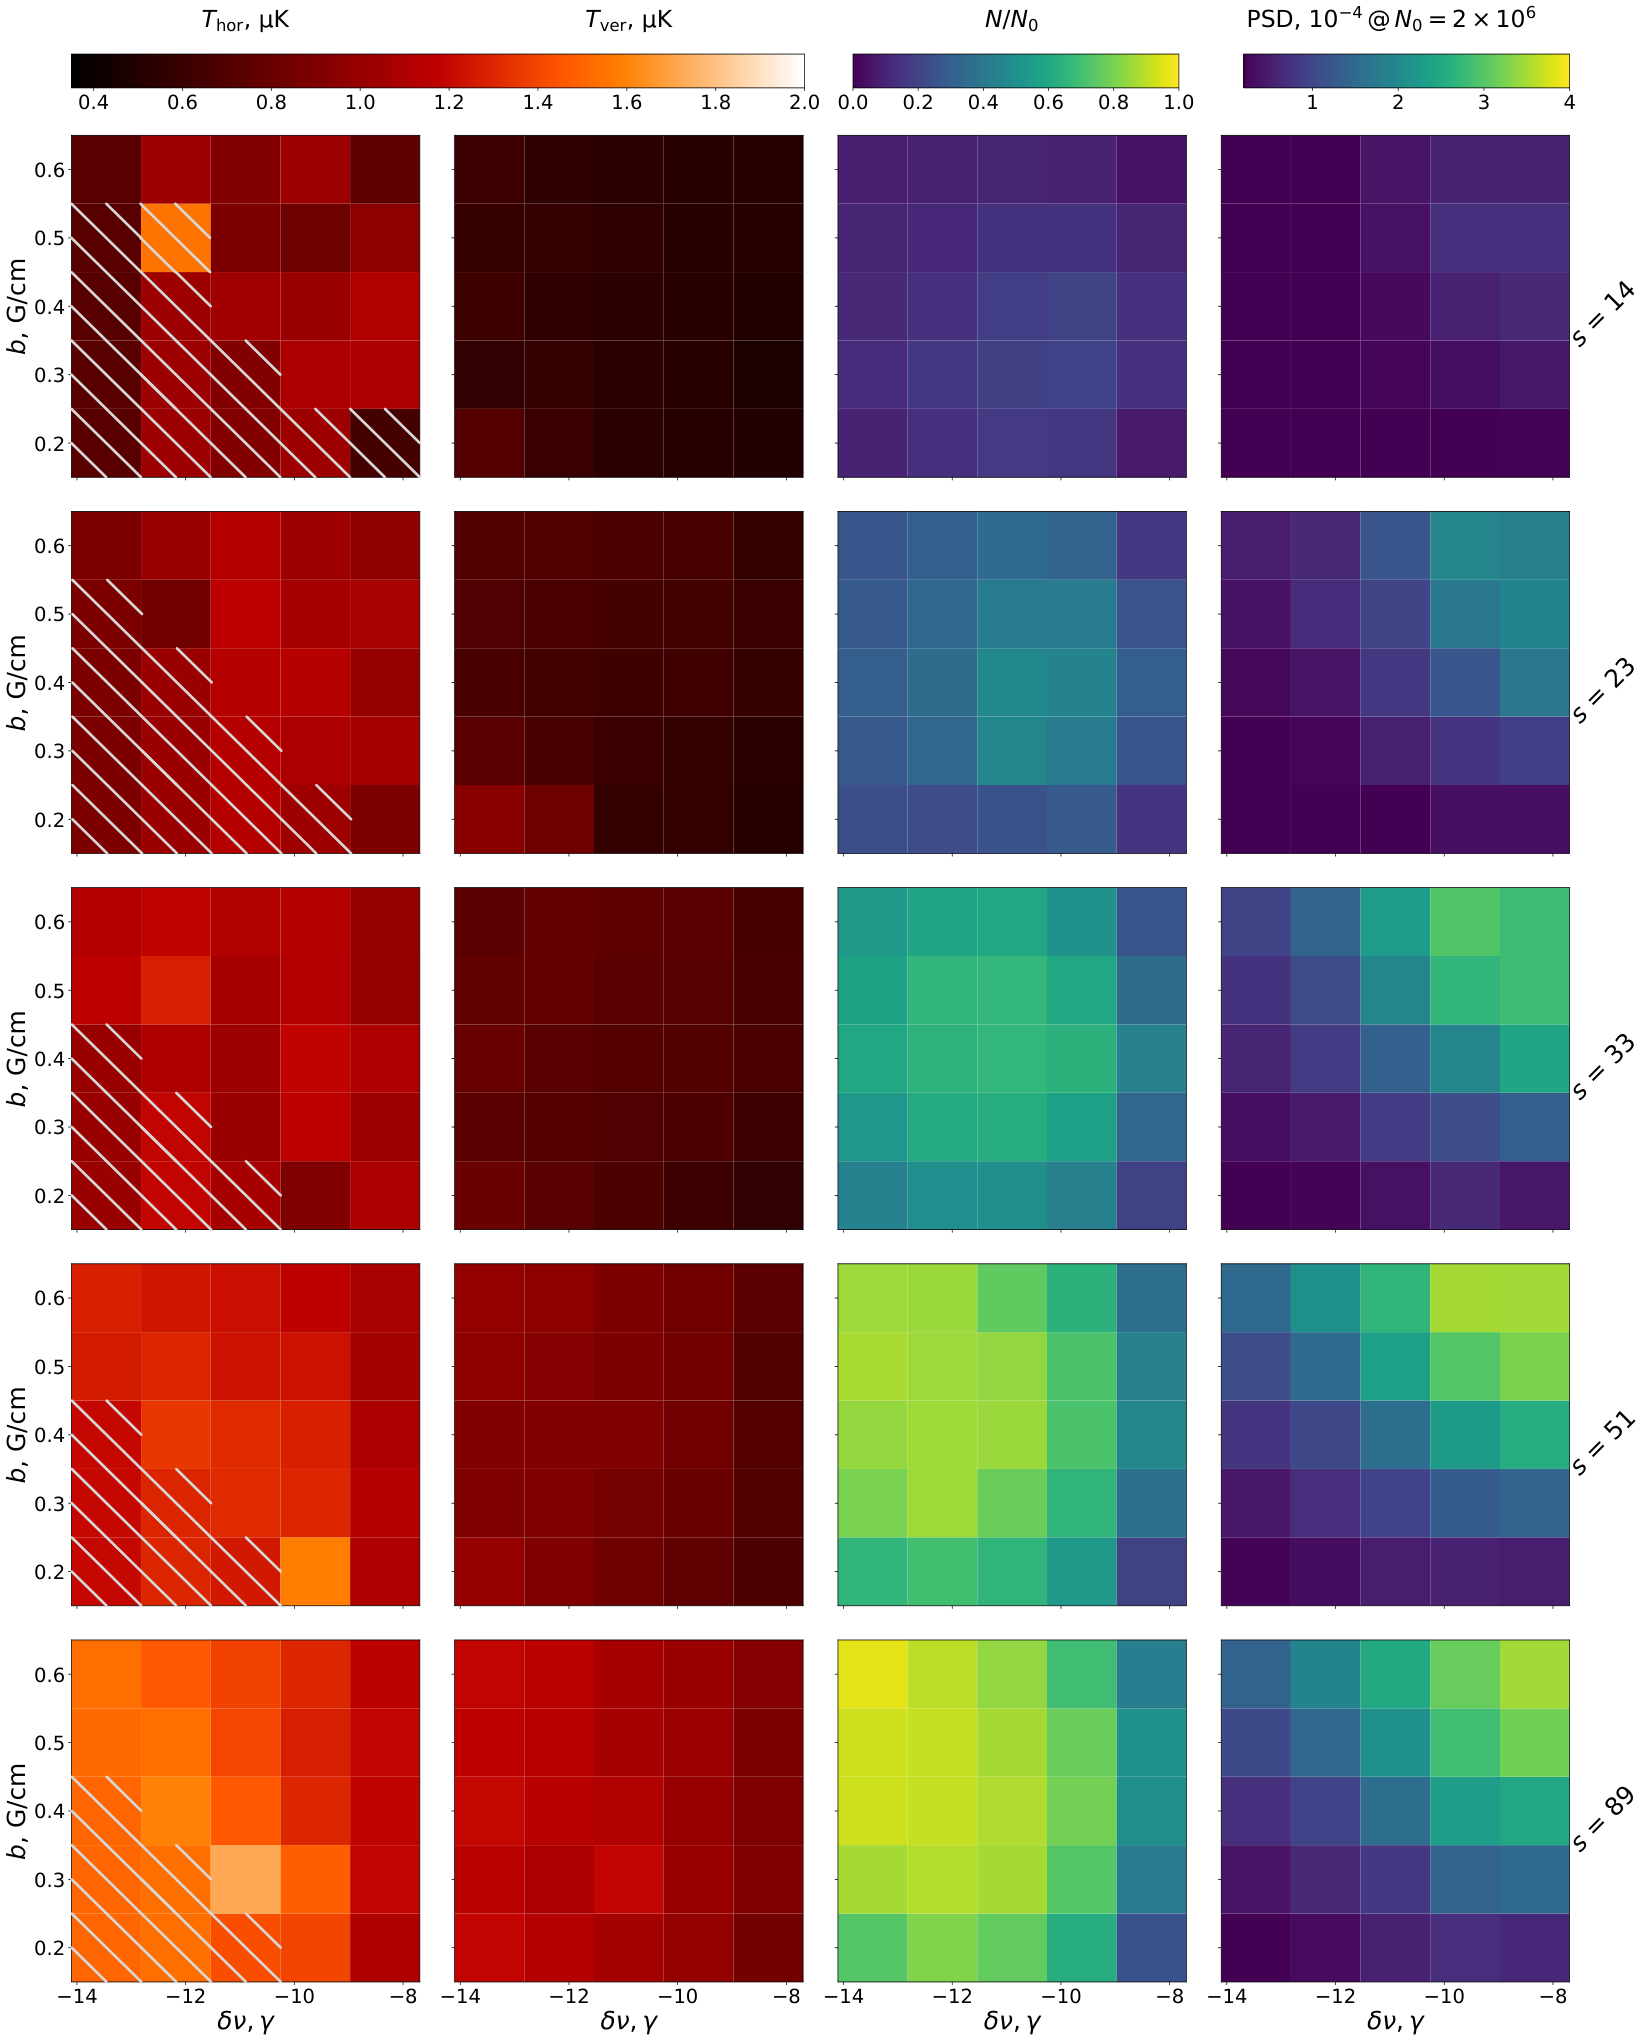
The key parameters of atomic cloud after laser cooling are its temperature, size, number of atoms, and density (or phase-space density). We measured all of them for different gradients of anti-Helmholtz magnetic field, cooling radiation intensity (in units of saturation parameter , where ), and frequency detuning from resonance in units of natural linewidth . We varied optical power from (, the minimum optical power we could see MOT with) to (, increasing the optical power further would not lead to increasing the number of atoms or decreasing the temperature). The detuning was varied from (, closer to the resonance we lost a significant amount of atoms) to (, further from the resonance the horizontal cloud size becomes too big and complicates the temperature measurements). For the discussion on the line center position, see Appendix A. The magnetic field gradient was varied from to ( to for the current in coils).
The pulses timing sequence we used for this experiment is presented in Figure 1b. The duration of 2nd-stage cooling was fixed to . The delay time between narrow-line cooling and the probe pulse was varied between 0–30 ms for the time-of-flight measurement. We calibrated our CMOS-camera in advance to get the number of atoms as well as the horizontal and vertical cloud dimensions from the images. The cloud size dependance on the time-of-flight was used to deduce the temperature, and the cloud size before the release of atoms with their number and temperature was used for the PSD calculation.
The results are shown in Figure 2. We show atomic temperatures in the horizontal and vertical directions (measured by time-of-flight technique), fraction of recaputered atoms , and phase-space density after of single-frequency MOT.
Firstly, one can see that minimum temperature is achieved at low intensities and small detunings. However, in this parameter space the number of trapped atoms is less than , and the PSD is below . The fraction of trapped atoms can be significantly increased almost up to by increasing intensity, detuning, and magnetic field gradient. The explanation is that the velocity capturing range is increasing. Maximum PSD of is achieved at , , and and corresponds to a compromise between the cloud temperature (, ) and the number of atoms ( or ), and is shifted to low detunings which makes the atomic cloud more compact. This is a significant order of magnitude increase in PSD compared to the previously reported values for MOT Davletov et al. 2020.
2.3 Temperature Measurement with Clock Transition Spectroscopy
The standard method for temperature measurements in this kind of experiment is time-of-flight method Lett et al. 1988. In order to measure low temperatures, it is preferable to allow for a long time-of-flight of about 20–30 ms which corresponds to a free-fall distance of 2–4 mm. The field of view of our camera was about . To keep the intensity of the probe beam constant along this distance, we used vertical probe beam.
Note that for narrow-line Doppler cooling, we often get a typical bowl-shape of the cloud, with horizontal dimensions being significantly larger than vertical. In this case we see that laser cooling works more efficiently in the vertical direction than in horizontal plane, and the resulting temperature is inhomogeneous which can be seen in the first two columns in Figure 2.
The cloud temperature in the vertical direction is of particular interest to us because of our experiments with optical lattice clock. In such experiments, the clock transition spectroscopy is often performed with an optical lattice aligned vertically. As mentioned previously in Section 1, lowering the vertical temperature of the cloud would reduce the mean longitudinal vibrational sublevel population:
| (1) |
In this equation, is the maximum vibrational number in the potential which is defined by the potential depth, is the longitudinal frequency of the optical lattice.
In our experiments, we operate the optical lattice at a wavelength of 1063.9 nm which is close to the magic wavelength which we will use in clock spectroscopy experiments Golovizin et al. 2019; Mishin et al. 2022. The typical vibrational frequency and maximum vibrational number . With lowering the temperature of atoms from which we achieved in our previous works, to about achieved in this work, the mean longitudinal vibrational sublevel population changes from to , which is a great starting point for further experiments. Note that further decreasing of mean vibrational number could be achieved via optical lattice sifting (for more information about this method and typical optical lattice parameters in our experiments, see Mishin et al. 2022).
In order to independently measure low temperatures that we get in the vertical direction, we used clock line spectroscopy in a free space which we were able to do due to the experiments with optical clocks. After the capturing of atoms into the 3rd MOT (as in Figure 1b), we wait about for the magnetic fields to turn off. During that time, only -molasses work to restrain atomic cloud from expanding. After that, a -long clock pulse excites atoms along the vertical direction, and we detect the remaining atoms with the probe pulse and a CMOS-camera. The result of this experiment is presented in Figure 3a. The full width at half maximum of this line equals . In Figure 3b, we can see the result of the time-of-flight experiment, giving . This temperature corresponds to Doppler broadening of the clock transition linewidth. The similarity of the measured linewidth and the Doppler broadening assures correct measurements of the temperature of the atoms above and smallness of other residual broadenings, e.g., due to the Zeeman effect.
2.4 Effect of the 2nd-Stage MOT on Recapture Efficiency
While the recapturing efficiency of the broadband MOT from the 2nd-stage MOT is nearly 100%, we get only when loading it directly from the 1st-stage MOT. In order to understand what impacts this efficiency, we performed the following experiment. We kept only and during the 1st-stage MOT (in the experiments described above radiation at was also present) and varied duration of the 2nd-stage MOT (see Figure 1b). For each 2nd-stage MOT duration the number of atoms recaptured in broadband MOT is measured (Figure 4). Beside this, we also measured the cloud size and the temperature of atoms after the 2nd-stage MOT.
All the parameters have similar characteristic time dependence. Comparing (only the 1st-stage MOT) and (steady regime with 2nd-stage MOT), the initial cloud size decreases by a factor of 2 and the initial temperature decreases by a factor of 5. Since we observed almost 7-fold improvement of the number of captured atoms, we conclude that probably both these factors affect the capture efficiency, while the temperature seems to be the dominant one.
It is worth noting that with some optimization of the 1st-stage MOT, we could achieve recapture efficiency directly to the broadband MOT, with the downside of reduced initial number of atoms.
2.5 Two Atomic Clouds Producing
Narrow-line cooling can also be used in applications that require spatial control of the atomic cloud. Some recent works Bothwell et al. 2022; Zheng et al. 2022 show great interest in space resolved spectroscopy between separated regions of the atomic cloud or between different clouds in the same vacuum chamber. During the multistage cooling described above, one can alter the position of the atomic cloud by varying frequency detuning or magnetic field gradient, and thus control the process of recapturing atoms in the optical lattice creating multiple clouds.
In order to achieve two non-intersecting atomic clouds we keep optical lattice and frequency-broadened radiation on throughout the experiment.
First, atomic cloud is formed by -long second stage MOT (see left image on Figure 5). Since atoms are already relatively cold (), becomes captured in the optical lattice at the 2nd-stage MOT cloud position. After that, radiation turns off, and anti-Helmholtz magnetic field switches to the 3rd stage cooling regime. Atoms, which are not trapped into the optical lattice, move to the new position determined by the parameters of the MOT, as shown in the middle image of Figure 5. One can see that a small number of atoms is captured into the optical lattice in between positions of the 2nd and 3rd MOTs since the atomic cloud was shifting slowly down. Finally, we switch off MOT, and after non-trapped atoms fly away, we obtain two separated clouds in the optical lattice (right image in Figure 5).

Parameters of the frequency-broadened 3rd stage MOT were adjusted so that the resulting atomic clouds contain an equal number of atoms (about 7% of the initial number of trapped atoms in each cloud) and are spaced several cloud diameters apart (Figure 5). The main characteristics of resulting atomic clouds are mostly determined by the optical lattice. Note that here the optical lattice was formed by a single reflecting mirror, unlike some of our previous works with enhancement cavity Golovizin et al. 2019; Mishin et al. 2022. Final lifetimes and temperatures of clouds are similar, which enables space-resolved spectroscopy in two non-intersecting atomic clouds and is of interest for future works in this direction.
3 Discussion
The overall result of this work is extensive experimental analysis of different regimes of a narrow line MOT on transition in thulium. We have shown that we can achieve temperature of the atomic cloud as low as . When aiming for the highest phase-space density, we were able to reach at when starting with atoms in the 1st-stage MOT. This value is similar to those reported in other experiments with narrow-line MOTs Lu et al. 2011; Kraft et al. 2009; Aikawa et al. 2012; Stellmer et al. 2009. Implementation of this technique to experiments with thulium with Davletov et al. 2020 or Golovizin et al. 2021 atoms in the initial MOT, would result in . This value is 2 orders of magnitude larger than the initial PSD in Davletov et al. 2020, that should significantly speed up and increase efficiency of the following evaporative cooling.
The best performance of the narrow-line MOT is achieved using two preliminary stages of laser cooling on 410.6 nm and 530.7 nm transitions. Meanwhile, we have demonstrated up to 30% efficiency of the narrow-line MOT loading directly from the 1st-stage MOT, which operates on strong 410.6 nm transition. This is similar to some experiments with narrow-line MOTs Degenhardt et al. 2005; Lu et al. 2011, while less than in other works Katori et al. 1999, depending on atomic species. Hereby, one can choose between simplicity of the laser setup (i.e., the use of only 2 lasers at 410.6 nm and 506.2 nm) and performance, when using 3 stages of laser cooling.
Demonstrated deep laser cooling below would significantly improve optical lattice clocks since mostly the ground motional state should be occupied at such temperature and typical depth of optical lattice. For thulium atoms in the motional ground state we expect clock transition frequency shift from the optical lattice to be at the level with uncertainty at , including contribution from the higher-order polarizabilities.
Large sensitivity of MOT to the parameters of the experiment (like magnetic field gradient, power, and frequency of the cooling beams) can be used to achieve various advantages dependent on the task. One particular example is the use of sensitive 3rd MOT for creating double-structured atomic cloud. By adjusting cooling parameters, it is possible to get two clouds separated by 1 mm in the same optical lattice. Working with two separate but spatially close clouds, it is possible to eliminate a number of inconvenient frequency shifts and noise sources Zheng et al. 2022; Bothwell et al. 2022.
Author Contributions
Conceptualization, A.G. and N.K.; data curation, D.T. and A.G.; formal analysis, D.P. and D.T.; funding acquisition, A.G. and N.K.; investigation, D.P., D.T., D.M., M.Y. and A.G.; methodology, D.P., D.T. and D.M.; project administration, K.K. and N.K.; resources, D.K., V.S. and K.K.; software, D.T. and A.G.; supervision, V.S. and N.K.; validation, D.P., D.T., D.M. and A.G.; visualization, D.P. and D.T.; writing—original draft, D.P. and D.T.; writing—review and editing, D.M., A.G. and N.K. All authors have read and agreed to the published version of the manuscript.
Funding
This research was funded by Russian Science Foundation grant number 21-72-10108.
Data Availability Statement
The associated experimental data will be available from the authors upon reasonable request.
Conflicts of Interest
The authors declare no conflict of interest.
Abbreviations
The following abbreviations are used in this manuscript:
| MOT | Magneto-optical trap |
| BEC | Bose-Einstein condensate |
| PSD | phase-space density |
| AOM | acousto-optic modulator |
| ULE | ultra-low expansion glass |
Appendix A Laser Frequency Stabilization and Calibration
As a source of laser radiation at a wavelength of , we use Toptica Dl pro laser which provides up to optical power with a linewidth less than . The laser frequency is locked to one of the eigenmode of an utrastable cavity made of ultra-low expansion (ULE) glass. The temperature of ULE cavity was set near its zero thermal expansion point at . The cavity finesse is 47,500 and transmission is in resonance. We stabilized the frequency of the laser to the ULE cavity mode, nearest to the previously investigated transition frequency Provorchenko et al. 2021.
In order to be able to operate with the frequency detuning of the laser relative to the exact resonance as well as to compensate the long-term frequency drift of the reference ULE cavity, we perform transition resonance determination at least once a day. For this, we record absorption spectrum of the cooling radiation in cloud of thulium atoms, which is formed by the 2nd-stage MOT at .
After loading of atoms into the MOT, we switched off all the magnetic fields and waited for with only molasses working to prevent the expansion of the atomic cloud during that time. Then we excited atoms with a MOT beams and determined the probability of excitation with a probe beam and a CMOS-camera. Scanning the detuning of the laser, we obtained the spectrum (one of the measurements is shown in Figure 6).
We attribute the double-peak structure to Zeeman shift for different magnetic sublevels of thulium. The magnetic field inside the vacuum chamber might be inhomogeneous, and because of large atomic cloud in this experiment, different atoms might be in different magnetic field, and possibly on different magnetic sublevels. Taking into account -factors of the ground and excited states for the transition Martin et al. 1978, this structure can be explained by residual magnetic field difference on a scale of atomic cloud diameter . The double-peak structure is consistent, and is smoothed out with power broadening of the transition. We choose average frequency between the two peaks as an origin on the frequency scale because of the symmetry of the experiment. This corresponds also to the line center of the power-broadened spectrum.
From day-to-day calibration we observe linear cavity drift of . On a typical timescale of our experiment of , this results in frequency shift which is on the order of the transition natural linewidth (). As we typically work at the frequency detuning of , the laser frequency drift does not affect the experiments. We note, that in the future we plan to automatically compensate this drift with an acousto-optic modulator in front of the reference cavity.
References
- Blume (2012) Blume, D. Few-body physics with ultracold atomic and molecular systems in traps. Rep. Prog. Phys. 2012, 75, 046401.
- Bloch et al. (2012) Bloch, I.; Dalibard, J.; Nascimbene, S. Quantum simulations with ultracold quantum gases. Nat. Phys. 2012, 8, 267–276.
- Janvier et al. (2022) Janvier, C.; Ménoret, V.; Desruelle, B.; Merlet, S.; Landragin, A.; dos Santos, F.P. Compact differential gravimeter at the quantum projection-noise limit. Phys. Rev. A 2022, 105, 022801.
- Ménoret et al. (2018) Ménoret, V.; Vermeulen, P.; Le Moigne, N.; Bonvalot, S.; Bouyer, P.; Landragin, A.; Desruelle, B. Gravity measurements below 10-9g with a transportable absolute quantum gravimeter. Sci. Rep. 2018, 8, 21–23.
- Del Aguila et al. (2018) Del Aguila, R.P.; Mazzoni, T.; Hu, L.; Salvi, L.; Tino, G.M.; Poli, N. Bragg gravity-gradiometer using the 1S0-3P1 intercombination transition of 88Sr. New J. Phys. 2018, 20, 1–10.
- Ketterle et al. (1996) Ketterle, W.; Andrews, M.; Davis, K.; Durfee, D.; Kurn, D.; Mewes, M.O.; Van Druten, N. Bose–Einstein condensation of ultracold atomic gases. Phys. Scr. 1996, 1996, 31.
- Warner et al. (2021) Warner, C.; Lam, A.Z.; Bigagli, N.; Liu, H.C.; Stevenson, I.; Will, S. Overlapping Bose-Einstein condensates of Na 23 and Cs 133. Phys. Rev. A 2021, 104, 033302.
- Miyazawa et al. (2022) Miyazawa, Y.; Inoue, R.; Matsui, H.; Nomura, G.; Kozuma, M. Bose-Einstein condensation of europium. Phys. Rev. Lett. 2022, 129, 223401.
- Schreck and Druten (2021) Schreck, F.; Druten, K.v. Laser cooling for quantum gases. Nat. Phys. 2021, 17, 1296–1304.
- Davletov et al. (2020) Davletov, E.; Tsyganok, V.; Khlebnikov, V.; Pershin, D.; Shaykin, D.; Akimov, A. Machine learning for achieving Bose-Einstein condensation of thulium atoms. Phys. Rev. A 2020, 102, 011302.
- Ludlow et al. (2015) Ludlow, A.D.; Boyd, M.M.; Ye, J.; Peik, E.; Schmidt, P.O. Optical atomic clocks. Rev. Mod. Phys. 2015, 87, 637.
- bou (2021) Collaboration, Boulder Atomic Clock Optical Network BACON. Frequency ratio measurements at 18-digit accuracy using an optical clock network. Nature 2021, 591, 564–569.
- Griesmaier et al. (2005) Griesmaier, A.; Werner, J.; Hensler, S.; Stuhler, J.; Pfau, T. Bose-Einstein condensation of chromium. Phys. Rev. Lett. 2005, 94, 160401.
- Lu et al. (2011) Lu, M.; Burdick, N.Q.; Youn, S.H.; Lev, B.L. Strongly dipolar Bose-Einstein condensate of dysprosium. Phys. Rev. Lett. 2011, 107, 190401.
- Kraft et al. (2009) Kraft, S.; Vogt, F.; Appel, O.; Riehle, F.; Sterr, U. Bose-Einstein condensation of alkaline earth atoms: Ca 40. Phys. Rev. Lett. 2009, 103, 130401.
- Aikawa et al. (2012) Aikawa, K.; Frisch, A.; Mark, M.; Baier, S.; Rietzler, A.; Grimm, R.; Ferlaino, F. Bose-Einstein condensation of erbium. Phys. Rev. Lett. 2012, 108, 210401.
- Stellmer et al. (2009) Stellmer, S.; Tey, M.K.; Huang, B.; Grimm, R.; Schreck, F. Bose-Einstein condensation of strontium. Phys. Rev. Lett. 2009, 103, 200401.
- Ushijima et al. (2018) Ushijima, I.; Takamoto, M.; Katori, H. Operational Magic Intensity for Sr Optical Lattice Clocks. Phys. Rev. Lett. 2018, 121, 198–201.
- Blatt et al. (2009) Blatt, S.; Thomsen, J.W.; Campbell, G.K.; Ludlow, A.D.; Swallows, M.D.; Martin, M.J.; Boyd, M.M.; Ye, J. Rabi Spectroscopy and Excitation Inhomogeneity in a 1D Optical Lattice Clock. Phys. Rev. A 2009, 80, 052703.
- Fedorova et al. (2020) Fedorova, E.S.; Tregubov, D.O.; Golovizin, A.A.; Mishin, D.A.; Provorchenko, D.I.; Khabarova, K.Y.; Sorokin, V.N.; Kolachevsky, N.N. Rabi spectroscopy of the clock transition in thulium atoms in a one-dimensional optical lattice. Quantum Electron. 2020, 50, 220–224.
- Golovizin et al. (2019) Golovizin, A.; Fedorova, E.; Tregubov, D.; Sukachev, D.; Khabarova, K.; Sorokin, V.; Kolachevsky, N. Inner-shell clock transition in atomic thulium with a small blackbody radiation shift. Nat. Commun. 2019, 10, 1724.
- (22) Khlebnikov, V.A.; Pershin, D.A.; Tsyganok, V.V.; Davletov, E.T.; Cojocaru, I.S. Random to chaotic temperature transition in low-field Fano-Feshbach resonances of cold thulium atoms. arXiv 2019, arXiv:1902.00201.
- Golovizin et al. (2021) Golovizin, A.A.; Tregubov, D.O.; Fedorova, E.S.; Mishin, D.A.; Provorchenko, D.I.; Khabarova, K.Y.; Sorokin, V.N.; Kolachevsky, N.N. Simultaneous bicolor interrogation in thulium optical clock providing very low systematic frequency shifts. Nat. Commun. 2021, 12, 5171.
- Khlebnikov et al. (2021) Khlebnikov, V.; Tsyganok, V.; Pershin, D.; Davletov, E.; Kuznetsova, E.; Akimov, A. Characterizing the temperature dependence of Fano-Feshbach resonances of ultracold polarized thulium. Phys. Rev. A 2021, 103, 023306.
- Mishin et al. (2022) Mishin, D.A.; Provorchenko, D.I.; Tregubov, D.O.; Golovizin, A.A.; Khabarova, K.Y.; Sorokin, V.N.; Kolachevsky, N.N. Effect of optical lattice field on characteristics of a clock transition in thulium atoms. Quantum Electron. 2022, 52, 505.
- Sukachev et al. (2014) Sukachev, D.D.; Kalganova, E.S.; Sokolov, A.V.; Fedorov, S.A.; Vishnyakova, G.A.; Akimov, A.V.; Kolachevsky, N.N.; Sorokin, V.N. Secondary laser cooling and capturing of thulium atoms in traps. Quantum Electron. 2014, 44, 515–520.
- Kalganova et al. (2017) Kalganova, E.; Prudnikov, O.; Vishnyakova, G.; Golovizin, A.; Tregubov, D.; Sukachev, D.; Khabarova, K.; Sorokin, V.; Kolachevsky, N. Two-temperature momentum distribution in a thulium magneto-optical trap. Phys. Rev. A 2017, 96, 033418.
- Katori et al. (1999) Katori, H.; Ido, T.; Isoya, Y.; Kuwata-Gonokami, M. Magneto-optical trapping and cooling of strontium atoms down to the photon recoil temperature. Phys. Rev. Lett. 1999, 82, 1116.
- Yamaguchi et al. (2019) Yamaguchi, A.; Safronova, M.; Gibble, K.; Katori, H. Narrow-line cooling and determination of the magic wavelength of Cd. Phys. Rev. Lett. 2019, 123, 113201.
- Maier et al. (2014) Maier, T.; Kadau, H.; Schmitt, M.; Griesmaier, A.; Pfau, T. Narrow-line magneto-optical trap for dysprosium atoms. Opt. Lett. 2014, 39, 3138–3141.
- Lett et al. (1988) Lett, P.D.; Watts, R.N.; Westbrook, C.I.; Phillips, W.D.; Gould, P.L.; Metcalf, H.J. Observation of atoms laser cooled below the Doppler limit. Phys. Rev. Lett. 1988, 61, 169.
- Bothwell et al. (2022) Bothwell, T.; Kennedy, C.J.; Aeppli, A.; Kedar, D.; Robinson, J.M.; Oelker, E.; Staron, A.; Ye, J. Resolving the gravitational redshift across a millimetre-scale atomic sample. Nature 2022, 602, 420–424.
- Zheng et al. (2022) Zheng, X.; Dolde, J.; Lochab, V.; Merriman, B.N.; Li, H.; Kolkowitz, S. Differential clock comparisons with a multiplexed optical lattice clock. Nature 2022, 602, 425–430.
- Golovizin et al. (2021) Golovizin, A.; Tregubov, D.; Mishin, D.; Provorchenko, D.; Kolachevsky, N. Compact magneto-optical trap of thulium atoms for a transportable optical clock. Opt. Express 2021, 29, 36734–36744.
- Degenhardt et al. (2005) Degenhardt, C.; Stoehr, H.; Lisdat, C.; Wilpers, G.; Schnatz, H.; Lipphardt, B. Calcium optical frequency standard with ultracold atoms : Approaching 10-15 relative uncertainty. Phys. Rev. A 2005, 72, 062111 .
- Provorchenko et al. (2021) Provorchenko, D.I.; Tregubov, D.O.; Mishin, D.A.; Golovizin, A.A.; Fedorova, E.S.; Khabarova, K.Y.; Sorokin, V.N.; Kolachevsky, N.N. Investigation of the transition at a wavelength of 506 nm, intended for deep cooling of thulium atoms. Quantum Electron. 2021, 51, 479.
- Martin et al. (1978) Martin, W.; Zalubas, R.; Hagan, L. Atomic Energy Levels—The Rare Earth Elements.(The Spectra of Lanthanum, Cerium, Praseodymium, Neodymium, Promethium, Samarium, Europium, Gadolinium, Terbium, Dysprosium, Holmium, Erbium, Thulium, Ytterbium, and Lutetium); [66 Atoms and Ions]; Technical Report; Department of Chemistry, Manchester College of Science and Technology (UK): Manchester, UK, 1978.