A Large-Scale Study of Personal Identifiability of Virtual Reality Motion Over Time
Abstract
In recent years, social virtual reality (VR), sometimes described as the “metaverse,” has become widely available. With its potential comes risks, including risks to privacy. To understand these risks, we study the identifiability of participants’ motion in VR in a dataset of 232 VR users with eight weekly sessions of about thirty minutes each, totaling 764 hours of social interaction. The sample is unique as we are able to study the effect of user, session, and time independently. We find that the number of sessions recorded greatly increases identifiability, and duration per session increases identifiability as well, but to a lesser degree. We also find that greater delay between training and testing sessions reduces identifiability. Ultimately, understanding the identifiability of VR activities will help designers, security professionals, and consumer advocates make VR safer.
Introduction
Recently, social virtual reality (VR) has been increasing in popularity. If it becomes a mainstay in the consumer space, it will be important to discover, understand, and address the risks associated with its use. One type of risk is the risk to privacy in these social spaces through re-identification attacks enabled by the rich nonverbal behavior traces [1] that VR captures.
Re-identification attacks work by aligning several types of partially identifying information. For example, knowing only one of a target’s ZIP code, gender, or date of birth is not likely to identify that target out of the entire United States population. However, these three data points together do identify about 87% of United States residents enumerated in the 1990 census [2]. A similar pattern holds for web browsers given several browser identifiers including version, operating system, language, and timezone [3]. In VR, this re-identification has been demonstrated by leveraging biometric information or nonverbal behaviors [4, 5, 6, 7].
In judging this threat, it is important to understand how long these identifying characteristics of individuals last. Some previous work [8] indicates a reduction of identifiability over the long term (e.g., several months), but this work focused on a very short activity chosen to produce identifying data, and sessions were not taken regularly to compare identifiability across many different moments in time. We have collected a large sample size (232 participants) of a long-duration activity (about 20 minutes per session) over a long timespan (8 weeks), which has enabled several contributions to the state of the art:
- •
results indicating short samples taken over several sessions are more identifying than longer samples in fewer sessions
- •
results indicating the delay between training data and testing data affects identifiability in the range from one to seven weeks
- •
corroboration with previous work [5] that identifiability is higher within a session than between separate sessions
- •
a motivation, selection, and justification of a classification model evaluation metric, multiclass AUC [9] that is invariant to the number of classes (i.e., individuals) being identified, producing more effective comparisons across disparate datasets, activities, and participant pool sizes
- •
a proposal of body-space coordinates, a refinement of the feature space so that the two horizontal dimensions is not based upon an arbitrary global coordinate system but rather relative to a person’s "forward" direction
- •
demonstration of an inference of gender and ethnicity from motion data, producing small to medium gains in accuracy over baseline models
Related Work
First, we give a short description of the risks across VR. Then, we focus on motion identifiability, first on authentication, a related task, then on works studying identification proper. We delineate between authentication and identification primarily by the user’s motivation. Given that the point of authentication is for a system to give a user elevated privileges, one can design an authentication method assuming the user is aware of the method and willing to participate. Identification does not provide access, and so the user is either not aware they are being identified or perhaps trying to avoid identification.
Risks of Social Virtual Reality
The growth of social VR has come with a commensurate growth in others urging caution. Many papers aim to anticipate the risks of VR while there is time to set norms and design new solutions. Slater and collaborators [10] describe several risks including identity hacking, an iteration on catfishing and identity theft where one user poses as another in a virtual environment.
There are risks to the use of single devices as well. Virtual and augmented reality devices collect substantial amounts of user data in order to operate. Modern headsets track motion of several body parts at about 90 times per second, capturing both deliberate and automatic behavior [11]. Biometric data itself is available in several ways. For example, height can be deduced from motion data [6] and inter-pupillary distance is available through the device API [12].
Data collection is not limited to the user, though. There are ethical considerations for bystanders who have their privacy compromised by virtual or augmented reality systems. In the case of devices tracking environments, such as always-on cameras in augmented reality systems, individuals who are not the user often lack data privacy safeguards and the ability to opt-out of data collection [13].
The operation of virtual and augmented reality requires a massive amount of data to be processed. It will be important to determine how to balance the access to this data between confidentiality and availability.
Motion-based authentication
One thread of work similar to our work in VR identification is authentication using motion captured in VR. Motion authentication in VR uses certain identifiable movements such as throwing a ball [14] or one’s natural walking pattern [15] that can be captured by the headset and controllers. The ability to utilize these characteristics as a method for authentication has been demonstrated by several works [16, 17, 18]. For example, Wang and collaborators [18] leverage identifiable head gestures (nodding, turning, and tilting) in order to develop a biometric authentication method. Similarly, Li and collaborators [16] utilize head movement patterns that are formed by a user in response to listening to music for a similar authentication task.
What makes authentication different from identification is that the person looking for authentication wants to be authenticated. This difference allows the authentication designer to ask the person to be authenticated to remember an action (e.g., how to nod one’s head in response to music) or to perform a specific activity (e.g., throwing a ball). In the identification problem we pose, this is unrealistic, as we are investigating identifiability given no interaction with the target at all.
Identification
The primary question regarding identification is twofold: what makes certain situations more amenable to identification than others, and what about those situations can be remedied? Based upon the work so far in VR motion identification, there are some threads of work beginning to appear.
First, the number of users to identify between, which we refer to as the classification size, affects accuracy. Three separate works explicitly analyze the relationship of classification size to accuracy [4, 6, 18], and all show effects that larger problems tend to have lower accuracy, even with the same training algorithm and underlying dataset. This is simply due to the number of classes increasing the likelihood of data points of another class sufficiently close to data of the class being queried.
Second, the fit of the featurization to the activity also affects accuracy. Activities that are less unlikely to be organically encountered while spending time in social VR seem to elicit higher identifiability accuracies. For example, training using the trajectories taken when placing blocks in specific places produces 98.6% accuracy [17], standing and watching 360° video produces 95% accuracy [6], throwing a ball at a target produces between 85% and 91% accuracy [8], pointing, grabbing, walking, and typing produce between 48% and 63% accuracy [4], and walking and interacting with virtual objects elicits 37-42% accuracy [5].
While some activities have been known to be identifying, e.g., walking, what is being discussed here is a fit between the featurization and the activity. Moore and collaborators intentionally did not innovate on the featurization in their work in order to make a direct comparison to previous work [6], and the feature set selected in that work was not good for walking as it was primarily on static biometric values. On the other hand, that same feature set was unreasonably effective for 360 videos because participants mostly stood in the same spot or simply looked around, allowing reliable measurements of height and hand controller orientation. One may naively think the most salient and most active measures for the activity (e.g., head direction in terms of pitch and yaw) would be the most identifying, but in fact it is the seemingly ancillary data of height and controller positioning. Though this ’fit’ is not clearly defined a priori, what is clear is that some tasks are more identifying than others, some tasks are more commonly performed than others, and those are not often found together.
Outside of these three threads on identifiability and its confounds, there are other works to highlight. There is less work about defense mechanisms for this data. M. Miller and collaborators [6] reduce the training data streams from 18DOF (head and hands position and rotation) to 3DOF (head rotation only) and reduce accuracy from 95% to 20% on a set of 511. Moore and collaborators [5] reduce accuracy from 89% to 32% on one set of data and 42% to 13% on a second by switching from position-based to velocity-based feature vectors. Nair, Gonzalo, and Song [19] use differential privacy methods to give plausible deniability to the biometric features they lay out in [7].
Additionally, in the same work [7] the authors use the identifying characteristics from the VR data collected by a client-type attacker to infer demographic information about each user. Compared to our work, they use a wider array of features, while we focused specifically on motion. Olade and collaborators [17] perform whitebox penetration testing of their authentication method (i.e., describing the inner workings of their authentication method so that it is known to the attacker), and find that intentional imitation of others, even if the attacker can watch the target, is not sufficient to fool their authentication process. Falk and collaborators [20] demonstrate identifiability across real-world video and VR-world video by leveraging available skeleton identification pipelines and innocuous social VR activities. Sabra and collaborators [21] leverage identified smartphone motion data to link identities to users in VR. Finally, R. Miller and collaborators [8] indicate that moving from one VR headset to another can reduce identifiability.
Finally, some work has been done in demonstrating how much more identifiable actions can become if a minor degree of influence in the virtual environment can be permitted. Falk and collaborators demonstrate identifiability on set a of N=5 when an unprivileged attacker (appearing to the target as simply another social VR user) asks the target to perform an innocuous activity like throwing a ball or eliciting an automatic reciprocal response like waving back [20]. This influence is even greater in cases where the attacker can design a gamut of activities for the target to perform [7].
Identification Over Time

In this work, we focus specifically on identification over time. The delay in time between a user’s training data (i.e., enrollment) and a user’s testing data (i.e., input) seems to affect accuracy. Works that have a minimal delay between training and testing have a higher accuracy than works with longer delays, e.g., a delay of 30 seconds between sessions and data collected over the span of about an hour with 98% accuracy [18], no delay and a span of 30 minutes with 98.6% accuracy [17], no delay and a span of 10-15 minutes with 95% accuracy [6], no delay and a span of 60 minutes with 89-95% accuracy [5], sessions recorded on "different days" with 90% accuracy [23], "at least three days [between]" with 63% accuracy [4], and one week later with 42% accuracy [5]. This effect of time delay is explicitly studied by R. Miller and collaborators [8] by combining two sets of data collected up to 18 months apart. They find no effect of delay on short-scale separations (within 24 hours) or medium-scale separations (comparing delays shorter than 3 days and longer than 3 days in one analysis, and the same but for 10 days in a second analysis). On long timescales, which in their work goes from 7 to 18 months, there were changes in behavior and a reduction in accuracy, which was not the case in the short- and medium-term delays. However, the delays were not regularly spaced and some varied widely in magnitude. It is still an open question how much and in what situations identifiability changes over time.
In contrast to previous work, we focus on an extremely common social VR activity, group discussion. This way, an attacker need not elicit a response nor manipulate the environment. As shown in Figure 1, this work is also on a far larger sample size than most, has more collected data than any other, and collected that data for a longer duration than most. Additionally, there is regular spacing of data collection periods. This dataset is uniquely posed to answer the next round of questions about identifiability.
Methods
This work reports on data collected as part of the Stanford Longitudinal VR Classroom Dataset over the course of two periods of data collection of classroom immersive VR [24]. Students met in small groups ranging from two to 12, and consented to have their verbal, nonverbal, and performance continually tracked during each course, typically eight weekly sessions which lasted about 30 minutes per session. In addition, each student provided self-report data about their experience after each session (see [24] for a detailed description). The current paper utilizes previously unreported data from the dataset, and focuses on identifiability of this nonverbal motion data. These studies from which we report data were each run using a social VR platform called ENGAGE. Each data collection period consisted of its own participant pool and conditions. Participant consent went through a rigorous process, approved by two separate organizations within the university. Moreover, there was a 3rd party arbiter who oversaw data collection during the course, and students had an interactive, hour-long discussion of the study procedures and data collection before deciding to consent. Data recorded included position and rotation of each participant’s headset and hand controllers.
Threat model
It is important to establish the kind of threat under study. In previous work on VR and identifiability, there are two dimensions upon which researchers have categorized threats. First, there is the question of what data is available to the attacker. Nair and collaborators [7] delineate between hardware-level attackers that have access to firmware, client-level attackers that have access to the headset APIs, server-level attackers that have access to the telemetry data sent to the servers and ’unprivileged user’ attacker which is another VR system partaking in the same social virtual world. Along this dimension, we focus on the unprivileged user.
The second aspect of space of threat models is the capability of the attacker to influence the behavior of the participant, and the extent to which this can be done. For example, is the attacker designing a virtual world [7], are they another user that is interacting with the user [20], or do they wish not to interact with the target entirely? In our work, we focus on no interaction at all. This may occur because the attacker is working with previously-collected data, does not want to be vulnerable in the virtual world, or has data collected at scale and cannot interact with each user.
This threat model is selected because it is the least privileged attacker. Therefore, findings based on this work are likely to be applicable to all attacks leveraging motion data. It also sets a baseline on threat for all these other conditions. Finally, there are some cases in which this may be the mode of an attacker, e.g., large-scale surveillance where individuals are not queried directly, re-identification attacks where actions are stored for a period of time before being queried, or any other situations in which the attacker does not which to have any direct interaction with the target. Note that this threat model is quite different from the traditional authentication threat model in which a user attempts to gain unauthorized access by posing as another user.
We have also selected the activity, group social discussion, to be representative of activities one may encounter in social VR. This is in contrast to activities like throwing a ball that may not be encountered regularly. This activity also makes the findings more ecologically valid.
Apparatus
Participants were provided with Meta Oculus Quest 2 headsets (503g) and two hand controllers (126g) for use at home or another personal environment. The Quest 2 headsets are standalone head mounted displays with 1832 x 1920 resolution per eye, 104.00° horizontal FOV, 98.00° FOV, 90Hz refresh rate, and six degree-of-freedom inside-out head and hand tracking. In the first round of data collection, two participants opted to participate with owned personal headsets (both PC-based Valve Index).

The software in use was the ENGAGE virtual communications platform, versions 1.7 through 2.0.1, produced by ENGAGE PLC. The virtual environments in which the participants met were private (password restricted). In the first round of collection, all participants met in the same “Engineering Workshop” room. In the second round of data collection, participants met in one of 192 uniquely-built environments each week. These environments differed in size of moving area and height. Figure 2 shows screen captures of anonymized virtual students in action.
Participants
There were a total of 232 participants in the study across the two periods of data collection (), (). Participants were university students enrolled in one of two 10-week courses about VR. While all students who were part of the course took part in all the VR activities, only those who consented to participate in the study had their data included in the study. Of the 101 students in Period 1 and 171 in Period 2, 93 and 158 consented to participate in the study, respectively. Additionally, 6 students in Period 1 and 12 students in Period 2 dropped the class after consent was collected and before data collection began.
In Period 1 (Female = 30, Male = 47, Other = 2, declined or did not answer = 7), participants were between 18 and 58 years old (M = 22.3, SD = 5.2; = 68, = 7, = 3, = 1, = 1, = 6 and identified as African American or Black ( = 11), Asian or Asian American ( = 30), Hispanic or Latinx ( = 9), Middle Eastern ( = 1), White ( = 21), more than one race ( = 5), or declined to or did not respond ( = 9). Participants had varying levels of experience with VR, with 41 (51.2%) having never used VR before. Prior to the course, 38 participants were not familiar with anyone in their discussion group, and others reported knowing one ( = 13) or more members ( = 12, = 1, = 2, = 2).
In Period 2 (Female = 59, Male = 79, declined or did not respond = 4), participants were between 18 and 49 years old (M = 20.9, SD = 2.8; = 133, = 4, = 1, = 4 and identified as African American or Black ( = 12), Asian or Asian American ( = 47), Hispanic or Latinx ( = 8), Indigenous/Native American, Alaska Native, First Nations ( = 2), Middle Eastern ( = 1), Native Hawaiian or other Pacific Islander ( = 5), White ( = 41), more than one race ( = 19), a racial group not listed ( = 1), or declined to or did not respond ( = 2). Participants had varying levels of experience with VR, with 50 (36.2%) having never used VR before. Prior to the course, 67 participants were not familiar with anyone in their discussion group, and others reported knowing one ( = 36) or more members ( = 10, = 4, = 5, = 1, = 1).
Procedure
Students opted in to the experiment at the beginning of the course with a consent form approved by the Stanford University institutional review board (IRB) under protocol IRB-61257, and the Stanford University Student Oversight Committee. This IRB process required that researchers and course staff did not know which students opted in as participants in the experiment until after the course finished, and an external third-party arbitrator controlled the consent process, so that there would be no plausible appearance of coercion to participate in the study. This also implied that all students were recorded in this study, and data was filtered out from non-consenting participants after the course finished. Furthermore, participants were not compensated because they performed the same activities regardless of whether their data was used. Upon the start of each session’s recording, the system gave a visual notification that recording was taking place. Before consent was given, one of the authors gave a 30-minute lecture on data tracking privacy, and the pros and cons of consenting in the study, and gave the students the opportunity to ask questions about the study. All experimental protocols were approved by the Stanford University IRB, all participants’ informed consent was obtained, and all methods were carried out in accordance with relevant guidelines and regulations.
Weekly activities varied, but included large-group discussion on current readings, discussion in pairs or triads on course material, and VR building activities. Sessions were led by a researcher, who was part of the teaching team of the course. In all virtual environments, participants were able to walk/teleport freely, create 3D drawings, write on personal whiteboards/stickies, add immersive effects/3D objects, and display media content. There was a library of about one thousand virtual objects available for participants to create, move, organize, and delete in the virtual spaces. The platform accommodated use of 3D audio, which allowed for splitting off into smaller groups without audio overlap. Sessions took place eight times over the course of eight to nine weeks, and the duration was about thirty minutes per session.
Data
The highest level of data organization was the dataset, which was either dataset 1, collected in summer 2021, or dataset 2, collected in fall 2021. The next levels of organization are the week and the section. The week indicates which week of eight the data is collected from. The section was the group and time participants met for discussion, which is orthogonal to week. In dataset 1, there were eight sections, and in dataset 2, there were twenty-four. Each participant took part in only one section per week. On average, there were 6.57 participants per section, with numbers of participants ranging from two to twelve. Usually, a participant attended the same section week to week, but there were some exceptions. A session is one participant’s data for one week. Each session lies entirely within one and only one section. In total, there were 1,683 sessions with an average length of 27.2 minutes (SD = 11.2 min).
During a session, the data was collected at 30Hz and consisted of four tracked points. Three were the traditional head, left hand, and right hand, and the fourth is the ’root’, the relationship between the participant’s physical space and the virtual space. This was used in cases when a participant translated or rotated their position with a UI control (e.g., teleporting by pointing and clicking, tapping the controller joystick left to rotate left by 15 degrees). As we were interested in an attack made by a malicious user and not a compromised system, we computed the avatar’s head and hands positions as visible to another user, which is relative to the virtual spaces’ coordinate system.
The coordinate system of the data itself follows the convention system used by the Unity game engine; namely, a left-handed coordinate system with Y upwards, Z forwards, and X rightwards, and that with intrinsic rotations in the order of yaw (Y), pitch (X), and roll, (Z), where positive values indicate a left-handed rotation relative to the positive direction along the axis.
Feature Engineering
The feature set we used consisted of 840 streams that were subset and summarized in various ways. Some of these streams were defined in terms of body-space coordinates, which is described below.
Body-space Coordinates
The registration of a coordinate system is often not amenable to moving, flexible, and diverse human bodies. Over time, different coordinate systems have been developed for specific purposes, such as the anatomical planes (coronal, sagittal, transverse) for medical terminology. For the purposes of our work specifically and of VR more generally, we propose a coordinate system that synthesizes the global vertical axis with horizontal axes relative to the headset’s forward direction.

In this section and next, we designate a vector specifying the position of object at frame in global coordinates, where for head, for left controller, and for right controller. Each dimension can individually be accessed as , , and . We also define as a matrix specifying the rotation of object at frame . Additionally, we define , , and as functions receiving a rotation and returning a single real number indicating the corresponding Tait-Bryan angles using the Unity game engine rotation conventions. All these expressions implicitly refer to one session.
The construction of the body-space coordinate system is illustrated in Figure 3 and described as follows: while the vertical (Y) direction remains vertical in this coordinate system, one of the horizontal directions (in our convention, Z) is defined to be forward relative to the participant’s body. We operationalize the forward direction as the horizontal direction of the mean of the head’s forward vector over the course of a span of frames centered on a query frame . In our work, the span is . The projection onto the horizontal plane downweights directions facing upward or downward, which we judge is appropriate. The rightward direction is then defined as the cross product of upwards with forwards so that it is orthogonal to both. Mathematically speaking, if is the set of frames over which to calculate a forward vector, then the transformation to the body-space coordinate system is calculated as follows:
The intuition behind the value of body-space coordinates straightforward: often the identifiable features of one’s motion are invariant to rotations within the horizontal plane. For example, when one crosses their arms while facing northwest, then ten minutes later does the same pose but facing south, the relative position to each other will be similar relative to the body-space coordinate system, but not relative to the global coordinate system. In regards to the question at hand, this would mean the body-space coordinate system is likely to be more effective at separating one’s pose from another’s than the global coordinate system would be. To our knowledge, this has not been done in the study of identifiability of VR data, because in previous work there is often a clear ’forward’ direction, and that forward direction can be either enforced or maintained in the course of an experiment [6, 8, 17]. The value of body-space coordinates is further discussion in the subsection on identification features.
Features
In all, there were 42 streams (positions and speeds) each summarized in 20 ways for each sample, leading to a total of 840 features.
The first nine of the 42 streams were kept from our starting model, which was originally used by [6] and re-used in [5]. These were vertical position, roll, and pitch for each of the head and the left and right hand controllers. The subsection on identification features details the value of dropping the other three data streams, specifically, yaw, X position, and Z position. In the notation given above, the first nine streams were
The next nine streams are defined in terms of body-space coordinates. First, each point is calculated as the difference between tracked objects and by in a method similar to [25]. Then, this difference is transformed to body-space coordinates . In this body-space coordinate system, y refers to difference upward, x to difference rightward, and z to difference forward. All three dimensions are used in all three pairs, producing nine streams:
The third set is also nine streams, but they are defined on speed rather than position as before. Specifically, one-frame changes in position are denoted . Three types of speeds are derived, one that indicates total motion , one that indicates horizontal motion , and one that indicates vertical motion . This results in nine streams, specifically:
Finally, on the speed of the body-space difference vectors , one can compute the same total, horizontal, and vertical motions, but it is meaningful to also compute the difference along both the forward and rightward directions. Therefore, there are a total of 15 streams of this type:
The featurization for any given session is a collection of 840-entry vectors computed for a set of frames regularly spaced at one second intervals. The 840 features are computed by selecting each one of the 42 streams and computing each of five different summary statistics (mean, median, maximum, minimum, standard deviation) of each of four varying window sizes (1s, 3s, 10s, 30s) centered on the selected frame. On the edges, where a full window frame was not available, the frame was not used.
Model
The model we have selected is random forest implemented in R [26] with the package ranger [27]. The choice of random forest was to balance simplicity with expressiveness and was used in previous work [6, 5]. Most settings for the creation of the random forest were the defaults, in particular, no limit to node depth, a minimum node size of one, number of variables to try as the square root of total variables. The one custom parameter was training only 30 trees on a sample of 100,000 entries from the entire database, with this resample-and-grow process repeated 20 times.
The predictions were made per session by taking the entire session of motion data, computing features, and then aggregating the votes across all 600 trees across all samples. We interpreted this distribution as a probability estimation for the classification of the session as a whole, in line with previous work [6] and consistent with other uses of random forests [28].
Evaluation
We provide several evaluation metrics for these models. Our primary metric is multiclass AUC [9] which addresses the dependency of accuracy as the number of classes in the classification problem varies. For the sake of interpretability, we include accuracy, and for comparison and synthesis with previous work, we use accuracy limited to a N-class testing set.
Multiclass AUC
To our knowledge, no work in the space of user identification with VR data has used multiclass AUC. Because it addresses the effect of classification size on accuracy, we give a short description and justification of its use in enabling future comparisons across studies with varying numbers of classes.
Identification-focused works [4, 6, 5, 8] almost exclusively use accuracy for the model’s evaluation metric. The benefits of accuracy as a metric include its ease of interpretation and its directness to the question at hand - a less accuracy model is obviously less identifiable, and vice versa. However, accuracy does vary significantly as the number of classes varies, even for the same data distributions and identification processes, as evidenced by multiple works [4, 6, 18]. Intuitively, this is true - it is easier to guess who is walking up the stairs in an apartment with two other people than a house of ten. This effect of the number of classes on accuracy can make synthesis of findings across works difficult, as the classification can vary as much as two orders of magnitude (e.g., 5 in [18] to 511 in [6]).
Our criteria for an evaluation metric that addresses this issue is that it produces the same value regardless if it is computed upon the full set of classes, or computed as the average of randomly chosen subsets of classes of any size. A formal mathematical description of this problem is given in the supplementary material. To solve this problem and enable comparisons across analyses with varying numbers of classes, we choose our primary evaluation metric to be multiclass AUC, defined by Hand and Till [9]. Multiclass AUC can be described as the average of the pairwise separability between classes.
Hand and Till note that this metric weights the separability of each pair of classes equally regardless of the number of samples in the classes, which may not be appropriate if priors are to be taken into account. Additionally, this is not an estimate of the accuracy attained by the same training process upon a smaller data set constructed in the same class-reduction process, but is instead an estimate based upon the model after training.
Accuracy limited to an -class testing set
While multiclass AUC is a good multiclass evaluation metric for future work, there are no works in this space that currently use it. In order to allow comparisons to be drawn from this work to previous work, we define accuracy limited to N-classes. This metric may be narrated as a prediction task in which there is a model and a set of N potential classifications, a subset of all the classifications the model could make. First, the model proposes its classification, and if the classification is outside this subset, the model is asked to provide its next best classification. This process only ends when the model gives a predicted classification within the set of potential classifications. A formal description of this process and metric is given in the supplemental material. This accuracy is then comparable to accuracy of a similar size identification set.
Results
There are several analyses performed. First, we estimate the identifiability of participants in this dataset using both within- and between-session methods. From there, we study the effect of time on identification, first through the duration of the training data, and second through the delay between training and testing.
Identification
The simplest and most prominent question is identification. As previous work has indicated that the delay between training and testing data sets can influence identification [8, 5], we report two separate analyses. The first analysis uses a train/test split at the scale of weeks such that the first six weeks of data are the training set and the final two weeks are the testing set. This is called the between sessions split. The second analysis splits training and testing segments within each session, such that 80% of each session is used for training data, and 20% is used for testing data, except for one minute as a buffer between segments. This is called the within session split. Results are given in Table 1 that show each accuracy metric for the two splits across the dataset 1, dataset 2, or the combined dataset.
| Split | Dataset | Accuracy | Multiclass AUC | 30-Class Accuracy |
|---|---|---|---|---|
| Combined (C=232) | 31.68% | 85.48% | 51.71% | |
| Between | Dataset 1 (C=86) | 45.19% | 86.86% | 55.34% |
| Dataset 2 (C=146) | 32.39% | 86.37% | 50.02% | |
| Combined (C=232) | 67.15% | 98.43% | 85.92% | |
| Within | Dataset 1 (C=86) | 82.30% | 98.60% | 89.29% |
| Dataset 2 (C=146) | 69.36% | 98.28% | 84.46% |
The most dramatic difference for all three evaluation metrics is whether the split is within-session or between-session. This corroborates previous work [5, 8] that the delay between training and testing influences identifiability. Second, in both cases the accuracy for dataset 1 is substantially larger. While multiclass AUC also has slight increases in conditions with dataset 1, it is much less pronounced, both in an absolute scale and in logit units. This result highlights the importance of accounting for classification size. However, it should be noted that identification size is not the only determinant of accuracy. There is a much smaller difference in accuracy between the dataset 2 and the combined data (+60% size difference) than there is between dataset 1 and dataset 2 (+70% size difference).
Identification over time
Motivated by R. Miller et al. [8] and the finding in the subsection above, we investigated the effect of duration and delay on identification. To study duration, we vary the number of separate sessions in the training set and the training time per session to investigate its effect on multiclass AUC for both within and between session splits. To study delay, we vary the weeks upon which a model is trained and tested while keeping the duration the same.
Duration
In the first analysis, the train-test split was performed by first randomly selecting a set of training sessions of size at most 1, 2, 4, or 7 for each participant, presuming at least one session remains for testing. For example, in the case seven sessions were requested but a participant only took part in six, five of those six were used for training and one was held out for between-sessions testing. Of the selected training sessions, spans of time for training and within-sessions testing were chosen. First, a five-minute span was marked out for testing, and one-minute spans adjacent to the testing span were marked off as buffers. Then, if there was enough space remaining on either side of the testing span, the training span was one continuous block. Otherwise, the training span was two separate blocks that totaled the requesting time. In the case there was not enough time in a session, the entire length of time other than testing and buffer was used for training. For example, if there was a 32-minute recording with 30 minutes requested, there would be 25 minutes for training, five minutes for testing, and one minute on each side of the testing data as a buffer. This means the average training span for each of the 1, 3, 10, and 30 minute conditions were durations of 1:00, 2:59, 9:39, and 22:32 respectively. Sessions shorter than eight minutes total were dropped from this analysis.
The reported result is the average multiclass AUC across 10 Monte Carlo resamplings. For the sake of training time, we reduced the number of trees to 5 and the number of sub-samples to 3. With this change in the training process, the reduction in the training set, and the reduction in the test set to five minutes, we expect to account for the differences in multiclass AUC between the 30 minute, 7 session (top right corner, between panel) training and 5 minute testing (i.e, the results in Figure 4) compared to the full duration, 6 session training set with a full session testing set (i.e., the results in table 1). Results are given in Figure 4.
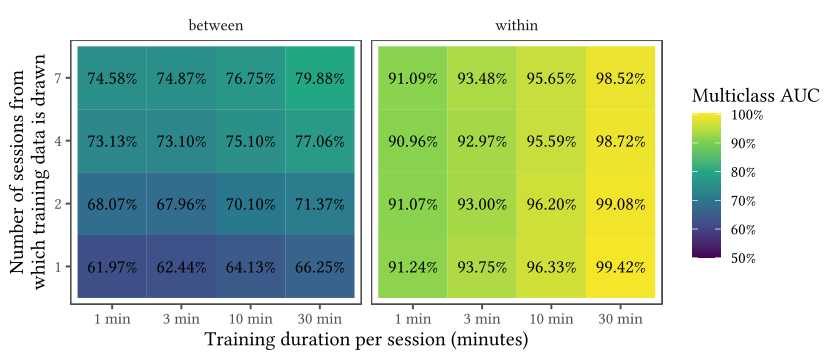
Again, the most dramatic difference in multiclass AUC is in the delay (between vs. within) distinction, even so far that training on simply one minute from the same session as the testing set provides a better multiclass AUC than thirty minutes on all other sessions available to the model. Looking specifically at the between-sessions case, both more sessions and more training data per session produces higher multiclass AUC scores. Of the two, the number of sessions more dramatically affects the multiclass AUC, considering the ranges chosen in this study. In particular, training on one minute from four sessions produces a higher multiclass AUC than training on thirty minutes from only two sessions (, , 95% CI = [0.5%, 2.9%]). In the within-session data, more time is beneficial to multiclass AUC, but more sessions very mildly reduces multiclass AUC. This may be because the variation between sessions does not aid the model but rather misleads it.
Delay
The second analysis keeps the training and testing durations the same but varies the delay between these moments. The multiclass AUCs reported in Figure 5 are produced by training a random forest upon one week’s worth of data and testing it on a different week’s worth of data. In total, there are entries. The random forests had 30 trees like in the original analysis but only had 3 separate 100,000-sample draws due to the smaller sample set (one week, about 350,000 samples). All data for the selected training session is used, and all testing data matching a participant in the training set is tested with. Note that multiclass AUC is reported both for pairs where training week happens before testing week, as would be expected for an attacker, but also in pairs where testing week happens before training week, which is relevant to motion re-identification well after data collection.
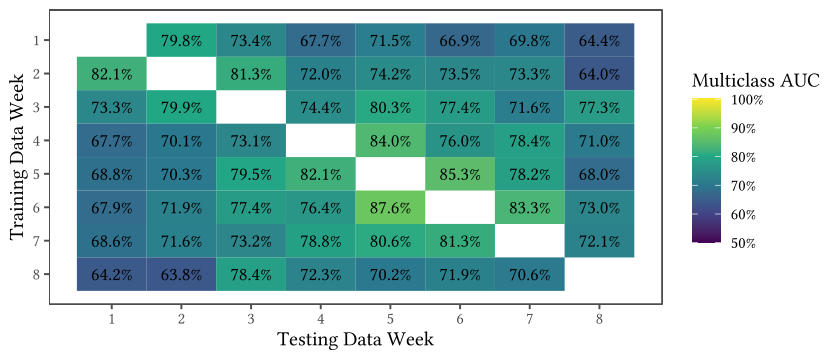
The results in Figure 5 show a pattern that multiclass AUC is higher when training and testing sessions have less delay (i.e, at the near-diagonals) than when there is more delay (near bottom left and top right). This effect varies somewhat across weeks, but is still easily visible. A mixed-effect model predicting multiclass AUC based on delay with random intercepts from training and testing weeks is highly significant ().
Identification features
The features in this model were developed relative to [6] but have significant changes. In order to shed light on the relative value of these change, we provide a series of intermediate models and the relative changes in accuracy for each model, allowing the reader to differentiate the contributions of each change to the feature set. These are given in table 2.
| Model | Features | Accuracy (C=232) | Multiclass AUC | C=30 Accuracy |
|---|---|---|---|---|
| M1 | Miller et al. [6] | 7.76% | 75.18% | 21.20% |
| M2 | M1 without horizontal positions | 25.29% | 81.91% | 43.10% |
| M3 | M2 without yaw | 27.87% | 82.73% | 47.51% |
| M4 | M3 with windows of 3s, 10s, 30s | 31.61% | 82.71% | 49.22% |
| M5 | M4 with body-space displacements | 32.76% | 84.43% | 51.54% |
| M6 | M5 with speed values | 32.47% | 85.59% | 52.59% |
Model M1 used the same feature set as used in [6]. Note that this is the lowest accuracy of all six models here. Models M2 and M3 use a subset of features available to M1, specifically, dropping the two horizontal positions and then dropping horizontal orientation. These changes improve each evaluation metric substantially. Note that the samples within the same session are not independent, and in fact the samples highly correlated upon these features in particular. Domain knowledge in leading these discussions and activities indicates that the horizontal locations of a participant from session to session varies almost arbitrarily. Disallowing these values allows other features to be considered more strongly.
Model M4 quadruples the feature space by adding three new window sizes. As the original work [6] used only thirty-second clips, while our work has on average about thirty minutes, we can increase our window size without suffering the same loss in sample size. The difference between M3 and M4 is puzzling, as accuracy goes up substantially but multiclass AUC goes slightly down. We hypothesize this is due to the larger feature space adding variance to predictions across the board, but the larger time window providing an important distinguishing factor when there are differences between just a handful of plausible values.
M5 and M6 apply features from previous work. M5 adds features computed from the body-coordinate displacement vectors described in the subsection on body-space coordinates, building on [25]. This reintroduces the horizontal information lost in M2 and M3, but this featurization is invariant to horizontal translations and rotations of the participant. M6 adds velocity features for each stream, inspired by [5] that shows velocity is still identifiable, though less so than position.
In summary, the use of body-space coordinates increases identification both by removing poorly parameterized data and by reintroducing a better parameterization. Additionally, we corroborate the value of other featurizations on the current dataset.
Discussion
This work continues to survey the risks that VR poses to privacy. The most important question in this space is how identifying various data sources, situations, and activities are, what makes these identifying, and what can be done about it. By understanding what influences the accuracy of de-anonymization techniques, researchers can develop more effective and more efficient ways to limit risk to end users.
First, we show, in accord with other work [8, 5], that the largest difference in identifiability is whether the enrollment (training) and input (testing) sessions are delayed or adjacent. This work has demonstrated this fact on the largest dataset to date in terms of total recorded time. This finding is echoed in the timing analysis, in which one minute from the same session is more identifying than seven sessions of thirty minutes each. Overall, we infer that there are several identifying variables at play, and some may work on short time scales and some work on long time scales. Future work ought not to look at one time scale but many.
Second, in response to previous work with varying identification sizes, we select and justify the Multiclass AUC evaluation metric to evaluate identifiability across sample sizes. A review of previous work indicated a trend that simple accuracy-based measures of identifiability show lower accuracy with larger sets of users to identify from. Removing this variation can let future work clarify other important trends in accuracy, such as time, feature selection, or activity.
Third, we investigate identifiability as participants have discussions in VR. This activity is a very common activity that occurs in social VR even without prompting, and it is far more available to attackers because of its ubiquity. This obviates the need to have targets perform an action based on trust of the authentication method (e.g., [14, 16] or co-present social engineering in the VR environment (e.g., [20]).
Finally, to better understand the risk of motion data, we develop body-space coordinates to allow for the usage of horizontal motion data. Both removing the reference to global coordinates and introducing the reference to body-space coordinates increase identifiability. This work takes a step forward in the arms race between identification and de-identification.
Because of this work, we recommend software developers responsible for this motion data to take several steps. First, developers ought to protect this data with standard practices for personally identifying data. When this data needs to be shared with others, it can be helpful to reduce the time span available, minimize variation in activities, or modify data to produce plausible deniability [19]. Furthermore, there are developments in law that need to be made to clarify the legal status of this data based on its risks to privacy [29].
Some limitations of this work include that while participants knew their motion data was collected, they were not aware what features of their data would be most identifying so that they could change their behavior to avoid being tracked, e.g. vary their height week-to-week to fool the model. All participants used the same headset for the entire duration of the study, which according to previous work [30, 31] can make identification easier. On the other hand, almost all participants used a Meta Oculus Quest 2 headset, so idiosyncrasies across headsets (e.g., tracking errors that appear differently in the Meta Oculus Quest 2 headset vs. HTC Vive headset) could not be leveraged as partially identifying. Finally, the activity performed (discussion) and the context (a college course) was selected due to the authors’ personal experiences with activities in social VR, but a more formal study of social VR may indicate other activities that commonly take place that an attacker may leverage.
The sampling process used to minimize discontinuities (see the subsection on duration) does introduce a bias in the sampling such that the middle of the recorded time is more likely to be part of the testing set than the training set.
Regarding attack models, some avenues for future work include demonstrating effective attacks beyond biometrics. For example, depending on what is transmitted, almost all of a target’s visual and auditory experience can be recorded or inferred by a VR lurker. This includes inferences about the target’s attention to objects, content, or people in the virtual world coming from both conscious and unconscious mechanisms. These features will likely involve models different from position-based random forest, such as neural networks [31]. On the defensive side, there is still important work to be done on methods of obfuscating motion data to minimize identifiability. Additionally, it may be plausible, given a user’s preferences, to disconnect real-world biometrics like height and arm length from a user’s virtual avatar entirely, or use transformed social interaction [32] so that gestures that might otherwise be identifiable can come from another person but still be communicative.
Ultimately we aim to see the users, designers, and developers of social VR to understand and account for the risks of this medium so that people can safely and consciously use this new and powerful medium.
References
- [1] Yaremych, H. E. & Persky, S. Tracing physical behavior in virtual reality: A narrative review of applications to social psychology. Journal of Experimental Social Psychology 85, 103845, DOI: 10.1016/j.jesp.2019.103845 (2019).
- [2] Sweeney, L. Simple demographics often identify people uniquely (2000).
- [3] Eckersley, P. How unique is your web browser? Lecture Notes in Computer Science (including subseries Lecture Notes in Artificial Intelligence and Lecture Notes in Bioinformatics) 6205 LNCS, 1–18, DOI: 10.1007/978-3-642-14527-8_1 (2010).
- [4] Pfeuffer, K. et al. Behavioural Biometrics in VR: Identifying People from Body Motion and Relations in Virtual Reality. In Proceedings of the 2019 CHI Conference on Human Factors in Computing Systems, CHI ’19, 110:1—-110:12, DOI: 10.1145/3290605.3300340 (ACM, New York, NY, USA, 2019).
- [5] Moore, A. G., McMahan, R. P., Dong, H. & Ruozzi, N. Personal identifiability and obfuscation of user tracking data from VR training sessions. Proceedings - 2021 IEEE International Symposium on Mixed and Augmented Reality, ISMAR 2021 221–228, DOI: 10.1109/ISMAR52148.2021.00037 (2021).
- [6] Miller, M. R., Herrera, F., Jun, H., Landay, J. A. & Bailenson, J. N. Personal identifiability of user tracking data during observation of 360-degree VR video. Scientific Reports 10, 17404–17413, DOI: 10.1038/s41598-020-74486-y (2020).
- [7] Nair, V., Garrido, G. M. & Song, D. Exploring the Unprecedented Privacy Risks of the Metaverse. ArXiv (2022). 2207.13176.
- [8] Miller, R., Banerjee, N. K. & Banerjee, S. Temporal Effects in Motion Behavior for Virtual Reality (VR) Biometrics. Proceedings - 2022 IEEE Conference on Virtual Reality and 3D User Interfaces, VR 2022 563–572, DOI: 10.1109/VR51125.2022.00076 (2022).
- [9] Hand, D. J. & Till, R. J. A Simple Generalisation of the Area Under the ROC Curve for Multiple Class Classification Problems. Machine Learning 45, 171–186, DOI: 10.1023/A:1010920819831 (2001).
- [10] Slater, M. et al. The Ethics of Realism in Virtual and Augmented Reality. Frontiers in Virtual Reality 1, 1–13, DOI: 10.3389/frvir.2020.00001 (2020).
- [11] Bailenson, J. Protecting Nonverbal Data Tracked in Virtual Reality. JAMA Pediatrics 172, 905–906 (2018).
- [12] Hosfelt, D. Making ethical decisions for the immersive web (2019). 1905.06995.
- [13] Roesner, F., Kohno, T. O. & Molnar, D. Security and privacy for augmented reality systems. Communications of the ACM 57, 88–96, DOI: 10.1145/2580723.2580730 (2014).
- [14] Kupin, A., Moeller, B., Jiang, Y., Banerjee, N. K. & Banerjee, S. Task-Driven Biometric Authentication of Users in Virtual Reality (VR) Environments. In Internation Conference on Multimedia Modeling2, 55–67 (2019).
- [15] Shen, Y. et al. GaitLock: Protect Virtual and Augmented Reality Headsets Using Gait. IEEE Transactions on Dependable and Secure Computing 5971, 1–14, DOI: 10.1109/TDSC.2018.2800048 (2018).
- [16] Li, S. et al. Whose move is it anyway? Authenticating smart wearable devices using unique head movement patterns. 2016 IEEE International Conference on Pervasive Computing and Communications, PerCom 2016 1–9, DOI: 10.1109/PERCOM.2016.7456514 (2016).
- [17] Olade, I., Fleming, C. & Liang, H. N. Biomove: Biometric user identification from human kinesiological movements for virtual reality systems. Sensors (Switzerland) 20, 1–19, DOI: 10.3390/s20102944 (2020).
- [18] Wang, X. & Zhang, Y. Nod to Auth: Fluent AR/VR Authentication with User Head-Neck Modeling. Conference on Human Factors in Computing Systems - Proceedings DOI: 10.1145/3411763.3451769 (2021).
- [19] Nair, V., Garrido, G. M. & Song, D. Going Incognito in the Metaverse. ArXiv (2022). 2208.05604.
- [20] Falk, B., Meng, Y., Zhan, Y. & Zhu, H. POSTER: ReAvatar: Virtual Reality De-anonymization Attack through Correlating Movement Signatures. Proceedings of the ACM Conference on Computer and Communications Security 2405–2407, DOI: 10.1145/3460120.3485345 (2021).
- [21] Sabra, M., Sureshkanth, N. V., Sharma, A., Maiti, A. & Jadliwala, M. Exploiting out-of-band motion sensor data to de-anonymize virtual reality users. 2301.09041[cs].
- [22] Ajit, A., Banerjee, N. K. & Banerjee, S. Combining pairwise feature matches from device trajectories for biometric authentication in virtual reality environments. Proceedings - 2019 IEEE International Conference on Artificial Intelligence and Virtual Reality, AIVR 2019 9–16, DOI: 10.1109/AIVR46125.2019.00012 (2019).
- [23] Liebers, J. et al. Understanding user identification in virtual reality through behavioral biometrics and the efect of body normalization. Conference on Human Factors in Computing Systems - Proceedings DOI: 10.1145/3411764.3445528 (2021). ISBN: 9781450380966.
- [24] Han, E., Miller, M. R., Ram, N., Nowak, K. L. & Bailenson, J. N. Understanding group behavior in virtual reality: A large-scale, longitudinal study in the metaverse.
- [25] Miller, R., Banerjee, N. K. & Banerjee, S. Combining Real-World Constraints on User Behavior with Deep Neural Networks for Virtual Reality (VR) Biometrics. Proceedings - 2022 IEEE Conference on Virtual Reality and 3D User Interfaces, VR 2022 409–418, DOI: 10.1109/VR51125.2022.00060 (2022).
- [26] R Core Team. R: A Language and Environment for Statistical Computing. R Foundation for Statistical Computing, Vienna, Austria (2021).
- [27] Wright, M. N. & Ziegler, A. ranger: A fast implementation of random forests for high dimensional data in C++ and R. Journal of Statistical Software 77, 1–17, DOI: 10.18637/jss.v077.i01 (2017).
- [28] Niculescu-Mizil, A. & Caruana, R. Predicting good probabilities with supervised learning. In Proceedings of the 22nd international conference on Machine learning - ICML ’05, 625–632, DOI: 10.1145/1102351.1102430 (ACM Press, 2005).
- [29] Heller, B. Watching androids dream of electric sheep: Immersive technology, biometric psychography, and the law. Vanderbilt Journal of Entertainment and Technology Law 23 (2020).
- [30] Miller, R., Banerjee, N. K. & Banerjee, S. Within-System and Cross-System Behavior-Based Biometric Authentication in Virtual Reality. Proceedings - 2020 IEEE Conference on Virtual Reality and 3D User Interfaces, VRW 2020 311–316, DOI: 10.1109/VRW50115.2020.00070 (2020).
- [31] Miller, R., Banerjee, N. K. & Banerjee, S. Using siamese neural networks to perform cross-system behavioral authentication in virtual reality. Proceedings - 2021 IEEE Conference on Virtual Reality and 3D User Interfaces, VR 2021 140–149, DOI: 10.1109/VR50410.2021.00035 (2021).
- [32] Bailenson, J. N., Beall, A. C., Loomis, J., Blascovich, J. & Turk, M. Transformed social interaction: Decoupling representation from behavior and form in collaborative virtual environments. Presence: Teleoperators and Virtual Environments 13, 428–441, DOI: 10.1162/1054746041944803 (2004).
Acknowledgements
The authors wish to thank Daniel Scott Akselrad, Tobin Asher, Brian Beams, Ryan Moore, Patricia Jeanne Yablonski, and Mark York for their support with the course. This research was supported by the National Science Foundation grant (Award 1800922).
Author contributions statement
M.R.M. and J.N.B. conceived of the experiments. J.N.B. secured funding. M.R.M., E.H., and C.D. collected data. M.R.M., E.J., and R.C., developed software to analyze the data. M.R.M. drafted the manuscript. E.H., C.D., J.N.B, and E.J contributed to the manuscript. All authors reviewed the manuscript.
Data availability
The datasets analysed during the current study are available from the corresponding author on reasonable request.
Additional information
The author(s) declare no competing interests.
Supplemental Material
Multiclass AUC
To our knowledge, no work in the space of user identification with VR data has used multiclass AUC. Because it addresses the effect of classification size on accuracy, we give a short description and justification of its use in enabling future comparisons across studies with varying numbers of classes.
Identification-focused works [4, 6, 5, 8] almost exclusively use accuracy for the model’s evaluation metric. The benefits of accuracy as a metric include its ease of interpretation and its directness to the question at hand - a less accuracy model is obviously less identifiable, and vice versa. However, accuracy does vary significantly as the number of classes varies, even for the same data distributions and identification processes, as evidenced by multiple works [4, 6, 18]. Intuitively, this is true - it is easier to guess who is walking up the stairs in an apartment with two other people than a house of ten. This effect of the number of classes on accuracy can make synthesis of findings across works difficult, as the classification can vary as much as two orders of magnitude (e.g., 5 in [18] to 511 in [6]).
Our criteria for an evaluation metric that addresses this issue is that it produces the same value regardless if it is computed upon the full set of classes, or computed as the average of randomly chosen subsets of classes of any size. More formally, let represent a classification problem whose elements are sets containing individual members of the class . We define an ideal evaluation metric such that the evaluation computed from the prediction function and the classification problem is equal to the expected value of the evaluation for a randomly chosen combination of classes of a given size , uniformly randomly selected from the classes in . Numerically, this is:
To solve this problem and enable comparisons across analyses with varying numbers of classes, we choose our primary evaluation metric to be multiclass AUC, defined by Hand and Till [9].
Multiclass AUC can be described as the average of the pairwise separability between classes. In the original work, Hand and Till extend area-under-the-curve (AUC), the well-known measure of separability, to the multiclass case. AUC can be expressed as the probability that a randomly selected member of class will be larger than a randomly selected member of class according to the value of the binary prediction function meant to separate the two. This can be easily computed in closed form as
where is the indicator function. Multiclass AUC extends this definition provided a multiclass prediction function that specifies values for each combination of member and class . From this, Hand and Till [9] define the multiclass AUC for a given prediction function and set of classes to be the average of separabilities of one class from another for all pairs of classes in the model:
As a sketch for the proof that metric fills the criteria above, consider that this metric produces a separability value for each ordered pair of classes independent of the other classes present. Due to the symmetry of classes in being selected within the final set, each class and class pair is weighted similarly in the averaging process. By linearity, the average of the final values for a given class size can be understood as the average of all pairwise values, which produces the same value as evaluating the full set of classes.
Hand and Till note that this metric weights the separability of each pair of classes equally regardless of the number of samples in the classes, which may not be appropriate if priors are to be taken into account. Additionally, this is not an estimate of the accuracy attained by the same training process upon a smaller data set constructed in the same class-reduction process, but is instead an estimate based upon the model after training.
Accuracy limited to an -class testing set
While multiclass AUC is a good multiclass evaluation metric for future work, there are no works in this space that currently use it. In order to allow comparisons to be drawn from this work to previous work, we define accuracy limited to N-classes. This metric may be narrated as a prediction task in which there is a model and a set of N potential classifications, a subset of all the classifications the model could make. First, the model proposes its classification, and if the classification is outside this subset, the model is asked to provide its next best classification. This process only ends when the model gives a predicted classification within the set of potential classifications.
To derive this formula, consider the probability for a randomly selected subclassification , , that sample known to be from class is predicted correctly. Explained simply, for a sample to be correctly classified, the random selection of classes within this set of potential classifications must avoid all classes that would trip up the prediction for a given sample whose true class is . The number of these ’error classes’ is . The general expression for a sample to be correctly classified in an -class testing set is a simple combinatorics expression:
Then, by linearity of expectation, the accuracy for the whole model across all selections of is equal to the mean of each sample’s accuracy, and so the end result is simply the mean of the expression above across all sessions.