∎
Enhanced light signal for the suppression of pile-up events in Mo-based bolometers for the 0 decay search.
Abstract
Random coincidences of events could be one of the main sources of background in the search for neutrino-less double-beta decay of 100Mo with macro-bolometers, due to their modest time resolution. Scintillating bolometers as those based on Li2MoO4 crystals and employed in the CROSS and CUPID experiments can eventually exploit the coincident fast signal detected in a light detector to reduce this background. However, the scintillation provides a modest signal-to-noise ratio, making difficult a pile-up pulse-shape recognition and rejection at timescales shorter than a few ms. Neganov-Trofimov-Luke assisted light detectors (NTL-LDs) offer the possibility to effectively increase the signal-to-noise ratio, preserving a fast time-response, and enhance the capability of pile-up rejection via pulse shape analysis. In this article we present: a) an experimental work performed with a Li2MoO4 scintillating bolometer, studied in the framework of the CROSS experiment, and utilizing a NTL-LD; b) a simulation method to reproduce, synthetically, randomly coincident two-neutrino double-beta decay events; c) a new analysis method based on a pulse-shape discrimination algorithm capable of providing high pile-up rejection efficiencies. We finally show how the NTL-LDs offer a balanced solution between performance and complexity to reach background index counts/keV/kg/year with 280 g Li2MoO4 (100Mo enriched) bolometers at 3034 keV, the Qββ of the double-beta decay, and target the goal of a next generation experiment like CUPID.
Keywords:
Double beta decay 100Mo Scintillating bolometer Photodetector Low-temperature detector Rare-event searchNeutrino1 Introduction
The observation of the neutrino-less double-beta () decay would imply the violation of lepton number conservation and establish the Majorana nature of neutrino Majo:1937; Raca:1937; Pont:1968; Sche:1980. Cryogenic bolometers are very competitive detectors to search for this extremely rare process ( 1024– yr Arnold:2015; Gando:2016; Alvis:2019; Anton:2019; Azzolini:2019; Adams:2020; Armengaud:2021; Augier:2022; Agostini:2020) in a few theoretically and experimentally favorable nuclei. The lithium molybdate compound (Li2MoO4) has been experimentally demonstrated as one of the most promising materials to this end Bekker:2016; Armengaud:2017; Armengaud:2020a; Armengaud:2021; Augier:2022; Poda:2021, thanks to the recent progress in the techniques to synthesize large, high-quality 100Mo-enriched radio-pure scintillating single crystals Chernyak:2017; Augier:2022; Armatol:2021a; Armengaud:2017; Grigo:2017, and providing excellent bolometric performances overall Armengaud:2020a.
Both CROSS Bandac:2020 and CUPID CUPID:2019 experiments develop a technology based on Li2MoO4 macro-bolometers coupled to bolometric light detectors and use neutron-transmutation-doped Ge thermistors (NTD) haller:1994 as sensors. These sensors can be produced in large numbers and they can be read out via simple, conventional, low-noise JFET-based electronics Pessina:electronics. Their major drawback is an intrinsic slow (1–10 ms) response time, essentially due to 1) their high impedance at the optimal working point, 2) the gluing interface with the crystal, and 3) the internal electron-phonon decoupling. Slow response time can lead to pile-up events mimicking single, normal events at the Q-value of the double-beta decay Chernyak:2014; Chernyak:2017. The identification of these events is extremely important when searching for decay of 100Mo: in fact, having the 100Mo a relatively ”short” two-neutrino double-beta () half-life ( years Armengaud:2020b), this latter can bring a large background of pile-up events in the ROI.
Other experiments as AMoRE Alenkov:2015, also looking for 100Mo neutrinoless double-beta decay, adopted metallic-magnetic-calorimeter (MMC) as temperature sensors Kempf:2018. The major advantage of this sensor technology is to provide signals with faster response times than that of the NTDs, reducing the pile-up background in the ROI.
The counting rate of randomly coincident decay events in a 280 g Li2100MoO4 CUPID detector is estimated on the level of counts/keV/kg/year (ckky) at 3034 keV, assuming a time-resolving capability of 1 ms Chernyak:2017: randomly-coincident decay events represent at the moment the main source of background for the next-generation, large-scale, high-radio-pure experiments based on the CUPID technologies CUPID:2019; Armatol:confproc.
Pile-up rejections using pulse-shape analysis of the heat channel have been presented Armatol:2021b: rejection performances of 90% for pile-up times down to 2 ms were reported. However, these values are not sufficient to reach the ultimate CUPID goal.
The approach followed here is the same as that reported in Ref. Chernyak:2017, consisting of exploiting the light signal to improve pile-up rejection through pulse-shape discrimination. In fact, as reminded above, both CROSS and CUPID will be provided with optical bolometers to detect the scintillation light in coincidence with the heat signal measured in the Li2100MoO4 crystal. These light detectors consist of thin Ge wafers equipped with NTD’s as the Li2100MoO4 crystal. The collected light is detected as a temperature pulse in the wafer. The primary function of the double heat-light readout is the rejection of the alpha background by exploiting the lower scintillation yield of alphas with respect to betas/gammas for the same deposited energy. Besides this, the light detector can play a crucial role also to mitigate the pile-up background, since its signal rise-time is about ten time shorter than that of the heat signal. In order for this method to be effective, the signal-to-noise ratio needs to be enhanced, which can be obtained through the so-called Neganov-Trofimov-Luke (NTL) effect Neganov; Luke.
With respect to past work, which was mainly conceptual, our results here are supported by extensive experimental results and more sophisticated simulations, providing a convincing and operational method to reject the background related to decay events down to the desired level.
In this study we report about an experimental and simulation work which provides a technological solution combined with simulations and analysis methods to demonstrate how to reach a background index (BI) lower than 10-4 ckky in the region of interest (ROI) of 100Mo decay.
It consists of three main sections:
- -
an experiment performed with a 245 g Li2MoO4 scintillating bolometer equipped with a NTL effect boosted light detector (NTL-LD) as such in Novati:2019. The bolometer was realized in the framework of the CLYMENE project and the experiment run at the C2U (CROSS Cryogenic Underground) facility at Canfranc Underground Laboratory (Spain) as part of the CROSS/CLYMENE joint R&D program (Section 2);
- -
a new analysis method based on an optimal-filtering pulse-shape discrimination algorithm, capable to provide enhanced pile-up rejection efficiencies (Section 3);
- -
a simulation method to reconstruct synthetically produced random coincidences of decays: it is fully based on signals and noise obtained from detector measurements (Section 4).
2 The experiment
2.1 Setup description

Figure 1 shows a picture of the scintillating macro-bolometer mounting used in this work. The experiment was performed in a low radioactivity pulse tube dilution refrigerator (Hexadry-400, from Cryoconcept) at around 15 mK. The main bolometer consists of a 245 g Li2MoO4 cylindrical single crystal; it is fit in a silver-coated reflective cavity and equipped with two NTD-Ge sensors (331 mm3 and 1031 mm3) and one 300 k Si:P heater andreotti:2012. This detector was developed within the CLYMENE project Velazquez:2017; stelian:2020 (ANR funded) and studied in synergy with the CROSS ERC granted project Bandac:2020.
A Neganov-Trofimov-Luke-effect boosted germanium light detector, identical to the one described in Novati:2019, is coupled to the cavity and records the scintillation emitted in coincidence with the particle events occurring in the main bolometer, allowing to reject the background. This detector is fabricated with a 170 m thick, 44 mm high purity Ge wafer on top of which annular aluminum electrodes of 200 m width and 3.8 mm pitch are evaporated. The electrodes are interconnected to produce two different electrode sets, and kept at a voltage difference . The NTL-LD was operated with several up to a maximum of 50 V: for this value it returned an enhanced sensitivity about 10 times larger than at 0 V and no additional contribution in the Noise Power Spectrum (NPS).
An optical fiber is coupled with a room temperatures 880 nm wavelength LED and used to shine the NTL-LD in the cavity. The LED was driven via Keysight 33500B wave-function generator sending typically square voltage pulses of about 400 ns time-width and a voltage amplitude around 1 V.
2.2 Measurements
We artificially produced pile-up events in the light detector via LED photo-pulses sent through the optical fiber. The voltage amplitudes, A1 and A2, of the wave-function generator were tuned, together with the pulse duration (typically a few s, much shorter than the rise-time of the light detector of the order of 1 ms), to provide single pulses of energy = 450 eV. Hence, a perfect synchronous two LED pulses (t0 ms) delivers 900 eV, the amount of scintillating energy recovered on a single light detector for an event at the 100Mo Qββ (3 MeV), for a light yield of 0.3 keV/MeV as in CROSS or CUPID setup Armatol:2021a; Alfonso:2022. For simplicity, we worked with A1A2 as the simulation presented hereafter shows that this pulse amplitude combination gives the main pile-up contributions, and sending two subsequent pulses spaced by given t time interval. We adopted the following t time pattern: 0.1; 0.3; 0.5; 0.7; 1.0; 3.0; 5.0; 0.05 ms. We delivered 100 (pile-up) signals for each t, at a repetition rate of 0.2 Hz. We have performed several set of measurements, by varying the NTL-LD electrode voltage bias Ve (10, 30 and 50 V). As a precaution, between each set of voltage we used the LED to charge-reset the NTL-LD, and clean the residual, spurious electric field built-up in the semiconductor due to charge trapping as described in Olivieri:200933 3 However a similar NTL light detector was operated in the same set-up during one month for background acquisition without need of any charge-reset procedure..
We measured an average performance on the light channel of eV ( eV) baseline noise when operated at Ve = 0 V (50 V) and sensitivity of 1 V/keV (10 V/keV). We explored different NTL-LD detector working points by scanning with respect to different sensor bias currents (Table 1). We finally chose to work at a bias of 1 nA, which provides a signal rise-time of 1.2 ms.
| [nA] | [M] | Responsivity [A.U.] | (10–90 %) [ms] |
|---|---|---|---|
| 0.28 | 10 | 1 | 2 |
| 1 | 2.3 | 0.363 | 1.2 |
| 2.9 | 0.7 | 0.182 | 0.8 |
The NTL-LD signals were filtered with an analog low-pass Bessel filter: the cut-off frequency was set at 500 Hz Arnaboldi:2002; Carniti:2020; Carniti:2022, above the intrinsic detector cut-off frequency . All the measurements where 24 bit sampled at a frequency of 5 kHz and continuously recorded (streaming) during the course of the experiment. The streaming files were analyzed offline via an analysis software using Gatti-Manfredi matched optimum filter Gatti:1986: it returns the energy estimate and pile-up rejection parameters, as defined hereafter in Section 3.
3 Data analysis: method and results
To optimally reconstruct the energy of an event over the noise by exploiting the maximum of a signal pulse we employed the optimal filtering algorithm reported in Gatti:1986. Few elements are required: 1) the typical average baseline power spectrum of the measurements, obtained by using data streams where no pulses are present (more than 200 baseline windows); 2) a mean pulse , obtained by averaging 100 pulses with the lowest used t of 50 s. This value being much shorter than the rise-time we can consider these events as singles (Figure 2).

We then built a transfer function accordingly and filtered each pulse in the frequency domain; the maximum of the filtered pulse (t) in the time domain is then, by construction, the pulse amplitude (energy) estimator which provides the best signal-to-noise ratio (S/N).
In order to evaluate the difference in shape of each pulse (pile-up) with respect to the average pulse (single), every filtered signal is compared in the time-domain with the filtered average pulse (t) by fitting with (t)(t+t); the is minimized with respect to the and t. The minimization returns a second pulse amplitude estimator .
For each signal we can determine a pulse shape parameter discriminator as PSD = : it will have value of 1 for pulses identical to that of the average pulse, lower if the shape is different as for pile-up events, and measures how much a signal differs from the reference pulse.
Particular attention was devoted to compare the pulse shape of particle-induced scintillation events with LED-generated ones; to this end we analyzed 232Th-source calibration run (48 hours) and selected the 208Tl (2615 keV s) scintillation events. We observed very minor differences in the shape, whose effect is negligible with respect to the scope of this work.
To better distinguish signals differing in the rise-time part it is convenient to consider the derivative of the signal instead of the signal itself. In the following we will define as PSDsig the shape parameter based on the signal itself, and PSDder on the derivative of the signal. Figure 2 shows the average signal and its derivative, whose maximum corresponds to the maximum slope of the signal in its rising part. With simple, geometrical consideration we can determine that a single event has a derivative maximum larger than that of a pile-up event at the same energy. Figure 3 shows an example of two pile-up signals separated by 0.7 ms and 3 ms, together with their derivatives.

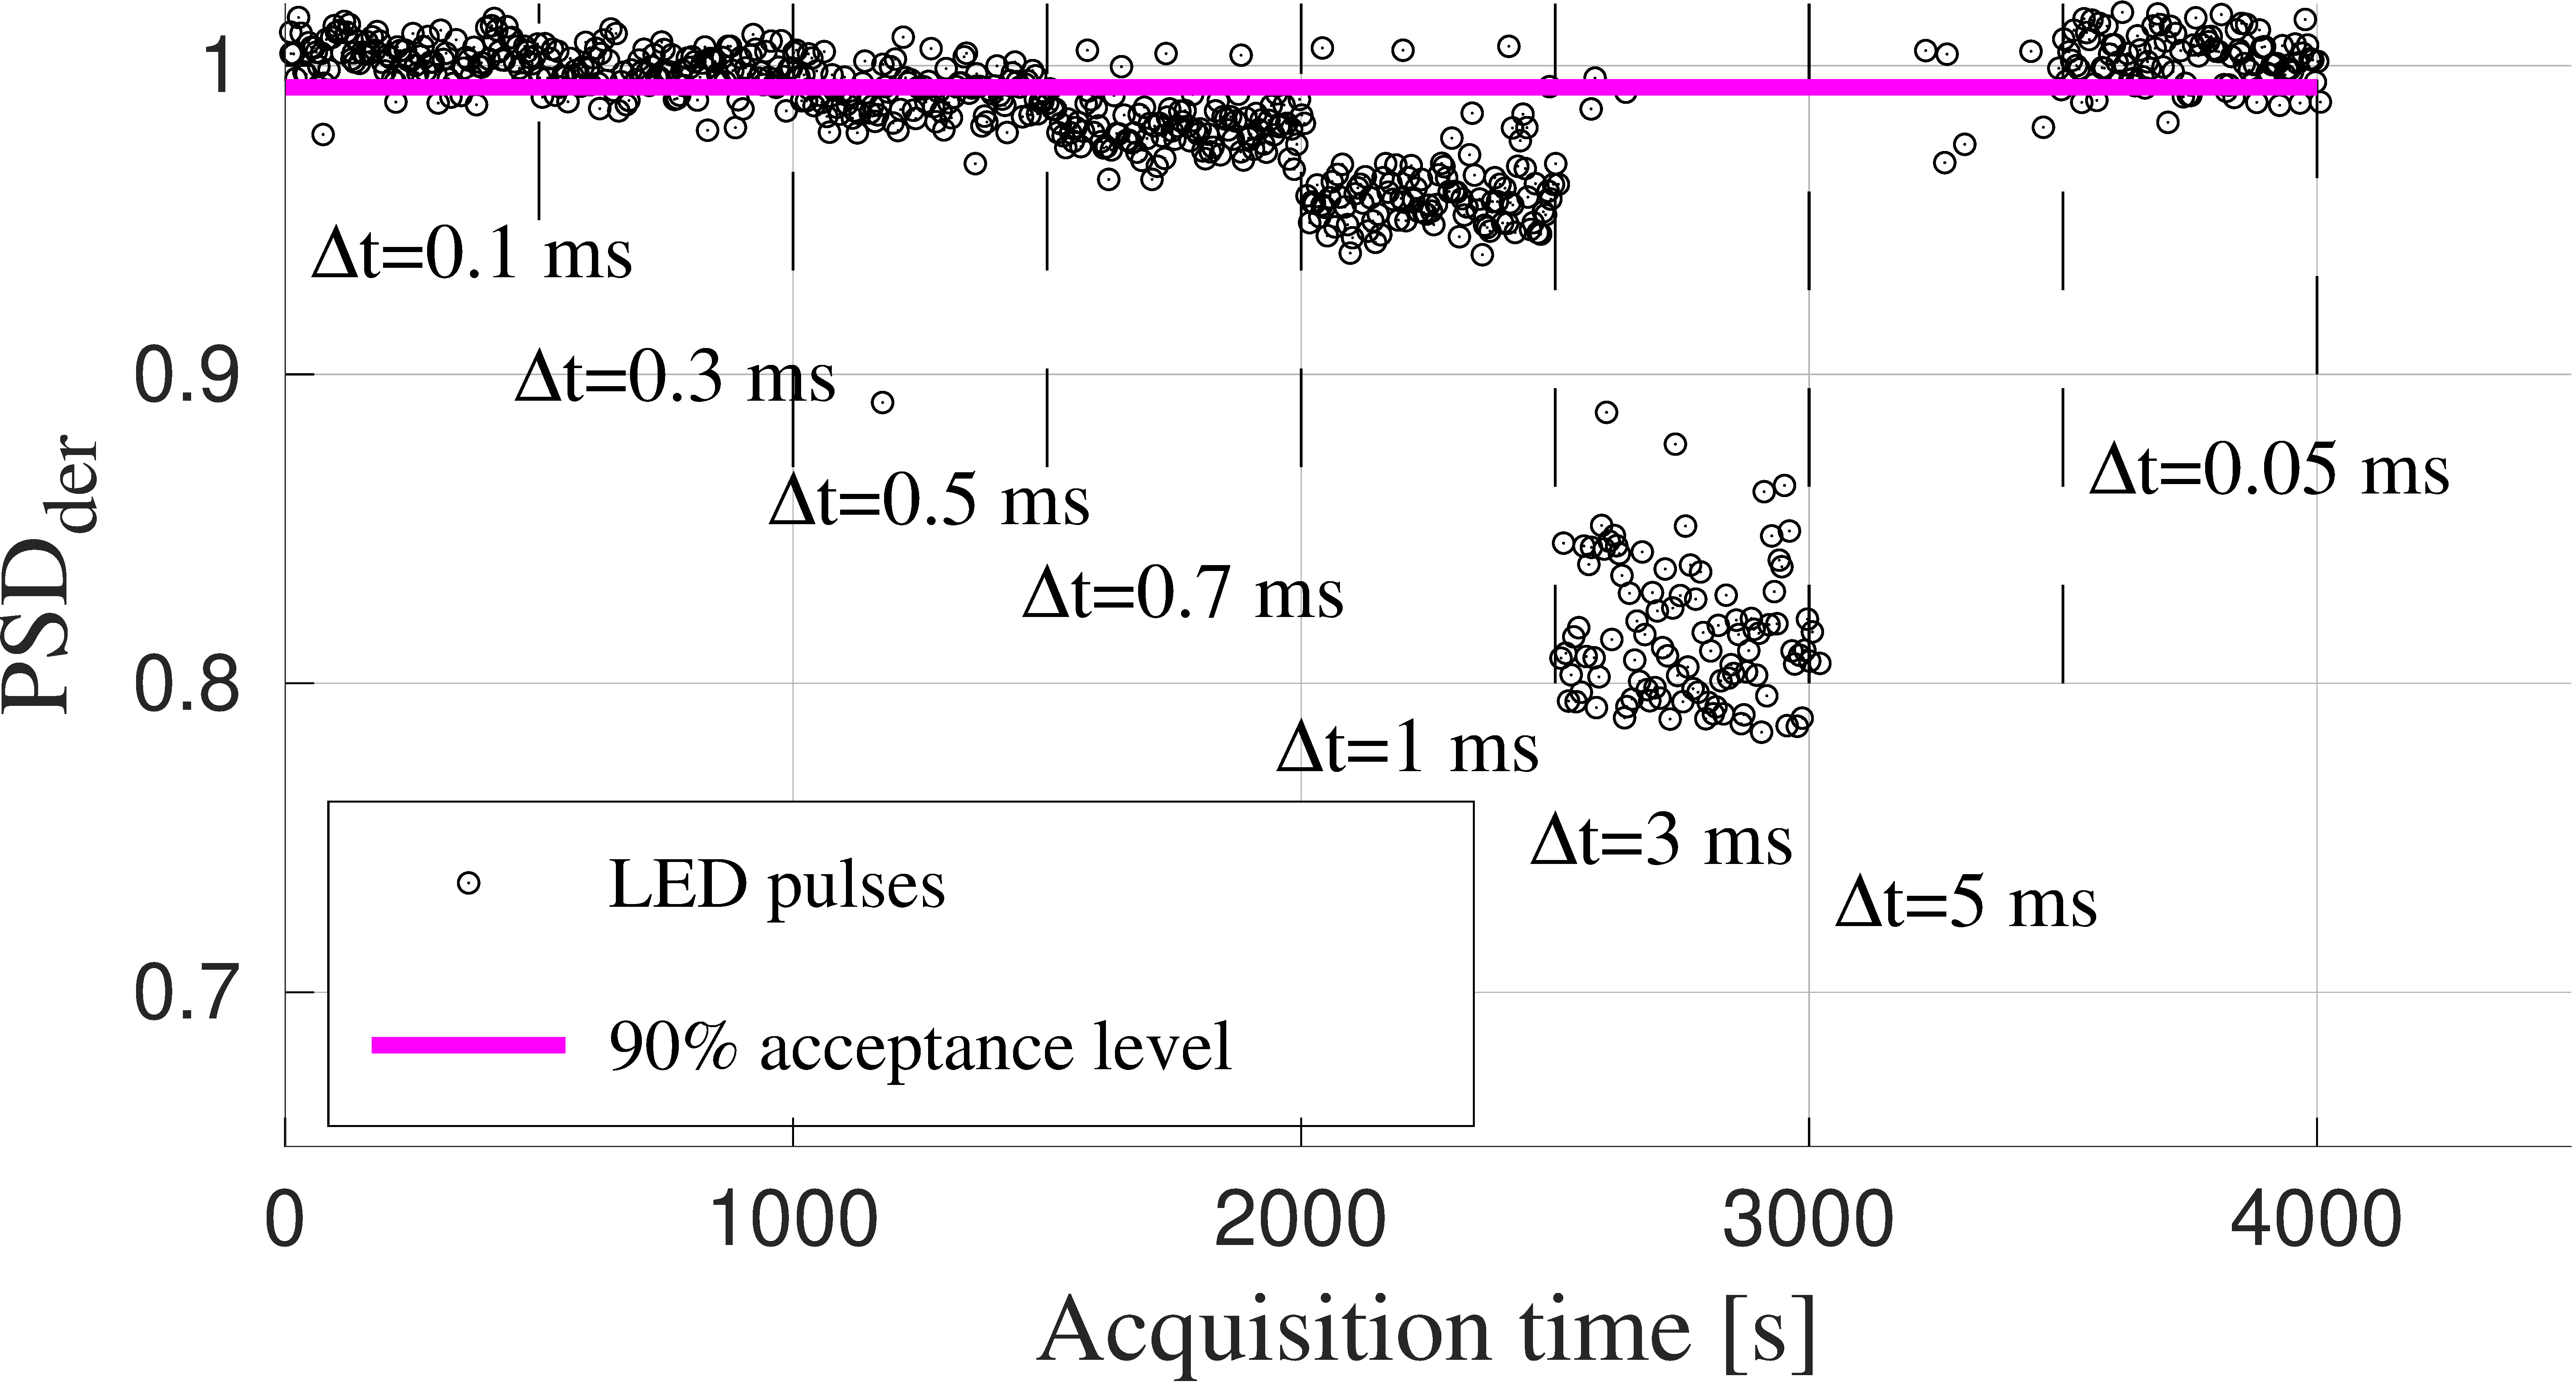
From now on we will work exploiting PSDder instead of PSDsig. Figure 4 reports the PSDder as a function of the running time for a full measurement acquired at Ve = 50 V and LED pulses injected according to the t time pattern as defined in Section 2.2. A PSDcut value, shown as a pink horizontal line in Fig. 4, is determined and adjusted such as to keep 90% of single-pulse events (t = 0.05 ms). For each group of pile-up pulses (100 consecutive) the number of events with PSD PSDcut is counted and compared to the total number of events injected. The rejection factor is defined as and the pile-up rejection power curves are traced for each set of measurements. Figure 5 shows all the experimental results together44 4 For V V the pulses are almost buried in the signal noise; the corresponding rejection power being far away from the goal.; for completeness, for each set the S/N ratio is also given, which shows that the rejection capabilities increases with increasing S/N ratio, as also reported in Chernyak:2014; Chernyak:2017, and expected from signal processing in general.

4 Simulations
4.1 Synthetic data generation, analysis and results
In order to reproduce, control and understand our pile-up experimental data, we adopted a method which permits to generate synthetic data, indistinguishable from the real, measured data Helis:2021. The method is hereafter described.
Starting from a record of data (streaming) we proceed by:
- 1)
constructing an average signal in the exact same condition as previously performed using the experimental data (see above);
- 2)
summing the average signal re-scaled to an amplitude A1 with an another average signal of re-scaled amplitude A2, but time-shifted of t;
- 3)
inserting the previously constructed pile-up pulses to the experimental data streaming (the full measurement was taken into account and we made sure that in the selected region no pulses were present).
The full procedure is sketched in Fig. 6.

We built the synthetic data streaming conforming with our experimental measurements, namely equal amplitudes of the two signals, identical t pattern and the same number of pile-up events and repetition rate. The synthetic data are then elaborated using the same analysis pipeline of the experimental data. The pile-up rejection values are hence extracted as described in the previous section.
To benchmark the quality of the synthetic data we compared in Fig. 7 the synthetic pile-up rejection performances with the experimental one. An excellent agreement is observed in the whole range, within the uncertainties55 5 Bayesian statistics calculation was used to infer the error bars on the experimental data and are within the symbols. The variance for a having out of occurrences reads: . We finally have 68% within where . For a rejection of 0.1 () and a number of occurrences of 100, 0.03. They are equal as for the synthetic simulation as the number of occurrences is the same, namely 100 events for each t Ullrich:2007., between the measurement and the synthetic data.
In the next section we will show how we performed wider synthetic data simulations by modifying the pile-up time step, number of occurrences, and A1/A2 ratio to best comply with a real double-beta decay experiment.

4.2 Refined synthetic pile-up simulation
First of all we refined our synthetic data by producing pile-up events with a t running from 0 to 3 ms with a time step of 0.1 ms, and injecting 1800 events for each, assuming equal amplitudes for the two signals (A1A2). This produces the orange curve shown in Fig. 7.
However, a realistic synthetic simulation (called hereafter full simulation) must take into account that the amplitudes of the two signals, A1 and A2, should comply with the energy distribution Chernyak:2012. Therefore, pile-up events are constructed by picking up twice randomly inside this energy distribution and summing them up with a t ranging from 0 to 3 ms. We finally select those events having an energy in the ROI, i.e. 3034 keV 50 keV (Fig. 8). The full simulation pile-up rejection curve is shown in Fig. 7 as red solid line. It should be noticed that we expect a lower pile-up rejection efficiency than for the case where pulses have identical amplitudes (orange curve). This is due to the fact that for A1A2 (A1A2) pile-up events may be barely distinguishable from single-pulses and may not be rejected. This is precisely what is observed in Fig. 7 as the red plain curve (A1A2) is below the orange dashed one (A1A2). The full simulation and the approximate simulation returning almost the same rejection power curves motivates the simplified approach employed in the experimental work.

4.3 Background index extraction
To extract the background index resulting from pile-up events from these simulations we need to compute the probability, (t), to obtain an event at 3034 keV resulting from a pile-up of two events coming from the 22 decay for different values of t between the two single events.
These probabilities are shown in Fig. 9 where the distributions of the amplitude of the pile-up events are presented for t0 and 1 ms. The rightmost distribution corresponds to t0 ms and does not depend on the signal shape since it is identical to the initial average signal. Hence the amplitude of the signal does not vary after the optimal filtering whereas for t 0 it does. The presented distributions were obtained for an analytical signal of 1.2 ms rise-time, the description of which is presented hereafter. The leftmost curve (blue) corresponds to the amplitude of the pile-up events for t ms and the middle (red) one corresponds to its distribution, slightly distorted by the optimal filtering procedure.

We then calculated the background indexes associated to pile-ups of 100Mo 22 events for every simulated configuration (Table 2) as follows:
| (1) |
where is the time step (here 0.1 ms as in the simulations), the number of 100Mo nuclei and is the half-life of the 100Mo 22 decay.
In the next section we study how the signal rise-time changes the pile-up rejection efficiency.
4.4 Signal rise-time and pile-up rejection efficiency
It is of major interest to investigate and predict how the light detector rise-time will affect the pile-up rejection capability, combined with the S/N ratio. To this end, we generated an analytical average pulse, which is profiled by adding a Gaussian function, to account for the rising part of the signal, with a sum of exponential functions, to account for the decay part of the signal.
Figure 10 shows three analytic average pulses with different rise-time values; even though the blue curve ( = 1.2 ms) does reproduce fairly well the experimental average pulse (dashed gray line) extracted from the measurements, all the simulations with these rise-time were performed with the experimental average pulse.

Analytical pulses enable to make faster/slower average pulses in a simple manner, to produce different synthetic simulation data and extract, accordingly, the power rejection curves . The variation of the pile-up rejection power curves with respect to the pulse decay time is less important and therefore is not taken into account in this study.
We have performed full simulations with the pulses of Fig. 10, varying for each the S/N ratio accordingly; results are displayed in Fig. 11. It should be noticed that the S/N achieved correspond to the 1.2 ms rise-time signal (as in the experiment) and for NTL-LD electrode biases V10, 30, 50 V, the three left round blue dots of Fig. 11. The S/N corresponding to 70 and 90 V were extrapolated.
The method here presented is a powerful tool to predict the pile-up rejection power and hence the pile-up background index achievable in the ROI, by simply combining few, generic detector specification as S/N ratio and rise-time.

4.5 Approximate evaluation of the background index
As we performed the full simulations for every bias, we were able to determine the t value corresponding to 50% pile-up rejection (t50%). This latter was calculated using a linear interpolation between the two consecutive t leading to rejection below and above 50%. Corresponding values are reported in Table 2 as well as the background index. The background index associated to pile-ups of 100Mo 22 events in a 280 g bolometer, 95% 100Mo-enriched and using the PSDder parameter can be approximated as:
| (2) |
where t50% is expressed in ms.
Because of the high slope of the rejection power curve around , the above equation gives a better feeling of the BI that can be achieved than by simply extrapolating from the value where 90% rejection is obtained as often expressed Armatol:2021b. With this rule of thumb hereby expressed, in order to obtain ckky CUPID:2019 we should reach 50% rejection for signal separated by t = 0.18 ms.
| Bias | S/N | BI [in 10-4 ckky] | t50% [ms] | ||
|---|---|---|---|---|---|
| V | for 2 ms | for 1.2 ms | for 0.8 ms | for 1.2 ms | |
| 10 | 26 | 3.9 | 2.7 | 1.9 | 0.91 |
| 30 | 67 | 2.5 | 1.6 | 0.88 | 0.58 |
| 50 | 103 | 1.9 | 1.3 | 0.63 | 0.47 |
| 70 | 141 | 1.6 | 1.1 | 0.48 | 0.40 |
| 90 | 181 | 1.5 | 1.0 | 0.45 | 0.37 |
5 Conclusions
Some future bolometric experiments, like CROSS and CUPID, rely on a detector technology based on NTD-equipped scintillating bolometers to search for the of 100Mo. Due to the poor time resolution of the main heat bolometer, randomly-coincident (pile-up) 100Mo decay events will eventually represent the main source of background in the next-generation, large-scale, 02 decay searches based on this technology. To circumvent this problem we have operated a Li2MoO4 scintillating bolometer in combination with a Neganov-Trofimov-Luke light detector. Thanks to the fast time response and the enhanced S/N ratio performances of this latter, we investigated the rejection of pile-ups from single-pulse events utilizing the mere scintillation signal. We studied the pile-up rejection performance of the setup in a validation run hosted in the CROSS cryogenic underground facility. We demonstrated for first time with an experimental pile-up measurement coupled with a simulation, that it is possible to reject randomly-coincident events in massive Li2100MoO4 cryogenic scintillating bolometers, as those of CROSS and CUPID experiments, down to background indexes of ckky (at the Qββ of 100Mo), via the scintillation signal.
Together with the experimental work, we presented (i) an approximate and full simulation method to reconstruct, synthetically, randomly coincident events from the decay mode, (ii) a new pulse-shape discrimination algorithm based on a derivative, optimal-filtering signal processing technique capable to provide superior pile-up rejection efficiencies. The experimental and simulation pile-up rejection results have been compared: we observed an excellent agreement between them. As we have shown that there is a strong dependence with the signal rise-time, it is strongly recommended that we use the real signal such as the one coming from calibrations to extract the average signal to be used in the simulation to predict the achievable background index.
With respect to CUPID, the CROSS detectors foresee to have the additional capability to reject surface events Bandac:2021. The reduction of the random-coincidence background enables to fully exploit the CROSS surface sensitive technology. In fact, the background induced by beta particles emitted by the radioactive contamination of the passive materials facing the detectors is a sub-dominant contribution of the background in the ROI that will emerge only after the mitigation of the random-coincidence component.
New investigations are ongoing to further enhance the light detector S/N ratio via higher NTL electrode bias, shorten the light detector rise-time and hopefully reach background indexes in the ROI of ckky, which would fully comply with the CUPID experiment goal.
Acknowledgments
This work is supported by the European Commission (Project CROSS, Grant No. ERC-2016-ADG, ID 742345) and by the Agence Nationale de la Recherche (Project CLYMENE; ANR-16-CE08-0018; Project CUPID-1; ANR-21-CE31-0014, ANR France). We acknowledge also the support of the P2IO LabEx (ANR-10-LABX0038) in the framework ”Investissements d’Avenir” (ANR-11-IDEX-0003-01 – Project ”BSM-nu”) managed by ANR, France.
References
- (1) E Majorana, Il Nuovo Cimento, 14(4), 171 (1937)
- (2) G Racah, Il Nuovo Cimento, 14(7), 322 (1937)
- (3) B Pontecorvo, Sov. Phys. JETP, 26, 984 (1968)
- (4) J Schechter and J.W.F. Valle, Phys. Rev. D, 22, 2227 (1980)
- (5) R Arnold et al. (NEMO-3 Collaboration), Phys. Rev. D 92, 072011 (2015)
- (6) A Gando et al., Phys. Rev. Lett., 117, 082503 (2016)
- (7) S I Alvis et al. (Majorana Collaboration), Phys. Rev. C 100, 025501 (2019)
- (8) G Anton et al., Phys. Rev. Lett. 123, 161802 (2019)
- (9) O Azzolini et al., Phys. Rev. Lett. 123, 032501 (2019)
- (10) D Q Adams et al., Phys. Rev. Lett. 124, 122501 (2020)
- (11) M Agostini et al., Phys. Rev. Lett., 125, 252502 (2020)
- (12) T B Bekker et al., Astroparticle Physics, 72, 38-45 (2016)
- (13) E Armengaud et al., Eur. Phys. J. C, 77, 785 (2017)
- (14) E Armengaud et al., Eur. Phys. J. C, 80, 44 (2020)
- (15) E Armengaud et al., Phys. Rev. Lett., 126, 181802 (2021)
- (16) C Augier et al., Eur. Phys. J. C, 82, 1033 (2022)
- (17) D Poda, Physics, 3, 473-535 (2021)
- (18) D M Chernyak et al., Eur. Phys. J. C, 77, 3 (2017)
- (19) A Armatol et al., Eur. Phys. J. C, 81, 104 (2021)
- (20) V Grigorieva et al., Journal of Materials Science and Engineering B, 7, (3-4), 63-70 (2017)
- (21) I C Bandac et al., Journal of High Energy Physics volume 2020, Article number: 18 (2020)
- (22) E Armengaud et al., Eur. Phys. J. C, 80, 674 (2020)
- (23) A Armatol et al., Phys Rev C, 104, 015501 (2021)
- (24) V Novati et al., Nucl. Instrum. Methods Phys. Res. A, 940, 320-327 (2019)
- (25) CUPID Coll., CUPID pre-CDR., arXiv: 1907.09376 (2019)
- (26) E E Haller, Infrared Physics & Technology, 35, 2-3, 127-146 (1994) 0
- (27)
- (28) C. Arnaboldi et al., https://doi.org/10.48550/arXiv.1710.06365 V Alenkov et al., https://doi.org/10.48550/arXiv.1512.05957
- (29) S Kempf, A Fleischmann, L Gastaldo, C Enss, J. Low Temp. Phys. 193, 365 (2018)
- (30) E Andreotti et al., Nucl. Instrum. Meth. A 664, 161–170 (2012)
- (31) M Velázquez et al., Solid State Science, 65, 41-51 (2017)
- (32) C Stelian et al., Journal of Crystal Growth, 531, 125385 (2020)
- (33) K Alfonso et al., Eur. Phys. J. C, 82, 810 (2022)
- (34) E Olivieri et al., AIP Conf. Proc., 1185, 310 (2009)
- (35) C Arnaboldi et al., IEEE Trans. Nucl. Sci., 49, 2440–2447 (2002)
- (36) P Carniti, C Gotti, and G Pessina, J. Low Temp. Phys., 199, 833 (2020)
- (37) P Carniti, C Gotti, and G Pessina, Nucl. Instrum. Meth. A, 1045, 167658(2022); https://doi.org/10.1016/j.nima.2022.167658
- (38) E Gatti and P Manfredi, Riv. Nuovo Cim., 9, 1 (1986)
- (39) D M Chernyak et al., Eur. Phys. J. C, 74, 2913 (2014)
- (40) D Helis, PhD thesis. Orsay, France: Université Paris-Saclay, Sept. 2021, 179.
- (41) T Ullrich and Z Xu, arXiv:physics/0701199v1
- (42) D M Chernyak et al., Eur. Phys. J. C, 72, 1989 (2012)
- (43) I C Bandac et al., Appl. Phys. Lett., 118, 184105 (2021)
- (44) A Armatol et al., Conf. Ser. 2156, 012233 (2021); https://doi.org/10.1088/1742-6596/2156/1/012233
- (45) B. Neganov, V. Trofimov, USSR patent no 1037771, Otkrytia i Izo- breteniya 146 (1985) 215.
- (46) P. N. Luke, Voltage-assisted calorimetric ionization detector, J. Appl. Phys. 64 (1988) 6858.