The Importance of Discerning Flaky from Fault-triggering Test Failures: A Case Study on the Chromium CI
DOI: XXXXXXX.XXXXXXXPrice: 15.00ISBN: 978-1-4503-XXXX-X/18/06
Abstract.
Flaky tests are tests that pass and fail on different executions of the same version of a program under test. They waste valuable developer time by making developers investigate false alerts (flaky test failures). To deal with this problem, many prediction methods that identify flaky tests have been proposed. While promising, the actual utility of these methods remains unclear since they have not been evaluated within a continuous integration (CI) process. In particular, it remains unclear what is the impact of missed faults, i.e., the consideration of fault-triggering test failures as flaky, at different CI cycles. To fill this gap, we apply state-of-the-art flakiness prediction methods at the Chromium CI and check their performance. Perhaps surprisingly, we find that, despite the high precision (99.2%) of the methods, their application leads to numerous faults missed, approximately 76.2% of all regression faults. To explain this result, we analyse the fault-triggering failures and show that flaky tests have a strong fault-revealing capability, i.e.,, they reveal more than of all regression faults, indicating an inherent limitation of all methods focusing on identifying flaky tests, instead of flaky test failures. Going a step further, we build failure-focused prediction methods and optimize them by considering new features. Interestingly, we find that these methods perform better than the test-focused ones, with an MCC increasing from 0.20 to 0.42. Overall, our findings imply that on the one hand future research should focus on predicting flaky test failures instead of flaky tests and the need for adopting more thorough experimental methodologies when evaluating flakiness prediction methods, on the other.
Keywords:
Software testing, Flaky Tests, Machine Learning, Continuous Integration1. Introduction
Continuous Integration (CI) is a software engineering process that allows developers to frequently merge their changes in a shared repository (Rehkopf 2021). To ensure a fast and efficient collaboration, the CI automates parts, if not all, of the development life cycle. Regression testing is an important step of this cycle as it ensures that new changes do not break existing features. Test suites are executed for every commit and test results signal whether changes should be integrated into the codebase or not.
Tests are an essential part of the CI as they prevent faults from interring the codebase, and they ensure smooth code integration and overall good software function. Unfortunately, some tests, named flaky tests, exhibit a non-deterministic behaviour as they both pass and fail for the same version of the codebase. When flaky tests fail, they send false alerts to developers about the state of their applications and the integration of their changes.
Indeed, developers spend time and effort investigating flaky failures, as they can be difficult to reproduce, only to discover that they are false alerts (Eck et al. 2019). These false alerts occur frequently in open-source and industrial projects (Bell et al. 2018; Kowalczyk et al. 2020; Lam et al. 2019b; Leong et al. 2019) and make developers lose not only time but also their trust in the test signal. This trust issue in turn introduces the risk of ignoring fault-triggering test failures. This way, false alerts defy the purpose of software testing and hinder the flow of the CI.
To deal with test flakiness, many techniques aiming at detecting flaky tests have been introduced. A basic approach is to rerun tests multiple times and observe their outcomes. While to some extent effective, test reruns are extremely expensive (Leong et al. 2019; Bell et al. 2018) and unsafe. To this end, researchers have proposed several approaches relying on static (the test code) (Camara et al. 2021a; Pinto et al. 2020; Fatima et al. 2022; King et al. 2018; Leong et al. 2019) or dynamic (test executions) (Bell et al. 2018; Lam et al. 2019b; Ziftci and Cavalcanti 2020) information (or both) (Alshammari et al. 2021) to predict whether a given test is flaky.
Among the many flakiness prediction methods, the vocabulary-based ones (Haben et al. 2021; Pinto et al. 2020; Camara et al. 2021b; Bertolino et al. 2020a; Olewicki et al. 2022) are the most popular (Parry et al. 2022). They rely on machine learning models that predict test flakiness based on the occurrences of source code tokens of the candidate tests. Interestingly, previous research has found these approaches particularly precise, with current state-of-the-art achieving accuracy values higher than 95% (Pinto et al. 2020; Fatima et al. 2022; Camara et al. 2021a; Camara et al. 2021b; Haben et al. 2021).
At the same time, vocabulary-based approaches are static and text-based, thus, they are both portable, i.e., limited to a specific language, and interpretable, i.e., it is easy to share information about important keywords impacting the model’s decisions. All these characteristics (precision, portability and interpretability) make vocabulary-based approaches flexible and easy to use in practice. Therefore, we decided to replicate these techniques on an industrial project (the Chromium project) and evaluated their ability to effectively support the CI process.
Perhaps not surprisingly, we found a similar prediction performance (99.2% precision 98.4% recall) to the ones reported by previous studies. Surprisingly though, we noticed numerous fault-triggering failures (approximately 76% of all fault-triggering failures) being marked as flaky by these prediction methods. This means that, in the case where the Chromium teams were to follow the recommendations of these techniques, they would have missed at least 76% of all regression faults (considering their respective test failures as flaky) that were captured by their test suites.
The paradox of having high flaky test prediction precision and high fault loss (fault-triggering failures considered as flaky) motivated the investigation of the fault-triggering failures. To this end, we made the following three findings:
- •
Flaky tests have a strong fault-triggering capability, i.e., more than of all regression faults are triggered by a test that exhibits flaky behaviour at some point in time. This means that methods aiming at detecting flaky tests, inevitably flag as flaky fault-triggering test failures made by these tests. This indicates an inherent limitation of all methods focusing on identifying flaky tests, a fact largely ignored in previous studies.
- •
Many fault-triggering failures have characteristics similar to flaky ones and thus, are mistakenly flagged as flaky. While such mistakes are expected, given the predictive nature of the approaches, these are expected to be low given the 99.2% prediction precision we have. However, in our data, this set of false classifications represents 56.2% of all fault-triggering failures.
- •
The majority of the flaky tests fail frequently (87.9% of the flaky tests has also flaked in the past), making prediction methods mark them as flaky based on the test history, instead of the characteristics of their failures. In particular, a dummy method that classifies as flaky any test that flaked at least once in the past achieves precision and recall values of 99.8% and 87.8% when predicting flaky test failures.
The above findings motivate the need for techniques focusing on flaky test failures, instead of flaky tests, i.e., discriminating between fault-triggering and flaky test failures, an essential problem that has largely been ignored by previous research (Parry 2021). Therefore, we adapt the vocabulary-based methods for failure-focused predictions and check their performance. Although they miss fewer fault-triggering test failures than the test-focused methods (20.3% FPR compared to 76.2% FPR), their ability to detect fault-triggering failures remains poor, MCC value of 0.25.
With the hope of improving the methods’ performance, we augment their feature set with dynamic features related to (flaky) test executions (e.g., run duration, test outcome and historical flake rate) that we find useful for flakiness diagnosis. We achieve a better –but still not acceptable performance – MCC value of 0.42, indicating an improvement to detect fault-triggering failures when considering dynamic features.
Overall, our study demonstrates the need for methods that can effectively predict flaky test failures (instead of flaky tests) and the need for adopting more thorough experimental methodologies, reflecting the needs of the domain of the actual practice (not just classification metrics), when evaluating flakiness predictions.
In summary, the contributions of our paper are:
- •
We present a large empirical study on flakiness prediction, based on the Chromium project – one of the biggest open-source industrial projects – involving 10,000 builds, more than 200,000 unique tests and 1.8 million test failures. Our study is the first to study the suitability of applying flakiness prediction into a CI pipeline by focusing on the potential losses that they introduce: missed fault-triggering failures.
- •
We provide empirical evidence that flaky test prediction methods, despite being very precise, are practically non-actionable since they flag as flaky a majority, approximately 76.2%, of all fault-triggering failures (56.2% due to model misclassifications and 20% due to correct classification of flaky tests that reveal faults).
- •
We provide empirical evidence that flaky tests have strong fault-triggering capabilities, indicating an inherent limitation of existing methods. At the same time, our results motivate the need for failure-focused prediction techniques. Unfortunately, we also show that existing vocabulary-based methods are insufficiently precise, calling for additional research in this area.
- •
We investigate whether imbuing the training data with additional dynamic features might enhance the failure prediction efficacy. These results show improvement (MCC values are up to 0.42), but indicate that more work remains to be done to develop deployable flakiness prediction for real-world systems.
To support future research, we share our dataset, experimental data and related code, in a replication package.11 1 https://anonymous.4open.science/r/ChromiumFlakyFailures
2. Related Work
| Study | Model | Feature category | Features | Benchmark | Target | Year | ||
|---|---|---|---|---|---|---|---|---|
| King et al. (King et al. 2018) | Bayesian network | Static & dynamic | Code metrics | Industrial | Flaky tests | 2018 | ||
| Pinto et al. (Pinto et al. 2020) | Random forest | Static | Vocabulary | DeFlaker | Flaky tests | 2020 | ||
| Bertolino et al. (Bertolino et al. 2020b) | KNN | Static | Vocabulary | DeFlaker | Flaky tests | 2020 | ||
| Haben et al. (Haben et al. 2021) | Random forest | Static | Vocabulary | DeFlaker | Flaky tests | 2021 | ||
| Camara et al. (Camara et al. 2021b) | Random forest | Static | Vocabulary | iDFlakies | Flaky tests | 2021 | ||
| Alshammari et al. (Alshammari et al. 2021) | Random forest | Static & dynamic |
|
FlakeFlagger | Flaky tests | 2021 | ||
| Fatima et al. (Fatima et al. 2022) | Neural Network | Static | CodeBERT |
|
Flaky tests | 2021 | ||
| Pontillo et al. (Pontillo et al. 2021) | Logistic regression | Static |
|
iDFlakies | Flaky tests | 2021 | ||
| Lampel et al. (Lampel et al. 2021) | XGBoost | Static & dynamic |
|
Industrial | Flaky failures | 2021 | ||
| Qin et al. (Qin et al. 2022) | Neural Network | Static | Dependency graph | Industrial | Flaky tests | 2022 | ||
| Olewicki et al. (Olewicki et al. 2022) | XGBoost | Static | Vocabulary | Industrial | Flaky builds | 2022 | ||
| Ackli et al. (Akli et al. 2022) | Siamese Networks | Static | CodeBERT | Various | Flaky tests | 2022 |
2.1. Test Flakiness
Flakiness is a known issue in software testing but research studies on this topic have only gained momentum in the past few years (Parry 2021). Luo et al. (Luo et al. 2014) conducted the first empirical study on the root causes of flakiness. They analyzed commit fixes from 51 open-source projects and created the first taxonomy of flaky tests. Later on, several studies on test flakiness followed using different settings. Lam et al. (Lam et al. 2019a) conducted a study on flaky tests at Microsoft to identify and understand their root causes. They presented RootFinder, a framework that helps to debug flaky tests using logs and time differences in their passing and failing runs.
Romano et al. (Romano et al. 2021) analysed User Interface (UI) tests and showcased the flakiness root causes and the conditions needed to fix them. In the same vein, Gruber et al. (Gruber et al. 2021) presented a large empirical analysis of more than 20,000 Python projects. They found test order dependency and infrastructure to be among the top reasons for flakiness in those projects.
To help debug, reproduce, and comprehend the causes of flaky tests several tools have been introduced. DeFlaker (Bell et al. 2018) detects flaky tests across commits, without performing any reruns, by checking for inconsistencies in test outcomes with regard to code coverage. Focused on test order dependencies, iDFlakies (Lam et al. 2019b) detects flaky tests by rerunning test suites in various orders.
To increase the chances of observing flakiness, Silva et al. (Silva et al. 2020) introduced Shaker, a technique that relies on stress testing when rerunning potential flaky tests. Another line of work aims at repairing (atuomatically) flaky tests. To this end, Shi et al. (Shi et al. 2019) proposed iFixFlakies, a framework that recommends patches for order-dependent flaky tests based on test patterns found in non-flaky tests that exhibit similar behaviour as flaky tests.
2.2. Flakiness Detection Methods
While they remain scarce, the recent publication of datasets of flaky tests (Bell et al. 2018; Lam et al. 2019b; Gruber et al. 2021) enabled new lines of work. Prediction models were suggested to differentiate flaky tests from non-flaky tests. King et al. (King et al. 2018) presented an approach that leverages Bayesian networks to classify and predict flaky tests based on code metrics. Pinto et al. (Pinto et al. 2020) used a bag of words representation of each test to train a model able to recognize flaky tests based on the vocabulary from the test code. This line of work has gained a lot of momentum lately as models achieved higher performances. Several works were carried out to replicate those studies and ensure their validity in different settings (Haben et al. 2021; Camara et al. 2021b).
In an industrial context, Kowalczyk et al. (Kowalczyk et al. 2020) implemented a flakiness scoring service at Apple. Their model quantifies the level of flakiness based on their historical flip rate and entropy (i.e., changes in test outcomes across different revisions). Their goal was to identify and rank flaky tests to monitor and detect trends in flakiness. They were able to reduce flakiness by 44% with less than 1% loss in fault detection. In our study, we also rely on test history to help with flakiness prediction.
More recently, FlakeFlagger (Alshammari et al. 2021) has been proposed. It builds a prediction model using an extended set of features from the code under test together with test smells. The research community continue to draw attention to this field by considering other possible features to predict flaky tests, this is the case of Peeler (Qin et al. 2022) for example, where the authors leveraged test dependency graphs to predict flaky tests.
Less attention has been given to flaky failures or false alerts prediction. Herzig et al. (Herzig and Nagappan 2015) used association rules to identify false alert patterns in the specific case of system and integration tests that contain steps. They evaluated their approach on Windows 8.1 and Microsoft Dynamics AX.
Olewicki et al. investigated the possibility of leveraging vocabulary-based features on logs from failing builds to predict if failures are caused by defects in the code or by other non-deterministic issues including flaky test failures. It is interesting to note that their work focuses on builds and not tests as we do in our study.
Finally, a recent study by Lampel et al. (Lampel et al. 2021) presented an approach that automatically classifies jobs by deciding if a job failure originates from a bug in the code or from flakiness. To do so, they relied on features from job executions, e.g., CPU load, and run time. As such they are only concerned with some form of flaky failures and not with the utility of detecting flaky failures in CI, instead of tests as we do in this paper.
Table 1 summarizes the state-of-the-art of flakiness prediction in chronological order. By inspecting the table, we see that most of the studies focus on flaky tests, with just one focusing on flaky test failures. We also notice that static features like code metrics and test smells are often used but features based on vocabulary (i.e., bag-of-words) are the most popular ones.
Overall, in contrast to previous work, our study is the first one that investigates the utility of the prediction methods in CI, in relation to the risk of missing fault-triggering test failures.
3. The Chromium Project
3.1. Overview
Started in 2008, with more than 2,000 contributors and 25 million lines of code, the Chromium web browser is one of the biggest open-source projects currently existing. Google is one of the main maintainers, but other companies and contributors are also taking part in its development.
Chromium relies on LuCI as a CI platform (team 2021). It uses more than 900 parallelized builders, each one of them used to build Chromium with different settings (e.g., different compilers, instrumented versions for memory error detection, fuzzing, etc) and to target different operating systems (e.g., Android, Mac OS, Linux, and Windows). Each builder is responsible for a list of builds triggered by commits made to the project. If a builder is already busy, a scheduler creates a queue of commits waiting to be processed. This means that more than one change can be included in a single build execution if the development pace is faster than what the builders can process. Within a build, we find details about build properties, start and end times, status (i.e., pending, success or failure), a listing of the steps and links to the logs.
In the beginning of the project, building and testing were sequential. Builders used to compile the project and zip the results to builders responsible for tests. Testing was taking a lot of time, slowing developers’ productivity and testing Chromium on several platforms was not conceivable. A swarming infrastructure was then introduced in order to scale according to the Chromium development team’s productivity, to keep getting the test results as fast as possible and independently from the number of tests to run or the number of platforms to test. A fleet of 14,000 build bots runs tasks in parallel. This setup helps to run tests with low latency and handle hundreds of commits per day (contributors 2021).

 PASS depicts successful tests,
  FLAKY depicts tests that passed after failing at least once, while
  UNEXPECTED depicts tests that persistently failed.
In this study, we focus on testers, i.e., builders only responsible for running tests. They do not compile the project: when triggered, they simply extract the build from their corresponding builder and run tests on this version. At the time of writing, we found 47 testers running Chromium test suites on distinct operating systems versions. About 200,000 tests are divided into different test suites, the biggest ones being blink_web_tests (testing the rendering engine) and base_unittests with more than 60,000 tests each.
For each build performed by any tester, we have access to information about test results. Figure 1 illustrates the decision process followed by LuCI to determine a test outcome in a specific build. A test is labelled as pass when it successfully passed after one execution. In case of a failure, LuCI automatically reruns the test up to 5 times. If all reruns fail, the test is labelled as unexpected and will trigger a build failure. In the remaining, we will be referring to unexpected tests as fault-revealing tests. If a test passes after having one or more failed executions during the same build, it is labelled as flaky and will not prevent the build from passing.
3.2. Example of a flaky test
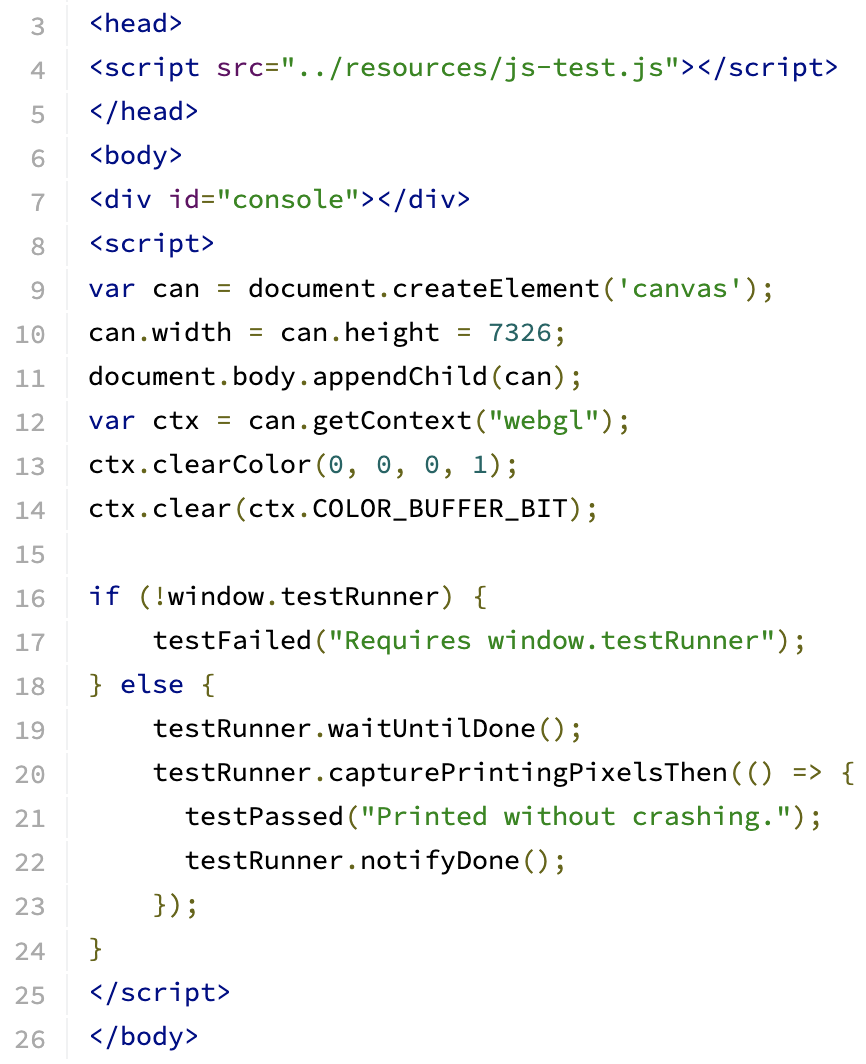
Figure 2 shows a flaky test found in build 119,03922 2 https://ci.chromium.org/ui/p/chromium/builders/ci/Linux%20Tests/119039/ of the Linux Tester. This test, printing/webgl-oversized-printing.html, ensures that no crash happens on the main thread of the rendering process when using the system. Unfortunately, on its first execution, the test failed after 31 seconds. The run status indicates that a TIMEOUT happened. On the second execution, the test passed after 15 seconds and thus was labelled as flaky. In this case, an issue has been opened in Chromium’s bug tracking system.33 3 https://bugs.chromium.org/p/chromium/issues/detail?id=1393294 Developers state that "this test makes a huge memory allocation in the GPU process which intermittently causes OOM and a GPU process crash".
Timeout is a run status that intuitively leads to possible flakiness, as we can easily think of other executions of the same test being completed before reaching the time limit. In addition to this feature, we can also look for hints of flakiness in the source code. As of many UI tests in Chromium, this one is handled by testRunner: a test harness in charge of their automatic executions. We can see the testRunner making a call to waitUntilDone() on line 19. Vocabulary about waits is common in Chromium’s web tests. This keyword, for example, could potentially be leveraged by flakiness detectors to classify tests or failures.
4. Data
4.1. Definitions
Some of our definitions are slightly different from the one used by previous work since Chromium has its specific continuous integration setup. To make things clear, we define the elements we will discuss in this section. In the scope of a single build, we employ the following definitions:
- •
Fault-revealing test: A test that consistently failed after reruns in the same build, revealing a regression.
- •
Flaky test: A test that failed once or more and then passed after reruns in the same build.
- •
Flaky failure: A failure caused by a flaky test.
- •
Fault-triggering failure: A failure caused by a fault-revealing test.
4.2. Data collection
To perform our study, we collected test execution data from 10,000 consecutive builds completed by the Linux Tester by querying the LuCI API. This represents a period of time of about 9 months taken between March 2022 and December 2022.
Table 2 summarises the list of information extracted and computed for all tests executed in all builds. The buildId corresponds to the build in which tests were executed. Run duration is the execution time spent to run the test. Run status gives information about the run result (e.g., passing, failing, and skipped) and run tag status returns more precise information about the result of a run depending on the type of test or test suite (e.g., timeout and failure on exit). We retrieved information about the tests’ source code by querying Google Git 44 4 https://chromium.googlesource.com/chromium/src/+/HEAD/. As builds often handle several commits, we select the revision corresponding to the head of the blame list: the one on which tests were executed. The test suite is simply the name of the test suite the test belongs to and testId is a unique identifier for a test composed of the test suite and the test name (the same test name can be present in different test suites).
All the scripts used to collect the data alongside the created dataset are available in our replication package.
| Feature Name | Feature Description |
|---|---|
| buildId | The build number associated |
| with the test execution | |
| flakeRate | The flake rate of the test over the last |
| 35 commits | |
| runDuration | The time spent for this test execution |
| runStatus | ABORT |
| FAIL | |
| PASS | |
| CRASH | |
| SKIP | |
| runTagStatus | CRASH |
| PASS | |
| FAIL | |
| TIMEOUT | |
| SUCCESS | |
| FAILURE | |
| FAILURE_ON_EXIT | |
| NOTRUN | |
| SKIP | |
| UNKNOWN | |
| testSource | The test source code |
| testSuite | The test suite the test belongs to |
| testId | The test name |
| Tester | Nb of Builds | Period of Time | Number of Tests | Number of Failures | ||||
| From | To | Passing | Flaky | Fault-revealing | Flaky | Fault-triggering | ||
| Linux Tests | 10,000 | Mar 2, 2022 | Dec 1, 2022 | 198,273 | 23,374 | 2,343 | 1,833,831 | 17,171 |
4.3. Computing the flake rate
The historical sequence of test results is a valuable piece of information commonly used in software testing at scale (Leong et al. 2019; Kowalczyk et al. 2020). We analyse the history of fault-revealing tests and flaky tests by relying on their flakeRate.
This means that for a test failing (due to flaky or fault-triggering failure) in a build , we analyse all the builds from a time window (i.e., from to to calculate its flake rate as follows:
| (1) |
where if the test flaked in the build and 0 otherwise. This metric allows us to understand if the flakiness history of a test can help in the flakiness prediction tasks. The test execution history (a.k.a. heartbeat) has been used in multiple studies (especially industrial ones (Kowalczyk et al. 2020; Leong et al. 2019)) to detect flaky tests. These studies assume that many flaky tests have distinguishable failure patterns over builds and hence can be detected by observing their history. We check whether this assumption also holds in the case of Chromium.

To illustrate the flake rate differences between flaky and fault-revealing tests, we plot the flake rate for both test categories in Figure 3. The flake rate is computed using a window of 35 builds. To set this time window, we checked the number of flaky tests having a for build windows ranging from 0 to 40 builds with a step of 5. We observed a convergence at size 35, meaning that higher numbers of builds do not provide additional information.
In the majority of cases, flaky tests have a history of flakiness: the percentage of flaky tests having a is in fact . Furthermore, we see a pike for , 9.5% of flaky tests were always flaky in their 35 previous builds. Still, there is a non-negligible amount (45.3%) of fault-revealing tests that were flaky at least once in previous builds considered: with a . From these observations, we may suggest that the flakeRate() can be used to detect flakiness. Nevertheless, there is still an important overlap between the history of flaky tests and fault-revealing tests.
5. Objectives and Methodology
5.1. Research questions
We start our analysis by assessing the effectiveness of the existing flakiness prediction methods in our project by considering the critical cases where fault-triggering test failures are flagged as flaky by the prediction methods in various CI cycles. We thus are interested in investigating the methods’ performance under realistic settings, i.e., correctly detected and missed flaky and fault-triggering test failures, when trained with past CI data and evaluated on future ones. In contrast to previous work, this analysis introduces a new dimension in the evaluation of flakiness predictions which is the investigation of what we lose when adopting a prediction method (the fault-triggering failures classified as flaky). Therefore, we ask:
- RQ1::
-
How well do flaky test prediction methods discern flaky test failures from fault-triggering ones?
To establish realistic settings, we train the prediction models using the information available (flaky tests and non-flaky ones) at a given point in time, where we have sufficient historical data to train on. We then evaluate the models in subsequent commits with respect to flaky and fault-triggering test failures. We replicate the vocabulary-based methods since they are popular, easy to implement and quite effective, and aimed at learning to predict flaky tests, as done by previous studies.
After checking the prediction performance in a realistic setting (test failures), we repeat the entire process but now we train on historical test failures instead of tests. We make this adaptation with the hope of improving further our predictions and perhaps improving our understanding of the impact that such predictions may have on missed fault-triggering test failures (those marked by the models as flaky). Hence, we ask:
- RQ2::
-
How well do flaky test failure prediction methods discern flaky test failures from fault-triggering ones?
Finally, we wish to be comprehensive, so we also optimize and extend the prediction methods with additional features, some of which were suggested by previous studies (the flake rate (Kowalczyk et al. 2020), the run duration (Alshammari et al. 2021)) and some dynamic features (test run status, test run tag status, test run duration) that we found by us when experimenting with the flaky tests. Thus, we ask:
- RQ3::
-
Can we improve the accuracy of the flaky test failure predictions by considering dynamic test execution features?
To answer RQ3, we repeat the analysis carried out for RQ2 but now we are training and optimising for the additional features that we determined during our analysis and check the performance we achieve with regards to test failures, as performed in RQ2.
5.2. Experimental procedure
5.2.1. Selection of a flaky test detection approach
Being a recent topic of interest, several techniques have been introduced in the scientific literature. Approaches relying on code coverage such as FlakeFlagger (Alshammari et al. 2021) or DeFlaker (Bell et al. 2018) are challenging to implement in our case. Chromium’s code base consists of several languages and code coverage is both costly and non-trivial to retrieve. Test smells (Camara et al. 2021a) approaches are also difficult to extract as tests are written in many different languages and tools do not always exist. Having those constraints in mind, we decide to use the vocabulary-based approach introduced by Pintoet al. (Pinto et al. 2020). It received significant attention with several replication studies conducted (Haben et al. 2021; Camara et al. 2021b) and follow-up studies and its lightweight makes it easy to implement regardless of the languages being used.
5.2.2. Training and validation of the existing approaches (RQ1)
We evaluate the ability of the vocabulary-based approach, trained to differentiate flaky from non-flaky tests and used to predict flaky test failures. To do so, we divide our dataset into a training set (containing test information about the first 8,000 builds) and a test set (containing test information about the last 2,000 builds). We train our model following the existing methodologies. The flaky set includes all tests marked as flaky in the training set. The non-flaky set includes all fault-revealing tests and all passing tests in the 8,000th build (i.e., the last build of the training set) minus the tests that are found as flaky in any of the builds under study (to increase the confidence of being non-flaky). The test set includes all flaky test failures and all fault-triggering failures (reported by fault-revealing tests). The test set is common in all RQs.
5.2.3. Implementation of a failure classifier (RQ2 and RQ3)
We select flaky failures in our dataset as all failures produced by flaky tests and fault-triggering failures are all failures produced by fault-revealing tests. There are no duplicated data in the case of test failures, as each test execution is unique. For RQ2, we train our classifier on non-flaky executions (passing and fault-revealing tests execution) and flaky failures. In RQ3, we report the performance of a model using execution features (run duration and flake rate).
5.2.4. Time-sensitive evaluation
We split our data in two parts: the first 80% builds are selected as a training set and the last 20% as a holdout set. By doing so, we respect the evolution of failures across time and avoid any data leakage that could occur by randomly selecting data. This time-sensitive aspect is very important to consider. We found that not taking this condition into account and training a model on a shuffled dataset would greatly overestimate the performance. Figure 4 shows a representation of our dataset. Flaky tests are present in all builds and Fault-revealing tests are occasional: they happen in of builds (See 7). To make mitigate imbalance, we collected all passing tests for 1 build: and use them in our set of non-flaky tests, for training.

5.2.5. Classifier selection and pipeline description
We use random forest to perform the predictions. Unfortunately, our dataset is imbalanced, especially in the case of failure predictions where the minority class constitutes 1% of the data. Using a simple random forest would greatly increase the chance of having few or no elements from our minority class in the different trees, making the overall model poor in predicting the class of interest. To alleviate this issue, we decide to use a Balanced Random Forest classifier(Chen et al. 2004) to facilitate the learning. This implementation artificially modifies the class distribution in each tree so that they are equally represented.
To represent the test sources, we use CountVectorizer to convert texts as a matrix of token counts. This technique, known as bag-of-words, is used in previous vocabulary-based approaches (Pinto et al. 2020; Haben et al. 2021; Camara et al. 2021b; Bertolino et al. 2020a; Olewicki et al. 2022). Test vectors initially contain as many features as there are words in all test sources. The overall generated dictionary can have a significant size. To reduce the number of features, we use feature selection. This step has several advantages. First, it removes irrelevant features which reduces noise in the data and thus, improves the overall performance of the model. Secondly, selecting only important features can help in model interpretability. Finally, as fewer features are used, it reduces training time.
To this end, we use SelectKBest(learn developers 2022) which retains the highest score features based on the univariate statistical test . Hyper-parameters of the machine learning pipeline, i.e., the number of trees in the forests, the sampling strategy for SMOTE and the number of features to be retained are tuned using a grid search approach and cross-validation in the training set. Once optimized, we retrain a model fitted on the whole training set and evaluate it on the holdout set.
5.2.6. Metrics
Finally, to evaluate the different models, we rely on the following metrics derived from true positives (TP), true negatives (TN), false positives (FP) and false negatives (FN):
The accuracy of a model is sensitive to class imbalance. In particular, the precision and recall metrics can easily be impacted when one class is underrepresented. To alleviate this issue, we report the Matthews Correlation Coefficient (MCC) which is a more reliable statistical rate to avoid over-optimistic results in the case of an imbalanced dataset (Chicco and Jurman 2020). This metric takes into consideration all four entries of the confusion matrix. MCC ranges from -1 to 1 and is given by the following formula:
In addition to those metrics, we also report the false positive rate (FPR), that is, the ratio of fault-triggering failures misclassified as flaky over all fault-triggering failures. It is defined by:
6. Results
6.1. RQ1: Discerning flaky from fault triggering test failures when training on tests
We trained a model on 69,159 passing tests, 910 fault-revealing tests and 8,857 flaky tests (unique tests). Then, we evaluated it on 217,503 failures caused by flaky tests and 2,320 fault-triggering failures caused by fault-revealing tests. Table 4 reports the obtained performance. Similar to the performance achieved by previous vocabulary-based models on other datasets, our model was able to reach high accuracy with a precision of 99.2% and a recall of 98.9%. However, we note a high false-positive rate. This is due to an important amount (76.2%) of fault-triggering failures classified as flaky (FP). This is concerning: fault-triggering failures should not be misclassified as they reflect the existence of real bugs. Overall, the MCC value we have is 0.20, and shows that the model struggles (compared to random selection) to identify fault-triggering failures.
| Precision | Recall | MCC | FPR |
| 99.2% | 98.9% | 0.20 | 76.2% |

The confusion matrix of our model decisions is depicted in Figure 5. The x-axis reports the predicted label and the y-axis the actual label. Correct classifications are displayed in the top left (TN) and bottom right (TP). We clearly observe that the model is able to detect flaky tests with high precision. We also see that 2,435 flaky tests are classified as non-flaky (FN). This number is also important to consider: it translates in all cases where developers will be required to investigate irrelevant failures.
We want to further understand the reasons behind the classification of fault-triggering failures. Therefore, we analyse the (fault-revealing) tests causing those failures. Out of the 2,320 fault-triggering failures, 1,768 are in the set of false positives (76.2%) among which we found 463 (20% of all fault-triggering failures) whose tests have a history of flakiness (flakeRate > 0) in the training set and 1,305 (56.2% of all fault-triggering failures) without flakiness history. Here it must be noted that depending on the size of the history considered, we may have more tests with past flakiness or less. Overall in our data, 1/3 of all fault-triggering failures are due to tests that have exhibited flakiness behaviour.
6.2. RQ2: Discerning flaky from fault triggering test failures when training on test failures
The results from RQ1 show that a vocabulary-based model trained to detect flaky tests would still yield an important number of missed faults and false alerts despite having high accuracy. Thus, our goal with RQ2 is to check whether by training our vocabulary-based model we can improve the performance of recognising fault-triggering failures.
Table 5 reports the results of such a model. In particular the first row of reports results based on failure training while the second row reports results related to RQ3. Similar to RQ1, we see a high precision and recall, 99.7% and 91.3% respectively, when predicting flaky failures. More interestingly, the MCC slightly increased to 0.25.
| Execution features | Precision | Recall | MCC | FPR |
|---|---|---|---|---|
| No | 99.7% | 91.3% | 0.25 | 20.3% |
| Yes | 99.5% | 98.7% | 0.42 | 42.3% |
6.3. RQ3: Improving the accuracy of the flaky test failure predictions
In this RQ we check he performance of the vocabulary-based models on the failure classification task when considering additional features from the test executions (run duration, and tests’ historical flake rate). These features reflect better the characteristics of the test executions and are linked with test flakiness thereby leading to better results.
In particular, the second row of Table 5 reports the related performance. We observe an improvement compared to the model that relies only on vocabulary (RQ2). This new model achieves a similar precision and recall of 99.5% and 98.7% and an improved MCC value 0.42, indicating a better performance in comparison to randomly picked selections. We see that the FPR increased to 42.3%. Together, the results can be explained by fewer false alerts: flaky failures being marked as fault-triggering by the model.
7. Discussion
We seek to better understand the results showing that existing approaches targeting the detection of flaky tests missed a non-negligible part (76.2%) of fault-triggering failures by classifying them as flaky. To do so, we investigate the following aspects regarding the entire dataset.
We first report general information about the prevalence of flaky tests and fault-revealing tests in order to have a better representation of failures occurring in each build. Then, we report the number of fault-revealing tests also found as flaky by the Chromium CI (reruns) in other builds (we further refer to them as fault-revealing flaky tests). Finally, we also check for the number of failing builds that only contain fault-revealing flaky tests. We consider those builds as particularly harmful, as regressions are not reported by any reliable tests.

Figure 6 shows the distribution of flaky tests and fault-revealing tests in the studied builds. We observe that there is an average of 178 flaky tests per build with a low standard deviation (41), showing that flakiness is prevalent in the Chromium CI. In the case of fault-revealing tests, taking into account all builds would result in an average number of tests close to 0 as a majority of builds are exempt from them. Thus, for better visualisation, we only considered builds containing at least one fault-revealing test (i.e., failing builds). The average number of fault-revealing tests per failing build is 2.7. The standard deviation for fault-revealing tests is 14.9 and the number of fault-revealing tests reported in one build goes up to 579 in our dataset.
| Builds containing | Number |
|---|---|
| Flaky tests | 10,000 |
| Fault-revealing tests | 2,415 |
| Fault-revealing flaky tests | 1,974 |
| Exclusively fault-revealing flaky tests | 1,766 |
Table 6 provides, for each type of test, the number of builds that contain at least one instance of this type. We notice that all builds contain at least one flaky test (a test that flaked during this build). In Chromium CI, flaky tests are non-blocking and will not cause a build failure. That is, tests flaking within the build are ignored during this build. Developers are expected to investigate test failures only when they occur consistently across 5 reruns (resulting in a fault-revealing test). Such fault-revealing tests occur in 24.15% of the builds (i.e. in 2,415 builds). Interestingly, 1,974 of these builds (i.e. 81.73%) contain fault-revealing tests that flaked in previous builds, indicating that tests with a flake history should not be ignored in future builds. Perhaps worse, in 1,766 builds all fault-revealing tests have flaked in some previous builds, indicating that no "reliable" tests identified the fault(s).

We now investigate the status of all tests across all builds – see Figure 7. Among the 209,530 tests of the Chromium project, 24,820 have failed in at least one build, including 22,477 that were always flaky. Thus, 2,343 tests were fault-revealing in at least one build, i.e., they attested the presence of faults. 897 of these tests were also detected as flaky in at least one other build. That is, 38.3% of tests that have been useful to detect regressions have also a history of flakiness.
8. Threats to validity
8.1. Construct validity
The main threat to the construct validity of our study lies in our use of vocabulary-based approaches as predictors for flaky tests and flaky failures. Approaches leveraging other features, i.e., dynamic, static, or both, could perform better. As explained in section 5.2.1, many features are difficult to extract in the case of Chromium (e.g., test smells, test dependency graphs…) and features relying on code coverage are not considered due to the overheads they introduce, perhaps also because it is challenging to instrument the entire codebase. Although the absence of coverage features limits our features, the same situation appears in many major companies such as Google and Facebook. Nevertheless, our key insight is that many regression faults are discovered by flaky tests, meaning that they would have been missed even by any flaky test detector that correctly considers them as flaky.
8.2. External validity
With our study, we show that detecting flaky tests in the CI with the goal of disregarding their signals is harmful as it can miss reporting many regressions. This is the case for the Chromium project and, while we believe Chromium to be representative of other large software systems, we cannot guarantee that findings would generalise to other projects. Similarly, the performance of the different models we report may vary depending on the project. Here, we mainly focus on web/GUI tests and flakiness might have different causes in HTML and Javascript testing compared to other programming languages. Nevertheless, we believe that in other cases flaky tests are useful since developers tend to keep flaky tests instead of discarding them. Therefore, flaky test signals should always be considered with caution.
8.3. Internal validity
We assume that all fault-revealing tests in our dataset indeed reflect one or several regressions in the code. This is the information reported by the Chromium CI as of today. It is possible that some fault-revealing tests are actually flaky tests that were not reruns enough time. However, no amount of reruns can guarantee that a test is not flaky. As this information is currently used by Chromium’s developers and further verification is non-trivial, we rely on it as ground truth for our dataset. Passing tests used as non-flaky tests could also be prone to mislabel in our dataset. However, there is a consequent number of passing tests and it is unlikely that many would actually be flaky. Furthermore, to strengthen our confidence in our set of non-flaky tests, we remove from the set of passing tests any tests that were found to be either flaky or fault-revealing in any of the 10,000 builds.
Additionally, it is possible that more than one regression fault is present in the case of several fault-revealing tests failing in one build. Although this could alter the results we report in RQ1, it would actually strengthen our key message as even more regression faults could be missed.
9. Conclusion
In this paper, we investigated the utility of existing flaky test prediction methods in the context of a continuous integration pipeline. To do so, we collected information about 23,374 flaky tests and 2,343 fault-revealing tests totalling a dataset of 1.8 million test failures representing the actual development process over 10,000 builds in a period of 9 months. We evaluated prediction methods when asked to classify flaky failures and fault-triggering failures. We reported similar performance compared to previous works in terms of precision and recall. Despite the (very) high accuracy to detect flaky failures, we were surprised to find that 76.2% of fault-triggering failures were misclassified as flaky by the prediction methods. To explain this behaviour, we showed that flaky tests have in fact a strong ability to detect faults: of faults are revealed by tests that were found to be flaky at some point.
These findings motivate the need for failure-focused prediction methods. Thus, we continued our analysis by checking the performance of failure-focused models (trained on failures instead of tests). We found that they result in similar accuracy and fewer false positives. We also found that considering test execution features such as the run duration and the historical flake rate was helpful to increase its ability to discern flaky failures and fault-triggering failures. Still, we believe that the current performance is not actionable in Chromium’s CI pipeline. Further research should focus on the vastly-ignored problem of predicting failures instead of tests.
Our future agenda aims at improving the performance of flaky test failure detection techniques by using additional features and artificial data (augmenting the training data with new positive examples to tackle the class imbalance issues). We also plan to develop failure-cause interpretations for the techniques so that they could be usable by the Chromium developers.
References
- (1)
- Akli et al. (2022) Amal Akli, Guillaume Haben, Sarra Habchi, Mike Papadakis, and Yves Le Traon. 2022. Predicting Flaky Tests Categories using Few-Shot Learning. https://doi.org/10.48550/ARXIV.2208.14799
- Alshammari et al. (2021) Abdulrahman Alshammari, Christopher Morris, Michael Hilton, and Jonathan Bell. 2021. FlakeFlagger: Predicting flakiness without rerunning tests. In 2021 IEEE/ACM 43rd International Conference on Software Engineering (ICSE). IEEE, IEEE, Madrid, Spain, 1572–1584.
- Bell et al. (2018) Jonathan Bell, Owolabi Legunsen, Michael Hilton, Lamyaa Eloussi, Tifany Yung, and Darko Marinov. 2018. DeFlaker: Automatically Detecting Flaky Tests. In Proceedings of the 40th International Conference on Software Engineering - ICSE ’18. ACM Press, New York, New York, USA, 433–444. https://doi.org/10.1145/3180155.3180164
- Bertolino et al. (2020a) Antonia Bertolino, Emilio Cruciani, Breno Miranda, and Roberto Verdecchia. 2020a. Know Your Neighbor: Fast Static Prediction of Test Flakiness. Proceedings of the International Conference on Software Engineering (ICSE) (2020). https://doi.org/10.32079/ISTI-TR-2020/001.Istituto
- Bertolino et al. (2020b) Antonia Bertolino, Antonio Guerriero, Breno Miranda, Roberto Pietrantuono, and Stefano Russo. 2020b. Learning-to-rank vs ranking-to-learn: Strategies for regression testing in continuous integration. In Proceedings of the ACM/IEEE 42nd International Conference on Software Engineering. IEEE, Online event, 1–12.
- Camara et al. (2021a) Bruno Camara, Marco Silva, Andre Endo, and Silvia Vergilio. 2021a. On the use of test smells for prediction of flaky tests. In Brazilian Symposium on Systematic and Automated Software Testing. 46–54.
- Camara et al. (2021b) B. Camara, M. Silva, A. T. Endo, and S. Vergilio. 2021b. What is the Vocabulary of Flaky Tests? An Extended Replication. In 2021 2021 IEEE/ACM 29th International Conference on Program Comprehension (ICPC) (ICPC). IEEE Computer Society, Los Alamitos, CA, USA, 444–454. https://doi.org/10.1109/ICPC52881.2021.00052
- Chen et al. (2004) Chao Chen, Andy Liaw, Leo Breiman, et al. 2004. Using random forest to learn imbalanced data. University of California, Berkeley 110, 1-12 (2004), 24.
- Chicco and Jurman (2020) Davide Chicco and Giuseppe Jurman. 2020. The advantages of the Matthews correlation coefficient (MCC) over F1 score and accuracy in binary classification evaluation. BMC genomics 21, 1 (2020), 1–13.
- contributors (2021) Chromium contributors. 2021. The Chromium Projects. https://www.chromium.org/. (Accessed on 08/17/2021).
- Eck et al. (2019) Moritz Eck, Fabio Palomba, Marco Castelluccio, and Alberto Bacchelli. 2019. Understanding flaky tests: The developer’s perspective. In Proceedings of the 2019 27th ACM Joint Meeting on European Software Engineering Conference and Symposium on the Foundations of Software Engineering. ACM, Tallin, Estonia, 830–840.
- Fatima et al. (2022) Sakina Fatima, Taher A. Ghaleb, and Lionel Briand. 2022. Flakify: A Black-Box, Language Model-Based Predictor for Flaky Tests. IEEE Transactions on Software Engineering (2022), 1–17. https://doi.org/10.1109/TSE.2022.3201209
- Gruber et al. (2021) Martin Gruber, Stephan Lukasczyk, Florian Kroiß, and Gordon Fraser. 2021. An empirical study of flaky tests in python. In 2021 14th IEEE Conference on Software Testing, Verification and Validation (ICST). IEEE, IEEE, Online, 148–158.
- Haben et al. (2021) Guillaume Haben, Sarra Habchi, Mike Papadakis, Maxime Cordy, and Yves Le Traon. 2021. A replication study on the usability of code vocabulary in predicting flaky tests. In 2021 IEEE/ACM 18th International Conference on Mining Software Repositories (MSR). IEEE, IEEE, Madrid, Spain, 219–229.
- Herzig and Nagappan (2015) Kim Herzig and Nachiappan Nagappan. 2015. Empirically Detecting False Test Alarms Using Association Rules. Proceedings - International Conference on Software Engineering 2 (2015), 39–48. https://doi.org/10.1109/ICSE.2015.133
- King et al. (2018) Tariq M King, Dionny Santiago, Justin Phillips, and Peter J Clarke. 2018. Towards a bayesian network model for predicting flaky automated tests. In 2018 IEEE International Conference on Software Quality, Reliability and Security Companion (QRS-C). IEEE, IEEE, Lisbon, Portugal, 100–107.
- Kowalczyk et al. (2020) Emily Kowalczyk, Karan Nair, Zebao Gao, Leo Silberstein, Teng Long, and Atif Memon. 2020. Modeling and Ranking Flaky Tests at Apple. In Proceedings of the ACM/IEEE 42nd International Conference on Software Engineering: Software Engineering in Practice (Seoul, South Korea) (ICSE-SEIP ’20). Association for Computing Machinery, New York, NY, USA, 110–119. https://doi.org/10.1145/3377813.3381370
- Lam et al. (2019a) Wing Lam, Patrice Godefroid, Suman Nath, Anirudh Santhiar, and Suresh Thummalapenta. 2019a. Root Causing Flaky Tests in a Large-Scale Industrial Setting. In Proceedings ofthe 28th ACM SIGSOFT International Symposium on Software Testing and Analysis (ISSTA ’19). ACM Press, Beijing, China, 101–111. https://doi.org/10.1145/3293882.3330570
- Lam et al. (2019b) Wing Lam, Reed Oei, August Shi, Darko Marinov, and Tao Xie. 2019b. iDFlakies: A framework for detecting and partially classifying flaky tests. In 2019 12th ieee conference on software testing, validation and verification (icst). IEEE, IEEE, Xian, China, 312–322.
- Lampel et al. (2021) Johannes Lampel, Sascha Just, Sven Apel, and Andreas Zeller. 2021. When Life Gives You Oranges: Detecting and Diagnosing Intermittent Job Failures at Mozilla. In Proceedings of the 29th ACM Joint Meeting on European Software Engineering Conference and Symposium on the Foundations of Software Engineering (Athens, Greece) (ESEC/FSE 2021). Association for Computing Machinery, New York, NY, USA, 1381–1392. https://doi.org/10.1145/3468264.3473931
- learn developers (2022) Scikit learn developers. 2022. sklearn.feature_selection.SelectKBest — scikit-learn 1.1.2 documentation. https://scikit-learn.org/stable/modules/generated/sklearn.feature_selection.SelectKBest.html. (Accessed on 08/11/2022).
- Leong et al. (2019) Claire Leong, Abhayendra Singh, Mike Papadakis, Yves Le Traon, and John Micco. 2019. Assessing transition-based test selection algorithms at Google. In Proceedings of the 41st International Conference on Software Engineering: Software Engineering in Practice, ICSE (SEIP) 2019, Montreal, QC, Canada, May 25-31, 2019, Helen Sharp and Mike Whalen (Eds.). IEEE / ACM, Montréal, Canada, 101–110. https://doi.org/10.1109/ICSE-SEIP.2019.00019
- Luo et al. (2014) Qingzhou Luo, Farah Hariri, Lamyaa Eloussi, and Darko Marinov. 2014. An empirical analysis of flaky tests. In Proceedings of the ACM SIGSOFT Symposium on the Foundations of Software Engineering, Vol. 16-21-November-2014. Association for Computing Machinery, Hong Kong, 643–653. https://doi.org/10.1145/2635868.2635920
- Olewicki et al. (2022) Doriane Olewicki, Mathieu Nayrolles, and Bram Adams. 2022. Towards Language-Independent Brown Build Detection. In Proceedings of the 44th International Conference on Software Engineering (Pittsburgh, Pennsylvania) (ICSE ’22). Association for Computing Machinery, New York, NY, USA, 2177–2188. https://doi.org/10.1145/3510003.3510122
- Parry (2021) Owain Parry. 2021. A Survey of Flaky Tests. ACM transactions on software engineering and methodology 31, 1 (2021).
- Parry et al. (2022) Owain Parry, Gregory M. Kapfhammer, Michael Hilton, and Phil McMinn. 2022. A Survey of Flaky Tests. ACM Trans. Softw. Eng. Methodol. 31, 1 (2022), 17:1–17:74. https://doi.org/10.1145/3476105
- Pinto et al. (2020) Gustavo Pinto, Breno Miranda, Supun Dissanayake, Marcelo d’Amorim, Christoph Treude, and Antonia Bertolino. 2020. What is the vocabulary of flaky tests?. In Proceedings of the 17th International Conference on Mining Software Repositories. IEEE, Seoul, South Korea, 492–502.
- Pontillo et al. (2021) Valeria Pontillo, Fabio Palomba, and Filomena Ferrucci. 2021. Toward static test flakiness prediction: A feasibility study. In Proceedings of the 5th International Workshop on Machine Learning Techniques for Software Quality Evolution. 19–24.
- Qin et al. (2022) Yihao Qin, Shangwen Wang, Kui Liu, Bo Lin, Hongjun Wu, Li Li, Xiaoguang Mao, and Tegawendé F Bissyandé. 2022. PEELER: Learning to Effectively Predict Flakiness without Running Tests. In 2022 IEEE International Conference on Software Maintenance and Evolution (ICSME). IEEE, 257–268.
- Rehkopf (2021) Max Rehkopf. 2021. What is Continuous Integration | Atlassian. https://www.atlassian.com/continuous-delivery/continuous-integration. (Accessed on 01/12/2021).
- Romano et al. (2021) Alan Romano, Zihe Song, Sampath Grandhi, Wei Yang, and Weihang Wang. 2021. An Empirical Analysis of UI-based Flaky Tests. In 2021 IEEE/ACM 43rd International Conference on Software Engineering (ICSE). IEEE, IEEE, Madrid, Spain, 1585–1597.
- Shi et al. (2019) August Shi, Wing Lam, Reed Oei, Tao Xie, and Darko Marinov. 2019. iFixFlakies : A Framework for Automatically Fixing Order-Dependent Flaky Tests. In 27th ACM Joint European Software Engineering Conference and Symposium on the Foundations ofSoftware Engineering (ESEC/FSE ’19). ACM, TALLINN, ESTONIA, 545–555. https://doi.org/10.1145/3338906.3338925
- Silva et al. (2020) Denini Silva, Leopoldo Teixeira, and Marcelo d’Amorim. 2020. Shake it! detecting flaky tests caused by concurrency with shaker. In 2020 IEEE International Conference on Software Maintenance and Evolution (ICSME). IEEE, IEEE, Adelaide, Australia, 301–311.
- team (2021) The Chromium Development team. 2021. chromium/chromium: The official GitHub mirror of the Chromium source. https://github.com/chromium/chromium. (Accessed on 07/06/2021).
- Ziftci and Cavalcanti (2020) Celal Ziftci and Diego Cavalcanti. 2020. De-flake your tests: Automatically locating root causes of flaky tests in code at google. In 2020 IEEE International Conference on Software Maintenance and Evolution (ICSME). IEEE, 736–745.