EEP-3DQA: Efficient and Effective Projection-based 3D Model
Quality AssessmentThanks: This work was supported in part by NSFC (No.62225112, No.61831015), the Fundamental Research Funds for the Central Universities, National Key R&D Program of China 2021YFE0206700, and Shanghai Municipal Science and Technology Major Project (2021SHZDZX0102).
Abstract
Currently, great numbers of efforts have been put into improving the effectiveness of 3D model quality assessment (3DQA) methods. However, little attention has been paid to the computational costs and inference time, which is also important for practical applications. Unlike 2D media, 3D models are represented by more complicated and irregular digital formats, such as point cloud and mesh. Thus it is normally difficult to perform an efficient module to extract quality-aware features of 3D models. In this paper, we address this problem from the aspect of projection-based 3DQA and develop a no-reference (NR) Efficient and Effective Projection-based 3D Model Quality Assessment (EEP-3DQA) method. The input projection images of EEP-3DQA are randomly sampled from the six perpendicular viewpoints of the 3D model and are further spatially downsampled by the grid-mini patch sampling strategy. Further, the lightweight Swin-Transformer tiny is utilized as the backbone to extract the quality-aware features. Finally, the proposed EEP-3DQA and EEP-3DQA-t (tiny version) achieve the best performance than the existing state-of-the-art NR-3DQA methods and even outperforms most full-reference (FR) 3DQA methods on the point cloud and mesh quality assessment databases while consuming less inference time than the compared 3DQA methods.
Index Terms:
3D model, point cloud, mesh, effective and efficient, projection-based, no-reference, quality assessment2 MoE Key Lab of Artificial Intelligence, AI Institute, Shanghai Jiao Tong University
I Introduction
3D models such as point cloud and mesh have been widely studied and applied in virtual/augmented reality (V/AR), game industry, film post-production, etc. However, the 3D models are usually bothered by geometry/color noise and compression/simplification loss during generation and transmission procedures. Therefore, many 3D model quality assessment (3DQA) methods have been proposed to predict the visual quality levels of degraded 3D models. Nevertheless, due to the complex structure of the 3D models, efficient feature extraction is difficult to perform and most 3DQA methods require huge computational resources and inference time, which makes it hard to put such methods into practical use and calls for more efficient 3DQA solutions.
Normally speaking, 3DQA methods can be categorized into model-based and projection-based methods. Different from model-based 3DQA methods that extract features directly for the 3D models, projection-based 3DQA methods evaluate the visual quality of 3D models via the 2D projections (regardless of the 3D models’ digital representation formats and resolution), which can take advantage of the mature 2D vision backbones to achieve cost-effective performance. Unfortunately, the projections are highly dependent on the viewpoints and a single projection is not able to cover sufficient quality information. Therefore, many projection-based 3DQA methods try to utilize multiple projections or perceptually select the main viewpoint to achieve higher performance and gain more robustness [1, 2, 3, 4, 5]. Namely, VQA-PC [2] uses 120 projections for analysis and G-LPIPS [3] needs to select the main viewpoint that covers the most geometric, color, and semantic information in advance. However, multiple projections and perceptual selection lead to taking up extra rendering time and huge computational resources, which motivates us to develop an Efficient and Effective Projection-based 3D Model Quality Assessment (EEP-3DQA) method based on fewer projections.
Specifically, we propose a random projection sampling (RPS) strategy to sample projections from the 6 perpendicular viewpoints to reduce the rendering time cost. The tiny version EEP-3DQA-t only employs 2 projections while the base version EEP-3DQA employs 5 projections. The number of the projections is defined according to the experimental discussion in Section IV-E. Then, inspired by [6], we employ the Grid Mini-patch Sampling (GMS) strategy and adopt the lightweight Swin-Transformer tiny (ST-t) as the feature extraction backbone [7] since ST-t has a hierarchical structure and processes inputs with patch-wise operations, therefore it is naturally suitable for processing grid mini-patch maps.) With the features extracted from the sampled projections, the fully-connected layers are used to map the features into quality scores. Finally, we average the quality scores of the sampled projections as the final quality value for the 3D model. The extensive experimental results show that the proposed method outperforms the existing NR-3DQA methods on the point cloud quality assessment (PCQA) and mesh quality assessment (MQA) databases, and is even superior to the FR-3DQA methods on the PCQA databases. Our proposed tiny version only takes about 1.67s to evaluate one point cloud on CPU (11.50 faster than VQA-PC) while still obtaining competitive performance.
II Related Work
In this section, we briefly review the development of model-based and projection-based 3DQA methods.
II-A Model-based 3DQA
The early FR-PCQA methods only use the geometry information to estimate the quality loss at the point level [8, 9]. Further, to deal with the colored point clouds, both geometry and color information are incorporated for analysis by calculating the similarity of various quality domains [10, 11, 12, 13]. Later, 3D-NSS [14] is proposed by quantifying the distortions of both point clouds and meshes via some classic Natural Scene Statistics (NSS) distributions. ResSCNN [15] proposes an end-to-end sparse convolutional neural network (CNN) to learn the quality representation of the point clouds. Unlike the 3D models used for classification and segmentation, the 3D models for quality assessment are usually denser and contain more points/vertices, thus making the feature extraction more complicated.
II-B Projection-based 3DQA
Similar to the FR image quality assessment (IQA) methods, the early projection-based FR-3DQA methods compute the quality loss between the projections rendered from the reference and the distorted 3D models [16, 17, 18]. Namely, Tian [16] introduces a global distance over texture image using Mean Squared Error (MSE) to quantify the effect of color information. Yang [17] uses both projected and depth images upon six faces of a cube for quality evaluation.
The performance of the projection-based methods is further boosted by the development of deep learning networks. PQA-net [1] designs a multi-task-based shallow network and extracts features from multi-view projections of the distorted point clouds. VQA-PC [2] proposes to treat the point clouds as moving camera videos by capturing frames along the defined circular pathways, and utilize both 2D-CNN and 3D-CNN for spatial and temporal feature extraction respectively. G-LPIPS [3] perceptually selects the main viewpoint of the textured meshes and assesses the quality of the main viewpoint projection with CNN.
III Proposed Method
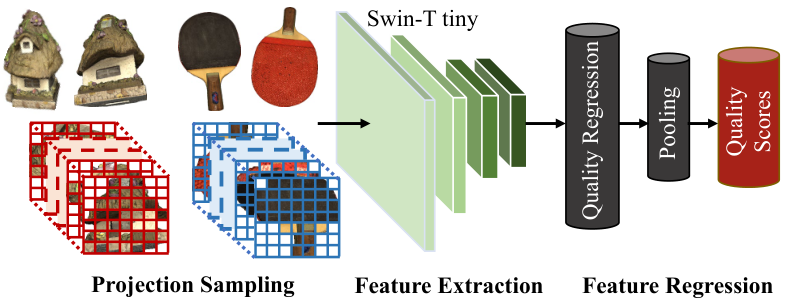
The framework of the proposed method is illustrated in Fig 1, which includes the projection sampling process, the feature extraction module, and the feature regression module.

III-A Projection Sampling Process
Following the mainstream projection setting employed in the popular point cloud compression standard MPEG VPCC [19], we define 6 perpendicular viewpoints of the given 3D model represented by point cloud or mesh, corresponding to the 6 surfaces of a cube:
| (1) |
where indicates the set of the 6 projections and denotes the projection capture process. Additionally, the white background of the projections is cropped out. There may exist redundant quality information among the 6 projections and the efficiency can be improved by extracting sufficient quality information from fewer projections since fewer projections consume less rendering time and computational resource. Therefore, we propose a Random Projection Sampling (RPS) strategy to improve the efficiency, which functions by randomly selecting projections for evaluation:
| (2) |
where denotes for the RPS operation and stands for the set of sampled projections. It’s worth noting that only the selected projections are rendered.
Further inspired by the boosted efficiency benefited from Grid Mini-patch Sampling (GMS) [6], we similarly cut the projections into uniformly none-overlapped spliced spatial grids as the sampled results:
| (3) |
where indicates the GMS operation and represents the set of projections after GMS operation. From Fig. 2, we can see that the spatial grids can maintain the local quality-aware patterns that can be bothered with resize operation.
III-B Efficient Feature Extraction
To take up fewer flops and parameters, we select the light-weight Swin-Transformer tiny (ST-t) [7] as the feature extraction backbone. Given the input projections set , the quality-aware features can be obtained as:
| (4) | ||||
where represents the feature extraction operation with ST-t, indicates the extracted feature maps from the -th input sampled projection, stands for the average pooling operation and denotes the pooled features.
III-C Quality Regression
To map the quality-aware features into quality scores, we simply adopt a two-stage fully-connected (FC) layer for regression:
| (5) |
where indicates the quality score for the -th sampled projection. Then the final quality for the given 3D model can be computed by averaging the quality values:
| (6) |
where indicates the final quality score for the 3D model. The Mean Squared Error (MSE) is utilized as the loss function:
| (7) |
where is the predicted quality scores, is the quality label of the 3D model, and is the size of the mini-batch.
| Ref | Type | Methods | SJTU-PCQA | WPC | ||||||
|---|---|---|---|---|---|---|---|---|---|---|
| SRCC | PLCC | KRCC | RMSE | SRCC | PLCC | KRCC | RMSE | |||
| FR | Model-based | MSE-p2po | 0.7294 | 0.8123 | 0.5617 | 1.3613 | 0.4558 | 0.4852 | 0.3182 | 19.8943 |
| HD-p2po | 0.7157 | 0.7753 | 0.5447 | 1.4475 | 0.2786 | 0.3972 | 0.1943 | 20.8990 | ||
| MSE-p2pl | 0.6277 | 0.5940 | 0.4825 | 2.2815 | 0.3281 | 0.2695 | 0.2249 | 22.8226 | ||
| HD-p2pl | 0.6441 | 0.6874 | 0.4565 | 2.1255 | 0.2827 | 0.2753 | 0.1696 | 21.9893 | ||
| PSNR-yuv | 0.7950 | 0.8170 | 0.6196 | 1.3151 | 0.4493 | 0.5304 | 0.3198 | 19.3119 | ||
| PCQM | 0.8644 | 0.8853 | 0.7086 | 1.0862 | 0.7434 | 0.7499 | 0.5601 | 15.1639 | ||
| GraphSIM | 0.8783 | 0.8449 | 0.6947 | 1.0321 | 0.5831 | 0.6163 | 0.4194 | 17.1939 | ||
| PointSSIM | 0.6867 | 0.7136 | 0.4964 | 1.7001 | 0.4542 | 0.4667 | 0.3278 | 20.2733 | ||
| Projection-based | PSNR | 0.2952 | 0.3222 | 0.2048 | 2.2972 | 0.1261 | 0.1801 | 0.0897 | 22.5482 | |
| SSIM | 0.3850 | 0.4131 | 0.2630 | 2.2099 | 0.2393 | 0.2881 | 0.1738 | 21.9508 | ||
| NR | Model-based | 3D-NSS | 0.7144 | 0.7382 | 0.5174 | 1.7686 | 0.6479 | 0.6514 | 0.4417 | 16.5716 |
| ResSCNN | 0.8600 | 0.8100 | - | - | - | - | - | - | ||
| Projection-based | PQA-net | 0.8500 | 0.8200 | - | - | 0.7000 | 0.6900 | 0.5100 | 15.1800 | |
| VQA-PC | 0.8509 | 0.8635 | 0.6585 | 1.1334 | 0.7968 | 0.7976 | 0.6115 | 13.6219 | ||
| EEP-3DQA-t | 0.8891 | 0.9130 | 0.7324 | 0.9741 | 0.8032 | 0.8124 | 0.6176 | 12.9603 | ||
| EEP-3DQA | 0.9095 | 0.9363 | 0.7635 | 0.8472 | 0.8264 | 0.8296 | 0.6422 | 12.7451 | ||
IV Experiment
IV-A Benchmark Databases
To investigate the efficiency and effectiveness of the proposed method, the subjective point cloud assessment database (SJTU-PCQA) [17], the Waterloo point cloud assessment database (WPC) proposed by [20], and the textured mesh quality (TMQ) database proposed by [3] are selected for validation. The SJTU-PCQA database introduces 9 reference point clouds and each reference point cloud is degraded into 42 distorted point clouds, which generates 378 = 976 distorted point clouds in total. The WPC database contains 20 reference point clouds and augmented each point cloud into 37 distorted stimuli, which generates 740 = 2037 distorted point clouds. The TMQ database includes 55 source textured meshes and 3,000 corrupted textured meshes with quality labels. The 9-fold cross validation is utilized for the SJTU-PCQA database and the 5-fold cross validation is used for the WPC and the TMQ databases respectively. The average performance is recorded as the final performance results.
IV-B Competitors & Criteria
For the PCQA databases, the compared FR quality assessment methods include MSE-p2point (MSE-p2po) [8], Hausdorff-p2point (HD-p2po) [8], MSE-p2plane (MSE-p2pl) [9], Hausdorff-p2plane (HD-p2pl) [9], PSNR-yuv [21], PCQM [10], GraphSIM [11], PointSSIM [12], PSNR, and SSIM [22]. The compared NR methods include 3D-NSS [14], ResSCNN [15], PQA-net [1], and VQA-PC [2]. For the TMQ database, the compared FR quality assessment methods include PSNR, SSIM [22], and G-LPIPS (specially designed for textured meshes) [3]. The compared NR methods include 3D-NSS [14], BRISQUE [23], and NIQE [24]. It’s worth mentioning that PSNR, SSIM, BRISQUE, and NIQE are calculated on all 6 projections and the average scores are recorded.
Afterward, a five-parameter logistic function is applied to map the predicted scores to subjective ratings, as suggested by [25]. Four popular consistency evaluation criteria are selected to judge the correlation between the predicted scores and quality labels, which consist of Spearman Rank Correlation Coefficient (SRCC), Kendall’s Rank Correlation Coefficient (KRCC), Pearson Linear Correlation Coefficient (PLCC), and Root Mean Squared Error (RMSE). A well-performing model should obtain values of SRCC, KRCC, and PLCC close to 1, and the value of RMSE near 0.
IV-C Implementation Details
The employed Swin-Transformer tiny [7] backbone is initialized with the weights pretrained on the ImageNet database [26]. The RPS parameter discussed in Section III-A is set as 2 for the tiny version EPP-3DQA-t and 5 for the base version EPP-3DQA respectively. The adam optimizer [27] is employed with the 1e-4 initial learning rate and the learning rate decays with a ratio of 0.9 for every 5 epochs. The default batch size is set as 32 and the default training epochs are set as 50. The average performance of -fold cross validation is reported as the final performance to avoid randomness.
| Ref | Methods | TMQ | |||
|---|---|---|---|---|---|
| SRCC | PLCC | KRCC | RMSE | ||
| FR | PSNR | 0.5295 | 0.6535 | 0.3938 | 0.7877 |
| SSIM | 0.4020 | 0.5982 | 0.2821 | 0.8339 | |
| G-LPIPS | 0.8600 | 0.8500 | - | - | |
| NR | 3D-NSS | 0.4263 | 0.4429 | 0.2934 | 1.0542 |
| BRISQUE | 0.5364 | 0.4849 | 0.3788 | 0.9014 | |
| NIQE | 0.3731 | 0.3866 | 0.2528 | 0.8782 | |
| EEP-3DQA-t | 0.7350 | 0.7430 | 0.5439 | 0.6468 | |
| EEP-3DQA | 0.7769 | 0.7823 | 0.5852 | 0.5975 | |
IV-D Experimental Results
The experimental results are listed in Table I and Table II. From Table I, we can observe that the proposed EEP-3DQA outperforms all the compared methods while the tiny version EEP-3DQA-t achieves second place on the SJTU-PCQA and WPC databases, which proves the effectiveness of the proposed method. What’s more, all the 3DQA methods experience significant performance drops from the SJTU-PCQA database to the WPC database. This is because the WPC database introduces more complicated distortions and employs relatively fine-grained degradation levels, which makes the quality assessment tasks more challenging for the 3DQA methods. From Table II, we can find that the proposed EPP-3DQA is only inferior to the FR method G-LPIPS. However, G-LPIPS operates on the projections from the perceptually selected viewpoints, which thus gains less practical value than the proposed method.
IV-E Projection Number Selection
In this section, we exhibit the performance with different RPS selections in Fig 3 and give the reasons for why setting as 2 for the tiny version and 5 for the base version of the proposed EPP-3DQA. From Fig 3, we can see that randomly sampling 5 projections obtains the highest performance among all three databases, which is why we set =5 for the base version. Interestingly, using all 6 projections causes performance drops. We attempt to give the reasons for such a phenomenon. Randomly selecting a smaller subset of projections could lead to better quality assessment performance than using all six projections, as it could reduce the influence of outliers and biases. Moreover, redundancy could be a possible reason why using all six projections may not necessarily lead to better quality assessment results. After experimenting with different numbers of projections, 5 projections seem to be the optimal choice for 3DQA tasks, especially for the TMQ database. Additionally, when increases from 1 to 2, the SRCC values gain the largest improvement on the SJTU-PCQA databases and gain relatively significant improvement on the WPC and TMQ databases. Therefore, we set =2 for the tiny version rather than setting =1 to get more cost-effective performance.
IV-F Efficiency Analysis
Previous discussions have proven the effectiveness of the proposed EEP-3DQA, this section mainly focuses on efficiency. Three FR-3DQA methods (PCQM, GraphSIM, and PointSSIM) and two NR-3DQA methods (3D-NSS and VQA-PC) are selected for comparison. It’s worth mentioning that VQA-PC and the proposed EEP-3DQA are deep-learning based methods, and the rest methods are all handcrafted based methods. We test the operation time of the 3DQA methods on a computer with Intel 12500H @ 3.11 GHz CPU, 16G RAM, and NVIDIA Geforce RTX 3070Ti GPU on the Windows platform. The efficiency comparison is exhibited in Table III. We can see that the base version of the proposed method requires only 1/2.09 inference compared with the fastest competitor 3D-NSS while achieving the best performance on CPU. Moreover, the tiny version EEP-3DQA-t takes up even fewer flops and inference time with the compared deep-learning based VQA-PC. All the comparisons confirm the superior efficiency of the proposed EPP-3DQA.
IV-G Ablation Study
We propose two sampling strategies RPS and GMS in Section III-A and we try to investigate the contributions of each strategy. Note that we fix the projection viewpoints as not using the RPS strategy and we test with 5 different sets of fixed projection viewpoints to ease the effect of randomness. The ablation study results are shown in Table IV, from which we can see that using both RPS and GMS achieves higher SRCC values than excluding either of the strategies. This indicates that the proposed RPS and GMS all make contributions to the final results. With closer inspections, we can find that RPS makes relatively more contributions to the tiny version compared with the base version. This is because the base version employs five random projections out of the six perpendicular projections, which is not that significantly different from fixing five projections out of the six perpendicular projections. Additionally, the GMS strategy tends to make more contributions for the base version than the tiny version, which suggests that the GMS strategy can better dig out the quality-aware information with more projections.
| Method | Para. (M) | Gflops | Time (S) CPU/GPU |
|---|---|---|---|
| PCQM | - | - | 12.234.99×/- |
| GraphSIM | - | - | 270.14110.26×/- |
| PointSSIM | - | - | 9.273.78×/- |
| 3D-NSS | - | - | 5.122.09×/- |
| VQA-PC | 58.37 | 50.08 | 19.217.84×/16.4411.26× |
| EEP-3DQA-t | 27.54 | 8.74 | 1.670.68×/1.120.77× |
| EEP-3DQA | 27.54 | 21.87 | 2.451.00×/1.461.00× |
| Ver. | RPS | GMS | SJTU | WPC | TMQ |
|---|---|---|---|---|---|
| Tiny | 0.8711 | 0.7922 | 0.7255 | ||
| 0.8834 | 0.8016 | 0.7347 | |||
| 0.8822 | 0.7953 | 0.7136 | |||
| 0.8891 | 0.8032 | 0.7350 | |||
| Base | 0.8741 | 0.8012 | 0.7333 | ||
| 0.8853 | 0.8140 | 0.7564 | |||
| 0.8933 | 0.8241 | 0.7704 | |||
| 0.9095 | 0.8264 | 0.7769 |
V Conclusion
In this paper, we mainly focus on the efficiency of 3DQA methods and propose an NR-3DQA method to tackle the challenges. The proposed EEP-3DQA first randomly samples several projections from the 6 perpendicular viewpoints and then employs the grid mini-patch sampling to convert the projections into spatial grids while marinating the local patterns. Later, the lightweight Swin-Transformer tiny is used as the feature extraction backbone to extract quality-aware features from the sampled projections. The base EEP-3DQA achieves the best performance among the NR-3DQA methods on all three benchmark databases and the tiny EEP-3DQA-t takes up the least inference time on both CPU and GPU while still obtaining competitive performance. The further extensive experiment results further confirm the contributions of the proposed strategies and the rationality of the structure.
References
- [1] Qi Liu, Hui Yuan, Honglei Su, Hao Liu, Yu Wang, Huan Yang, and Junhui Hou, “Pqa-net: Deep no reference point cloud quality assessment via multi-view projection,” IEEE TCSVT, 2021.
- [2] Zicheng Zhang, Wei Sun, Yucheng Zhu, Xiongkuo Min, Wu Wei, Ying Chen, and Guangtao Zhai, “Treating point cloud as moving camera videos: A no-reference quality assessment metric,” arXiv preprint arXiv:2208.14085, 2022.
- [3] Yana Nehmé, Florent Dupont, Jean-Philippe Farrugia, Patrick Le Callet, and Guillaume Lavoué, “Textured mesh quality assessment: Large-scale dataset and deep learning-based quality metric,” arXiv preprint arXiv:2202.02397, 2022.
- [4] Zicheng Zhang, Wei Sun, Xiongkuo Min, Quan Zhou, Jun He, Qiyuan Wang, and Guangtao Zhai, “Mm-pcqa: Multi-modal learning for no-reference point cloud quality assessment,” arXiv preprint arXiv:2209.00244, 2022.
- [5] Yu Fan, Zicheng Zhang, Wei Sun, Xiongkuo Min, Wei Lu, Tao Wang, Ning Liu, and Guangtao Zhai, “A no-reference quality assessment metric for point cloud based on captured video sequences,” IEEE MMSP, 2022.
- [6] Haoning Wu, Chaofeng Chen, Jingwen Hou, Liang Liao, Annan Wang, Wenxiu Sun, Qiong Yan, and Weisi Lin, “Fast-vqa: Efficient end-to-end video quality assessment with fragment sampling,” in ECCV. Springer, 2022, pp. 538–554.
- [7] Ze Liu, Yutong Lin, Yue Cao, Han Hu, Yixuan Wei, Zheng Zhang, Stephen Lin, and Baining Guo, “Swin transformer: Hierarchical vision transformer using shifted windows,” in IEEE/CVF CVPR, 2021.
- [8] R Mekuria, Z Li, C Tulvan, and P Chou, “Evaluation criteria for point cloud compression,” ISO/IEC MPEG, , no. 16332, 2016.
- [9] Dong Tian, Hideaki Ochimizu, Chen Feng, Robert Cohen, and Anthony Vetro, “Geometric distortion metrics for point cloud compression,” in IEEE ICIP, 2017, pp. 3460–3464.
- [10] Gabriel Meynet, Yana Nehmé, Julie Digne, and Guillaume Lavoué, “Pcqm: A full-reference quality metric for colored 3d point clouds,” in IEEE QoMEX, 2020, pp. 1–6.
- [11] Qi Yang, Zhan Ma, Yiling Xu, Zhu Li, and Jun Sun, “Inferring point cloud quality via graph similarity,” IEEE TPAMI, 2020.
- [12] Evangelos Alexiou and Touradj Ebrahimi, “Towards a point cloud structural similarity metric,” in IEEE ICMEW, 2020, pp. 1–6.
- [13] Y. Nehmé, F. Dupont, J. P. Farrugia, P. Le Callet, and G. Lavoué, “Visual quality of 3d meshes with diffuse colors in virtual reality: Subjective and objective evaluation,” IEEE TVCG, vol. 27, no. 3, 2021.
- [14] Zicheng Zhang, Wei Sun, Xiongkuo Min, Tao Wang, Wei Lu, and Guangtao Zhai, “No-reference quality assessment for 3d colored point cloud and mesh models,” IEEE TCSVT, 2022.
- [15] Yipeng Liu, Qi Yang, Yiling Xu, and Le Yang, “Point cloud quality assessment: Dataset construction and learning-based no-reference metric,” ACM TOMM, 2022.
- [16] Dihong Tian and Ghassan AlRegib, “Batex3: Bit allocation for progressive transmission of textured 3-d models,” IEEE TCSVT, vol. 18, no. 1, pp. 23–35, 2008.
- [17] Qi Yang, Hao Chen, Zhan Ma, Yiling Xu, Rongjun Tang, and Jun Sun, “Predicting the perceptual quality of point cloud: A 3d-to-2d projection-based exploration,” IEEE TMM, 2020.
- [18] Zicheng Zhang, Yingjie Zhou, Wei Sun, Xiongkuo Min, and Guangtao Zhai, “Perceptual quality assessment for digital human heads,” IEEE ICASSP, 2022.
- [19] D Graziosi, O Nakagami, S Kuma, A Zaghetto, T Suzuki, and A Tabatabai, “An overview of ongoing point cloud compression standardization activities: Video-based (v-pcc) and geometry-based (g-pcc),” APSIPA TSIP, vol. 9, 2020.
- [20] Qi Liu, Honglei Su, Zhengfang Duanmu, Wentao Liu, and Zhou Wang, “Perceptual quality assessment of colored 3d point clouds,” IEEE TVCG, 2022.
- [21] Eric M Torlig, Evangelos Alexiou, Tiago A Fonseca, Ricardo L de Queiroz, and Touradj Ebrahimi, “A novel methodology for quality assessment of voxelized point clouds,” in Applications of Digital Image Processing XLI, 2018.
- [22] Zhou Wang, A.C. Bovik, H.R. Sheikh, and E.P. Simoncelli, “Image quality assessment: from error visibility to structural similarity,” IEEE TIP, vol. 13, no. 4, pp. 600–612, 2004.
- [23] Anish Mittal, Anush Krishna Moorthy, and Alan Conrad Bovik, “No-reference image quality assessment in the spatial domain,” IEEE TIP, vol. 21, no. 12, pp. 4695–4708, 2012.
- [24] Anish Mittal, Rajiv Soundararajan, and Alan C Bovik, “Making a “completely blind” image quality analyzer,” IEEE SPL, vol. 20, no. 3, pp. 209–212, 2012.
- [25] Jochen Antkowiak and et al., “Final report from the video quality experts group on the validation of objective models of video quality assessment march 2000,” 2000.
- [26] Jia Deng, Wei Dong, Richard Socher, Li-Jia Li, Kai Li, and Li Fei-Fei, “Imagenet: A large-scale hierarchical image database,” in IEEE/CVF CVPR, 2009.
- [27] Diederik P Kingma and Jimmy Ba, “Adam: A method for stochastic optimization,” in ICLR, 2015.