Modeling Reliance on XAI Indicating Its Purpose and Attention
Abstract
This study used XAI, which shows its purposes and attention as explanations of its process, and investigated how these explanations affect human trust in and use of AI. In this study, we generated heat maps indicating AI attention, conducted Experiment 1 to confirm the validity of the interpretability of the heat maps, and conducted Experiment 2 to investigate the effects of the purpose and heat maps in terms of reliance (depending on AI) and compliance (accepting answers of AI). The results of structural equation modeling (SEM) analyses showed that (1) displaying the purpose of AI positively and negatively influenced trust depending on the types of AI usage, reliance or compliance, and task difficulty, (2) just displaying the heat maps negatively influenced trust in a more difficult task, and (3) the heat maps positively influenced trust according to their interpretability in a more difficult task.
Keywords: AI; XAI; Purpose; Attention; Heat map; Reliance; Compliance; Algorithm aversion; Trust; Structural equation modeling (SEM)
Introduction
In recent years, artificial intelligence (AI) has been entering all aspects of life. In the future, many human activities are expected to be performed with AI. Successful cooperation with AI requires human users to appropriately adjust their use of AI Lee & See (2004). A fundamental factor used to decide the levels at which to use AI is considered to be trust in AI Lee & See (2004); Wiegmann et al. (2001). Trust is defined as “the attitude that an agent will help achieve an individual’s goals in a situation characterized by uncertainty and vulnerability” Lee & See (2004). Proper use of AI is achieved when trust is appropriately calibrated to its actual reliability and maximizes task performance. This process is called trust calibration.
Moreover, even though AI has apparently superior reliability, people avoid using it. This phenomenon is also known as algorithm aversion Dietvorst et al. (2015). Algorithm aversion is defined as “a behavior of discounting algorithmic decisions with respect to one’s own decisions or other’s decisions.” Mahmud et al. (2021). One of the factors causing algorithm aversion is considered to be the black-box nature of AI, that is, its lack of transparency Glikson & Woolley (2009); Mahmud et al. (2021). This problem is considered to be improved by providing explanations about AI algorithms, which would help people understand the underlying rationale behind AI performance Kayande et al. (2009).
Recently, explainable AI (XAI) has been developed for making AI processes and outputs more understandable to humans by providing explanations about them Gunning et al. (2019). XAI might help develop proper trust in AI and inhibit algorithm aversion. This study investigated how people develop trust and decide to use AI that shows its purposes and attention as explanations.
Related Work
Trust in AI and algorithm aversion
Many studies have investigated trust in AI in accordance with its performance. Basically, people increase their trust and use of AI when AI shows high performance and decrease them when AI shows errors Lee & Moray (1992); Wiegmann et al. (2001). However, people are generally sensitive to AI errors and less tolerable of them, and therefore, even less severe AI errors cause extreme under-trust Dzindolet et al. (2002) and algorithm aversion Dietvorst et al. (2015).
Useful ways of avoiding extreme under-trust and algorithm aversion because of AI errors include displaying reasons why AI causes certain errors Dzindolet et al. (2002), showing how AI algorithms can work Kayande et al. (2009), and providing user training on understanding AI algorithms and errors Araujo et al. (2020); Bahner et al. (2008). These studies showed that making AI algorithms transparent by providing explanations about the algorithms improves trust calibration and inhibits algorithm aversion.
Moreover, human emotion has been considered an important factor affecting trust in and use of AI. Emotional trust, such as feeling secure, comfortable, and content, has been investigated and distinguished from cognitive trust, that is, people’s rational expectation that AI has the capability to perform well Komiak & Benbasat (2006); Zhang et al. (2021). Increasing the tangibility or anthropomorphism of AI could avoid an inappropriate decrease in emotional trust Glikson & Woolley (2009).
XAI
In recent years, various studies have focused on XAI. While the structures of explanations have variations including decision-trees, rules, classifiers, and saliency maps, different algorithms have been developed for each structured explanation. Gunning et al. (2021).
At the beginning of XAI research, LIME Ribeiro et al. (2016) effectively demonstrated the importance of XAI and presented concrete XAI algorithms for classification learning. Since then, a major approach for XAI has been to indicate important features, including SHAP Lundberg & Lee (2017) and influence functions Koh & Liang (2017), and to reevaluate the transparency of machine learning algorithms Rudin (2019).
The most popular approach in XAI for CNN-based image recognition is Grad-CAM Selvaraju et al. (2017) to analyze CNN models and generate heat maps indicating important features (attention) in an original image. This approach is also called attention-based XAI. However, this XAI has disadvantages in that humans have much difficulty interpreting how AI recognizes an image with only heat maps.
To overcome the limitation of attention-based XAI, novel studies on XAI done to focus on human cognitive processes, including purposes and interpretation, are beginning because the final target of XAI is to generate good explanations with which humans can understand an AI well. CX-ToM Akula et al. (2022) provides dialogue-based explanations instead of heat maps to explain CNN learning models. Theory of mind (ToM) is a key concept for generating the explanations.
Sanneman and Shah Sanneman & Shah (2022) proposed introducing situation awareness for designing and evaluating XAI systems. Their assertion is that XAI systems and explanations should be designed and evaluated significantly depending on the situation, task, and context.
Hypotheses
This study investigated how the purposes and attention of AI influence trust and use of AI. A hypothetical model is shown in Figure 1. First, this study considers two different types of AI usage: reliance and compliance. In this study, reliance was defined as dependence on AI, such as delegating a task to an AI, and compliance was defined as acceptance of AI outputs, such as following the answers of an AI, as extended definitions from the previous studies Kohn et al. (2021); Vereschak et al. (2021).
Next, regarding the purpose of AI, humans’ understanding of AI purposes plays an important role in developing trust in and using an AI Akula et al. (2022). Since “goals” or “intentions” are major components for ToM, the purposes of AI are expected to be a significant factor that increases cognitive and emotional trust (H1).
Moreover, regarding AI attention, there are studies that found positive relationships between human interpretability of AI attention and trustworthy AI Sanneman & Shah (2022); Tomsett et al. (2020). Therefore, there is a possibility that just displaying AI attention would not influence cognitive and emotional trust (H2); however, higher interpretability for AI attention is assumed to increase cognitive and emotional trust (H3). The hypotheses are summarized as follows.

-
H1: Displaying the purpose of AI positively influences cognitive and emotional trust.
-
H2: Displaying AI attention does not influence cognitive and emotional trust.
-
H3: The interpretability of AI attention positively influences cognitive and emotional trust.
In the following, first, we generated heat maps indicating AI attention. Next, we conducted Experiment 1 to confirm the validity of the interpretability of the heat maps. Finally, we conducted Experiment 2 to test the hypotheses using the validated heat maps.
Heat Maps Indicating AI Attention
First, we prepared two different types of image datasets, body-shape and human facial images, to conduct obesity screening and drowsiness detection in the following experiment. The body-shape images were used from a body-shape database Moussally et al. (2016), and the human facial images were used from a drowsiness dataset Ghoddoosian et al. (2019). We chose these experimental tasks because they were related to realistic healthcare problems.
Next, we prepared deep-learning models to generate AI attention with Grad-CAM Selvaraju et al. (2017) (Grad-CAM with PyTorch 17-05-18 https://github.com/kazuto1011/grad-cam-pytorch). A simple model composed of a four-layer convolutional neural network and two-layer perception was used for the obesity screening. Table 1 shows the structure of the model. Grad-CAM visualized the attention of the conv_2 layer. The model for the drowsiness detection was Inception-ResNet Szegedy et al. (2017), which is commonly used for face recognition An et al. (2018); Peng et al. (2020). Grad-CAM referred to the Inception-ResNet-B block of the model for attention visualization.
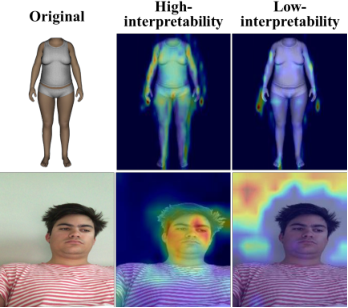
Moreover, we developed high- and low-interpretability models for each task. To manipulate the interpretability of AI attention, we biased the training datasets and initial weights of the models. For the high-interpretability models, we removed the backgrounds of the images in the preprocessing because we found that the models overfit the dataset by focusing on marginal information, which was expected to lead to low interpretability for our tasks. In addition, the high-interpretability model for the drowsiness detection was initialized with parameters pretrained with VGGFace2 Cao et al. (2018), a dataset for face recognition, and trained in a transfer learning manner Tan et al. (2018). The original images and the heat maps with high and low interpretability are shown in Figure 2.
| Layer name | Output size | Parameters |
| Input | (3, 160, 160) | |
| conv_1 | (8, 77, 77) | , |
| BatchNorm, ReLU, MaxPool | (8, 25, 25) | |
| conv_2 | (8, 23, 23) | , |
| BatchNorm, ReLU, MaxPool | (8, 7, 7) | |
| conv_3 | (8, 5, 5) | , |
| BatchNorm, ReLU, Flatten | (200) | |
| Linear, ReLU | (128) | |
| Linear, ReLU | (2) |
Experiment 1
An online experiment system
One-hundred heat maps created by each high- and low-interpretability model were selected by an experimenter for the obesity screening and drowsiness detection tasks. Each participant evaluated the 100 heat maps. To evaluate the maps, the GUI for the XAI in the online experiment system, in particular, the layout of the original image and the corresponding heat map, was designed on the basis of previous work M. Lu et al. (2019); Rajaraman et al. (2020); Wehbe et al. (2021). Actually, the original image and the heat map were simply located side by side.
Method
Experimental design and participants
The experiment had a two-factor between-participants design. The factors were the interpretability (high and low) and the task (obesity screening and drowsiness detection). A priori power analysis with G*Power indicated that 128 participants were needed for a medium effect size () with the power at .80 and alpha at .05 Faul et al. (2007). A total of 200 participants were recruited through a cloud-sourcing service provided by Yahoo! Japan. They were randomly assigned to one of the conditions and conducted a task. However, 71 participants were detected as inattentive by the attention check items of the Directed Questions Scale (DQS) Maniaci & Rogge (2014) and were excluded from the analysis. As a result, data of 129 participants (88 male and 41 female from 16 to 78 y/o, , ) were used.
Procedure
The participants first agreed with the informed consent and read the explanations of the experiment. In particular, the heat map was explained as indicating AI attention when the AI screened for obesity or detected drowsiness. After that, they evaluated 100 heat maps in accordance with their conditions. The order of the heat maps was randomized. During the evaluation, the participants were asked “how much can you interpret how the AI screened for obesity (or detected drowsiness) based on the heat map of AI attention?” and evaluated the interpretability on a 5-point scale (1: not interpretable at all - 5: extremely interpretable). Right after the evaluation, they were required to answer whether the body shape was normal or obese in the obesity screening or whether the person was awake or drowsy in the drowsiness detection task.
Results and discussion
Interpretability score
First, the mean interpretability score of each heat map was calculated. On the basis of the score, 50 high-scored heat maps in the high- and 50 low-scored heat maps in the low-interpretability conditions were selected for each task. Next, using the 50 heat maps in each condition, the mean interpretability score of each participant was calculated, and an ANOVA was performed on the score (Figure 4). There was a significant interaction , and significant simple main effects showed that the score was higher for the high-interpretability condition than for the low one in the obesity screening and in the drowsiness detection task . From these results, we confirmed 50 heat maps with validated high and low interpretability in both tasks.
Task analysis
Using the 50 heat maps selected in each condition, the mean accuracy rate of each participant was calculated. Also, the mean of the accuracy rate of each AI model, indicated when the heat maps were created in the previous section, was calculated (Figure 4). First, as a result of an ANOVA on the mean accuracy rate of the participants in the four conditions, there was a significant main effect on the task factor showing that the rate was higher in the obesity screening than in the drowsiness detections task . Also, the results of one-sample t-tests showed that the rates of the participants were significantly greater than those of the AI in all the conditions . Statistical powers of higher than .80 were assured through post-hoc power analyses with G*Power. From these results, we confirmed that the obesity screening task was easier for the humans. Also, the humans performed better than the AI in all conditions.


Experiment 2
Experimantal task
This task was conducted using the original images and heat maps selected in Experiment 1. The experimental factors in this experiment were the usage-type (reliance and compliance), the purpose (with and without purpose), the attention-interpretability (high-, low-, and no-interpretability), and the task (obesity screening and drowsiness detection).
First, regarding the usage-type factor, the task procedures were set up according to the previous studies Kohn et al. (2021); Vereschak et al. (2021) (Figure 5). The procedure for reliance was as follows: (1) An original image was displayed at the center of the display as a screening (or detection) problem for 5 seconds. (2) The participant decided to depend on the AI or themselves for the obesity screening (or drowsiness detection) by clicking. (3)a If the participant decided to depend on the AI, the AI showed its answer with a heat map (or without it). (3)b If the participant decided to depend on themselves, they answered whether the body shape was normal or obese in the obesity screening (or whether the person is awake or drowsy in the drowsiness detection) by clicking.
Also, the procedure for compliance was as follows: (1) An original image was displayed at the center of the display as a screening (or detection) problem for 5 seconds. (2) The AI showed its answer with a heat map (or without it). (3) The participant decided to accept or reject the answer by clicking.

Moreover, regarding the purpose factor, in the with-purpose condition, the AI purpose stayed displayed on the bottom of the display during the task, stating “the purpose of this AI is to screen for obesity based on body shape for healthcare counseling” for the obesity screening and “the purpose of this AI is to detect a state of fatigue based on expressions of drowsiness for healthcare counseling” for the drowsiness detection. In comparison, in the without-purpose condition, there was no display of the purposes.
Furthermore, regarding the attention-interpretability factor, the heat maps with high and low interpretability selected in Experiment 1 were respectively used for the high- and low-interpretability conditions in both tasks. The accuracy rates of the AI models were reflected in the answers during the task. Also, in the no-interpretability condition, there was no display of the heat maps, and the AI model for high or low interpretability was randomly assigned.
In addition, the participants were required to achieve as many correct answers as possible. Also, the partner AI was explained as learning from their answers and becoming smarter. This description was added to make participants feel that the AI was more realistic.
Method
Experimental design and participants
The experiment had a four-factor between-participants design. A total of 250 participants were recruited through a cloud-sourcing service provided by Yahoo! Japan. They were randomly assigned to one of the conditions and conducted a task. However, 20 participants were detected as inattentive by DQS and were excluded from the analysis. Also, 21 participants who showed exceptional behaviors, explained later, were excluded from the analysis. As a result, data of 209 participants (155 male and 54 female from 19 to 76 y/o, , ) were used.
Procedure
The participants first agreed with the informed consent and read the explanations about the task procedure. After that, they started the task. Each participant answered regarding the original image 50 times. The order of the images was randomized. During the task, after every 10 problems, they answered two types of trust questionnaires to measure cognitive and emotional trust.
To measure cognitive trust, the Multi-Dimensional Measure of Trust (MDMT) Ullman & Malle (2019) was used. MDMT was developed to measure a task partner’s reliability and competence corresponding to the definition of cognitive trust. The participants rated how much the partner AI fit each word (reliable, predictable, dependable, consistent, competent, skilled, capable, and meticulous) on an 8-point scale (0: not at all - 7: very). Moreover, for emotional trust, we asked participants to answer how much the partner AI fit each word (secure, comfortable, and content) on a 7-point scale (1: strongly disagree - 7: strongly agree) as in the previous study Komiak & Benbasat (2006).
In addition, in MDMT, participants could choose “does not fit,” which prevented possibly meaningless ratings. Twenty-one participants who chose it for all 8 words at the same time at least once during the task were considered to display exceptional behaviors and eliminated from the analysis.
Results
SEM analyses
First, the data sets were prepared on the basis of the variables of the hypothetical model. For the usage-type (reliance and compliance) variable, the mean reliance or compliance rate was calculated every 10 problems. Next, for the purpose variable, the with- and without-purpose conditions were respectively represented using “1” and “0” as dummy variables. Also, for the attention-display variable, the high- and low-interpretability conditions were represented using “1” and the no-interpretability condition using “0” as dummy variables. Moreover, for the attention-interpretability variable, the interpretability score rated in Experiment 1 was used as a representative value of a heat map. The mean interpretability score was calculated in accordance with the displayed heat maps every 10 problems. Also, for the no-interpretability condition, “0” was used since there was no interpretability. Finally, the cognitive and emotional trust variables were treated as latent variables based on rated scores after every 10 problems.

As a result, 5 data sets of each variable were created from each participant. However, there were 12 participants who rated “does not fit” at least once on the MDMT, so the corresponding data set was eliminated. Using the data sets, first, we developed reliance and compliance models for the obesity screening and drowsiness detection tasks on the basis of the hypothetical model. However, none of the models fit the data well.
Next, we modified the models by making a path from cognitive to emotional trust as in the previous study Komiak & Benbasat (2006). Also, we added the AI reliability variable, the mean accuracy rate of the AI every 10 problems, to make the path to cognitive and emotional trust. The modified models were fitted using robust maximum likelihood estimation Rosseel (2012). As a result, all the models fit the data well, and the goodness-of-fit values met the criteria Kline (2011). Figure 6 shows the modified models and goodness-of-fit values. Statistical power analyses with R software with alpha at .05 revealed that the SEM performed with sample sizes ( and 274 for reliance and compliance models of the obesity screening, and 250 and 259 for reliance and compliance models of the drowsiness detection) for exact-fit tests obtained powers of .96, .98, .96, and .97, showing satisfactory statistical powers.
Hypothesis survey
Regarding H1, which is related to AI purpose, there was a positive influence from the AI purpose on cognitive trust for the compliance model in the obesity screening task. Also, there was a negative influence from the purpose on cognitive trust for the reliance model in the drowsiness detection task. Therefore, H1 was partially supported only for the compliance model in the obesity screening task.
Next, regarding H2, which is related to AI-attention display, there was a negative influence from the AI-attention display on emotional trust for the reliance model in the obesity screening task. Also, there were negative influences from the AI-attention display on cognitive and emotional trust for the compliance model in the drowsiness detection task. Therefore, H2 was supported for the reliance and compliance models in the obesity screening task and for the reliance model in the drowsiness detection task.
Finally, regarding H3, which is related to AI-attention interpretability, there was a positive influence from the interpretability of AI attention on emotional trust for the reliance model in the obesity screening task. Also, there were positive influences from the interpretability of AI attention on cognitive and emotional trust for the compliance model in the drowsiness detection task. Therefore, H3 was only supported for the compliance model and partially supported for the reliance model in the drowsiness detection task.
General Discussion
First of all, the obesity screening was easier than the drowsiness detection for the humans as in Experiment 1. Therefore, AI reliability was considered to be perceived more easily in the obesity screening than in the drowsiness detection. Consistent results were observed in SEM. On the basis of this assumption, we discuss the results.
Regarding H1, in the compliance procedure, the participants could observe all the answers of the AI, but in the reliance procedure, they could not when they answered by themselves. Since people tend to develop positive attitudes toward AI when accessing information on AI performance is easy Kayande et al. (2009), in a situation where the task is easy, as in the case of the obesity screening, and the AI performance is always observable, people might positively accept the purpose. Contrarily, in a situation where the task is less easy, as in the case of drowsiness detection, and the AI performance is not always observable, the participants might develop a negative attitude toward the AI and have doubts about the purpose or feel that it is uninterpretable.
Moreover, regarding H2, there were negative effects from displaying AI attention in the drowsiness detection task. People have a tendency to look for justification when they receive answers or decisions from AI J. Lu et al. (2017). However, in the obesity screening task, the participants might not have needed to pay very much attention to the heat maps as justification because the reliability of the AI could be easily perceived. In comparison, in the drowsiness detection task, since the reliability of the AI seemed more difficult to perceive, participants were considered to pay more attention to the heat maps as justification. However, there were heat maps with low interpretability in accordance with the experimental conditions, and thus, the participants who saw the low-interpretability heat maps might have greatly decreased trust. The same phenomenon was also found in a previous study where people distrusted the AI when they did not perceive the rationale of the AI Goodwin et al. (2013).
Furthermore, regarding H3, as above, in the obese screening task, the participants were considered to not pay very much attention to the heat maps. Therefore, there was no effect found from the attention interpretability. However, in the drowsiness detection task, the attention interpretability especially increased emotional trust. Emotional trust is known to be increased by anthropomorphism and human-like behaviors Glikson & Woolley (2009). There is a possibility that the heat maps with high interpretability in the drowsiness detection task might have made participants feel that the AI had human-like behaviors and increased their emotional trust.
Finally, there were negative influences from cognitive trust on reliance and compliance in the drowsiness detection task. In this study, the task AI was explained as learning from the participants’ answers and becoming smarter. There is a possibility that the participants who had higher cognitive trust in the drowsiness detection, a high difficulty task, might have tended to have the partner AI learn more to become smarter.
Conclusion
This study investigated how explanations of AI affect human trust in and use of AI, using XAI, which shows its purposes and attention as explanations. We generated high- and low-interpretability heat maps showing AI attention, conducted Experiment 1 to confirm their interpretability, and performed Experiment 2 to investigate the effects of the purposes and attention of AI. SEM analyses revealed that (1) displaying the purpose of AI positively influenced trust when the participants complied with AI in an easier task and negatively influenced trust when they relied on AI in a more difficult task, (2) just displaying the heat maps negatively influenced trust when the participants in a more difficult task, and (3) the heat maps positively influenced trust according to their interpretability in a more difficult task.
References
- Akula et al. ((2022)) Akula, A.R., Wang, K., i Saba-Sadiya, C., Lu, H., Todorovic, S., Chai, J. & Zhu, S-C. (2022). CX-ToM: Counterfactual explanations with theory-of-mind for enhancing human trust in image recognition models. iScience 25 1 103581. doi:10.1016/j.isci.2021.103581
- An et al. ((2018)) An, Z., Deng, W., Yuan, T. & Hu, J. (2018). Deep transfer network with 3d morphable models for face recognition. In 2018 13th ieee international conference on automatic face & gesture recognition (FG 2018) ( 416–422). doi:10.1109/FG.2018.00067
- Araujo et al. ((2020)) Araujo, T., Helberger, N., Kruikemeier, S. & de Vreese, C.H. (2020). In AI we trust? perceptions about automated decision-making by artificial intelligence. AI&SOCIETY 35 3 611–623. doi:10.1007/s00146-019-00931-w
- Bahner et al. ((2008)) Bahner, J.E., Hüper, A-D. & Manzey, D. (2008). Misuse of automated decision aids: Complacency, automation bias and the impact of training experience. International Journal of Human-Computer Studies 66 9 688–699. doi:10.1016/j.ijhcs.2008.06.001
- Cao et al. ((2018)) Cao, Q., Shen, L., Xie, W., Parkhi, O.M. & Zisserman, A. (2018). VGGFace2: A dataset for recognising faces across pose and age. In International conference on automatic face and gesture recognition.
- Dietvorst et al. ((2015)) Dietvorst, B.J., Simmons, J.P. & Massey, C. (2015). Algorithm aversion: People erroneously avoid algorithms after seeing them err. Journal of Experimental Psychology: General 144 1 114–126. doi:10.1037/xge0000033
- Dzindolet et al. ((2002)) Dzindolet, M.T., Pierce, L.G., Beck, H.P. & Dawe, L.A. (2002). The perceived utility of human and automated aids in a visual detection task. Human Factors 44 1 79–94. doi:https://doi.org/10.1518/0018720024494856
- Faul et al. ((2007)) Faul, F., Erdfelder, E., Lang, A-G. & Buchner, A. (2007). G*power 3: A flexible statistical power analysis program for the social, behavioral, and biomedical sciences. Behavior Research Methods 39 2 175–191. doi:10.3758/bf03193146
- Ghoddoosian et al. ((2019)) Ghoddoosian, R., Galib, M. & Athitsos, V. (2019). A realistic dataset and baseline temporal model for early drowsiness detection. In 2019 IEEE/CVF conference on computer vision and pattern recognition workshops (CVPRW) ( 178–187). doi:10.1109/cvprw.2019.00027
- Glikson & Woolley ((2009)) Glikson, E. & Woolley, A.W. (2009). Human trust in artificial intelligence: Review of empirical research. Academy of Management Annals 14 2 627–660. doi:10.5465/annals.2018.0057
- Goodwin et al. ((2013)) Goodwin, P., Sinan, G.M. & Önkal, D. (2013). Antecedents and effects of trust in forecasting advice. International Journal of Forecasting 29 2 354-366. doi:10.1016/j.ijforecast.2012.08.001
- Gunning et al. ((2019)) Gunning, D., Stefik, M., Choi, J., Miller, T., Stumpf, S. & Yang, G.Z. (2019). XAI–Explainable artificial intelligence. Science Robotics 4 37 . doi:10.1126/scirobotics.aay7120
- Gunning et al. ((2021)) Gunning, D., Vorm, E., Wang, J.Y. & Turek, M. (2021). DARPA’s explainable AI (XAI) program: A retrospective. Applied AI Letters 2 4 . doi:10.1002/ail2.61
- Kayande et al. ((2009)) Kayande, U., Bruyn, A.D., Lilien, G.L., Rangaswamy, A. & van Bruggen, G.H. (2009). How incorporating feedback mechanisms in a DSS affects DSS evaluations. Information Systems Research 20 4 527–546. doi:10.1287/isre.1080.0198
- Kline ((2011)) Kline, R.B. (2011). Principles and practice of structural equation modeling (3rd ed.). : Guilford Press.
- Koh & Liang ((2017)) Koh, P.W. & Liang, P. (2017). Understanding black-box predictions via influence functions. In Proceedings of the 34th international conference on machine learning (ICML2017) ( 1885–1894). http://proceedings.mlr.press/v70/koh17a.html
- Kohn et al. ((2021)) Kohn, S.C., de Visser, E.J., Wiese, E., Lee, Y-C. & Shaw, T.H. (2021). Measurement of trust in automation: A narrative review and reference guide. Frontiers in Psychology 12 . doi:10.3389/fpsyg.2021.604977
- Komiak & Benbasat ((2006)) Komiak & Benbasat. (2006). The effects of personalization and familiarity on trust and adoption of recommendation agents. MIS Quarterly 30 4 941. doi:10.2307/25148760
- Lee & Moray ((1992)) Lee, J. & Moray, N. (1992). Trust, control strategies and allocation of function in human-machine systems. Ergonomics 35 10 1243–1270. doi:10.1080/00140139208967392
- Lee & See ((2004)) Lee, J. & See, K. (2004). Trust in automation: Designing for appropriate reliance. Human Factors 46 1 50–80. doi:https://doi.org/10.1518/hfes.46.1.50_30392
- J. Lu et al. ((2017)) Lu, J., Liang, Y. & Duan, H. (2017). Justifying decisions. Social Psychology 48 2 92–103. doi:10.1027/1864-9335/a000302
- M. Lu et al. ((2019)) Lu, M., Ivanov, A., Mayrhofer, T., Hosny, A., Aerts, H.J.W.L. & Hoffmann, U. (2019). Deep learning to assess long-term mortality from chest radiographs. JAMA Network Open 2 7 e197416.
- Lundberg & Lee ((2017)) Lundberg, S.M. & Lee, S-I. (2017). A unified approach to interpreting model predictions. In Advances in Neural Information Processing Systems ( 30).
- Mahmud et al. ((2021)) Mahmud, H., Islam, A.N., Ahmed, S.I. & Smolander, K. (2021). What influences algorithmic decision-making? a systematic literature review on algorithm aversion. Technological Forecasting and Social Change 175 121390. doi:10.1016/j.techfore.2021.121390
- Maniaci & Rogge ((2014)) Maniaci, M.R. & Rogge, R.D. (2014). Caring about carelessness: Participant inattention and its effects on research. Journal of Research in Personality 48 61–83. doi:10.1016/j.jrp.2013.09.008
- Moussally et al. ((2016)) Moussally, J.M., Rochat, L., Posada, A. & der Linden, M.V. (2016). A database of body-only computer-generated pictures of women for body-image studies: Development and preliminary validation. Behavior Research Methods 49 1 172–183. doi:10.3758/s13428-016-0703-7
- Peng et al. ((2020)) Peng, S., Huang, H., Chen, W., Zhang, L. & Fang, W. (2020). More trainable inception-resnet for face recognition. Neurocomputing 411 9-19.
- Rajaraman et al. ((2020)) Rajaraman, S., Siegelman, J., Alderson, P.O., Folio, L.S., Folio, L.R. & Antani, S.K. (2020). Iteratively pruned deep learning ensembles for COVID-19 detection in chest X-rays. IEEE Access 8 115041–115050.
- Ribeiro et al. ((2016)) Ribeiro, M.T., Singh, S. & Guestrin, C. (2016). ”why should i trust you?”: Explaining the predictions of any classifier. In Proceedings of the 22nd ACM SIGKDD international conference on knowledge discovery and data mining ( 1135–1144). : ACM. [2017-06-01]http://doi.acm.org/10.1145/2939672.2939778 doi:10.1145/2939672.2939778
- Rosseel ((2012)) Rosseel, Y. (2012). lavaan: An r package for structural equation modeling. Journal of Statistical Software 48 2 . doi:10.18637/jss.v048.i02
- Rudin ((2019)) Rudin, C. (2019). Stop explaining black box machine learning models for high stakes decisions and use interpretable models instead. Nature Machine Intelligence 1 5 206–215. doi:10.1038/s42256-019-0048-x
- Sanneman & Shah ((2022)) Sanneman, L. & Shah, J.A. (2022). The situation awareness framework for explainable AI (SAFE-AI) and human factors considerations for XAI systems. International Journal of Human–Computer Interaction 38 18-20 1772–1788.
- Selvaraju et al. ((2017)) Selvaraju, R.R., Cogswell, M., Das, A., Vedantam, R., Parikh, D. & Batra, D. (2017). Grad-CAM: Visual explanations from deep networks via gradient-based localization. In 2017 IEEE International Conference on Computer Vision (ICCV2017). doi:10.1109/iccv.2017.74
- Szegedy et al. ((2017)) Szegedy, C., Ioffe, S., Vanhoucke, V. & Alemi, A.A. (2017). Inception-v4, inception-resnet and the impact of residual connections on learning. In Proceedings of the Thirty-First AAAI Conference on Artificial Intelligence (AAAI’17) ( 4278–4284).
- Tan et al. ((2018)) Tan, C., Sun, F., Kong, T., Zhang, W., Yang, C. & Liu, C. (2018). A survey on deep transfer learning. In International conference on artificial neural networks ( 270–279).
- Tomsett et al. ((2020)) Tomsett, R., Preece, A., Braines, D., Cerutti, F., Chakraborty, S., Srivastava, M.Kaplan, L. (2020). Rapid trust calibration through interpretable and uncertainty-aware AI. Patterns 1 4 100049. doi:10.1016/j.patter.2020.100049
- Ullman & Malle ((2019)) Ullman, D. & Malle, B.F. (2019). Measuring gains and losses in human-robot trust: Evidence for differentiable components of trust. In Proceedings of the 14th ACM/IEEE International Conference on Human-Robot Interaction ( 618–619). doi:10.1109/HRI.2019.8673154
- Vereschak et al. ((2021)) Vereschak, O., Bailly, G. & Caramiaux, B. (2021). How to evaluate trust in AI-assisted decision making? a survey of empirical methodologies. Proceedings of the ACM on Human-Computer Interaction 5 CSCW2 327–338. doi:10.1145/3476068
- Wehbe et al. ((2021)) Wehbe, R.M., Sheng, J., Dutta, S., Chai, S., Dravid, A., Barutcu, S.Katsaggelos, A.K. (2021). DeepCOVID-XR: An artificial intelligence algorithm to detect COVID-19 on chest radiographs trained and tested on a large U.S. clinical data set. Radiology 299 1 E167–E176. doi:10.1148/radiol.2020203511
- Wiegmann et al. ((2001)) Wiegmann, D.A., Rich, A. & Zhang, H. (2001). Automated diagnostic aids: The effects of aid reliability on users’ trust and reliance. Theoretical Issues in Ergonomics Science 2 4 352–367. doi:https://doi.org/10.1080/14639220110110306
- Zhang et al. ((2021)) Zhang, Q., Yang, X.J. & Robert, Lionel Jr. (2021). From the head or the heart? an experimental design on the impact of explanation on cognitive and affective trust. In 2021 AAAI Fall Symposium. doi:10.7302/3294