The Venus’ Cloud Discontinuity in 2022
Abstract
Context. First identified in 2016 by the Japan Aerospace eXploration Agency (JAXA) Akatsuki mission, the discontinuity/disruption is a recurrent wave observed to propagate during decades at the deeper clouds of Venus (47–56 km above the surface), while its absence at the clouds’ top (70 km) suggests that it dissipates at the upper clouds and contributes in the maintenance of the puzzling atmospheric superrotation of Venus through wave-mean flow interaction.
Aims. Taking advantage of the campaign of ground-based observations undertaken in coordination with the Akatsuki mission since December 2021 until July 2022, we aimed to undertake the longest uninterrupted monitoring of the cloud discontinuity up to date to obtain a pioneering long-term characterization of its main properties and better constrain its recurrence and lifetime.
Methods. The dayside upper, middle and nightside lower clouds were studied with images with suitable filters acquired by Akatsuki’s Ultraviolet Imager (UVI), amateur observers and SpeX at NASA’s Infrared Telescope Facility (IRTF). Hundreds of images were inspected in search of the discontinuity events and to measure key properties like its dimensions, orientation or rotation period.
Results. We succeeded in tracking the discontinuity at the middle clouds during 109 days without interruption. The discontinuity exhibited properties nearly identical to measurements in 2016 and 2020, with an orientation of , length/width of / km and a rotation period of days. Ultraviolet images during 13-14 June 2022 suggest that the discontinuity may have manifested at the top of the clouds during 21 hours as a result of an altitude change in the critical level for this wave due to slower zonal winds.
Key Words.
planets and satellites: terrestrial planets, planets and satellites: atmospheres, waves, methods: data analysis1 Introduction
From the surface up to 90 km. the general circulation of the Venus’s atmosphere is dominated by a retrograde zonal superrotation whose speeds peak at the region of the clouds (45–70 km). Nevertheless, key aspects about its generation and maintenance are yet poorly understood (Sánchez-Lavega et al. 2017) and present general circulation models (h.a. CGMs) yet fail to accurately reproduce it (Lebonnois et al. 2013; Navarro et al. 2021). Recent works have provided new and solid evidences of the importance of planetary-scale waves at the upper clouds like the so-called Y-feature (Boyer & Camichel 1961; Kouyama et al. 2012; Peralta et al. 2015) or the solar tides excited at the level in maintaining the superrotation (Kouyama et al. 2015; Kouyama et al. 2019; Horinouchi et al. 2020; Fukuya et al. 2021). Besides, the waves excited below the clouds have been in the spotlight during the last years too, thanks to recent reports about new waves discovered by the ongoing JAXA’s Akatsuki mission (Nakamura et al. 2016) and earlier ESA’s Venus Express (Svedhem et al. 2007). Numerous stationary waves excite at the surface have been reported in images of the thermal emission of the upper clouds (Fukuhara et al. 2017; Peralta et al. 2017), 283-nm albedo at the clouds’ top (Kitahara et al. 2019) or near infrared images at 2.02 m (Sato et al. 2020).
Images of Venus sensing the middle and the lower clouds have revealed a disruption or discontinuity on their albedo/opacity (Peralta et al. 2020; Kardasis et al. 2022) linked to dramatic changes on the clouds’ optical thickness and distribution of aerosols (McGouldrick et al. 2021), and shown to be a recurrent atmospheric phenomenon missed for decades. Based on simulations with the Institut Pierre Simon Laplace (IPSL) Venus GCM (Scarica et al. 2019), it has been suggested that the discontinuity may be a new type of Kelvin wave feeding the superrotation with momentum from the deeper atmosphere, while its phase speeds along with its absence in observations of the upper clouds evidenced that this Kelvin wave might find its critical level below the top of the clouds (Peralta et al. 2020; Kardasis et al. 2022). But despite the potential relevance for this new wave, we have not been able to determine key aspects like its source of excitation, the excitation/dissipation heights, the long-term behaviour and its recurrence in the Venus atmosphere.
Taking advantage of an excellent campaign of Venus observations undertaken during the year 2022 with a combined effort from JAXA’s Akatsuki mission (Nakamura et al. 2007; Nakamura et al. 2016), NASA’s Infrared Telescope Facility IRTF (Rayner et al. 2003) and amateur observers, we present the results for a long-term continuous monitoring of the clouds’ discontinuity and the first report of its propagation up to the top of the clouds. A description of the data sets and methods is introduced in section 2, while the results and the discussion about the measured properties of the discontinuity and its manifestation at the top of the clouds can be consulted in section 3. We finish with the main conclusions in section 4.
2 Data sets and Methods
As in previous works (Peralta et al. 2020; Kardasis et al. 2022), we searched for events of the discontinuity in images of Venus sensing the three main layers of the clouds (Titov et al. 2018): the dayside upper clouds (56.5–70 km above the surface) whose albedo at 70 km can be observed with images taken at ultraviolet wavelengths (Ignatiev et al. 2009; Limaye et al. 2018), the dayside middle clouds (50.5–56.5 km) which can be observed at visible and near-infrared wavelengths (Hueso et al. 2015; Peralta et al. 2019a), and the nightside lower clouds (47.5–50.5 km) whose transparency/opacity to the deeper atmospheric thermal emission is observable in infrared atmospheric windows at 1.74, 2.26 and 2.32 m (Satoh et al. 2017; Peralta et al. 2018).
2.1 Images obtained with IRTF/SpeX
The nightside lower clouds of Venus were explored using images of Venus taken from NASA’s IRTF (Mauna Kea, Hawaii) with the guide camera of the instrument SpeX (Rayner et al. 2003) and contK (2.26 ) and 1.74- filters. Our observations11 1 Data available upon reasonable request. covered the following dates: 2021 December 3–19 (12 nights), 2022 January 27–February 23 (23 nights), and 2022 March 5–12 (6 nights). During this period, the phase angle of Venus varied within 140∘–96∘ and the apparent size ranged 52–27 arcsec. Since the plate scale of SpeX is 0.116 arcsec per pixel, the spatial resolution of Venus in these images varied from 42 to 82 km per pixel. As in previous works (Peralta et al. 2019b; Peralta et al. 2020), IRTF/SpeX images were corrected for the saturated dayside, stacked, navigated and processed following the same procedure originally described in detail by Peralta et al. 2018. Unfortunately, an accurate radiometric calibration was not possible due to a persistent problem of light contamination from the saturated dayside of the planet similar to the one affecting images by Akatsuki/IR2 (Satoh et al. 2022).
2.2 Images obtained by amateur observers
To study the presence of the discontinuity on the dayside middle clouds, we used images of Venus acquired by amateur observers located in Italy, Portugal, South Africa, Australia, Estonia and Taiwan. We obtained the images directly from some of the observers or through the Venus section of ALPO-Japan22 2 http://alpo-j.sakura.ne.jp/Latest/Venus.htm (Sato 2018). These consist of stacks of thousands of images acquired during time intervals rarely longer than 5 minutes (Kardasis et al. 2022, see lucky imaging procedure in), and they were captured using small telescopes with diameters typically ranging 203–355 mm, observing at wavelengths nm in all the cases by means of high-pass and band-pass filters (Kardasis et al. 2022, most used filters are detailed in Table 1 of). After a careful selection, we inspected a total of 319 images covering nearly every day since 2022 March 13 until July 31. During this period, the phase angle of Venus varied within 95∘–32∘ and the apparent size ranged 27–11 arcsec. For wavelengths of 700 nm and telescope of 355-mm diameter we would expect a nominal resolution of 0.5 arcsec for each individual image, and 350–860 km per pixel along the mentioned observing period. Since the lucky imaging has been demonstrated superresolution capabilities and improve the resolution up to a factor of four in poor seeing conditions (Farsiu et al. 2004; Law et al. 2006; Sánchez-Lavega et al. 2016; Peralta et al. 2017), we can assume a conservative improvement of a factor of two for the stacked images, implying spatial resolutions within 175–430 km per pixel.
2.3 Images obtained with Akatsuki/UVI and LIR
The level of the upper clouds was studied with images taken by two instruments onboard the Akatsuki orbiter: 365 and 283-nm images by the Ultraviolet Imager (UVI) (Yamazaki et al. 2018) were used to explore the cloud patterns and zonal winds at the top of the dayside upper clouds (70 km) while 10- images by the Longwave Infrared camera (LIR) can sense thermal contrasts within a wider altitude range of 60–75 km (Taguchi et al. 2007) which vary with observed emission angle (Kouyama et al. 2017; Akiba et al. 2021). UVI and LIR data consisted of L2b and L3bx products (Ogohara et al. 2017; Murakami et al. 2019) from the mission internal release33 3 Eventually available via Data ARchives and Transmission System (DARTS) by ISAS/JAXA Center for Science-satellite Operation and Data Archive (C-SODA), and NASA PDS Atmospheres Node. v20220901, and the images matched the same observing period as for the middle clouds with amateur observations. The imagery data set finally selected covered from 2022 April 15 until July 30 (Akatsuki orbits 212–221), with the spatial resolution at lower latitudes of Venus varying 75–10 km per pixel in UVI images and 320–40 km per pixel in LIR images. We explored a total of 928 365-nm UVI images (similar number of 283-nm images) and 623 LIR images, although in the latter case we only examined LIR images acquired during events of the discontinuity (see subsection 3.1).

2.4 Measurement of speeds
Prior to measurements, all the images were geometrically projected onto an equirectangular (cylindrical) geometry with an angular resolution equivalent to the best resolution in the original images. To measure winds and the phase speed of the discontinuity, we applied the manual method by Sánchez-Lavega et al. 2016 and another technique consisting on a manual search of cloud tracers followed by a fine adjustment using automatic template matching based on phase correlation, which is visually accepted or rejected by a human operator (Peralta et al. 2018, subsection 2.3).
Towards a more accurate characterization of the difference between the discontinuity phase speed and zonal winds (Peralta et al. 2020; Kardasis et al. 2022), the phase speed of the discontinuity was measured by comparing its position after one or two full revolutions around the Venus globe, allowing to achieve an accuracy of 0.2–2.7 ms-1. Concerning the measurement of wind speeds at the nightside lower clouds, we combined pairs of stacked images from SpeX typically separated by 90–155 minutes which enabled us to infer winds with errors within 3–8 ms-1. In the case of the UVI 365-nm images, we obtained wind speeds with errors ranging 2–11 ms-1 by considering pairs of images acquired when Akatsuki approached/receded its orbital pericenter or when cloud tracers could be tracked during 3–5 hours. We excluded our wind measurements for dayside middle clouds since the worse spatial resolution of amateur images generally precluded speeds with errors below 40 ms-1. The speeds in section 3 were calculated as the mean and standard deviation for speeds of individual tracers between 30∘N–30∘S.
3 Results
3.1 Properties of the discontinuity
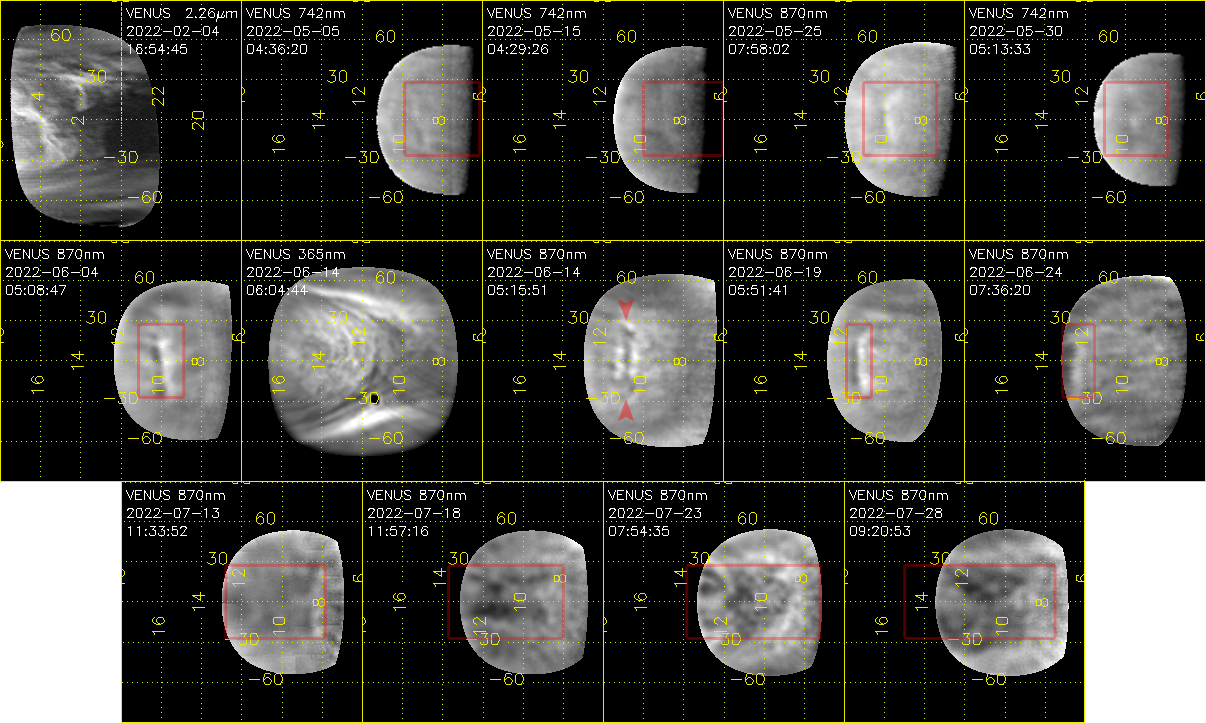
We observed the nightside lower clouds of Venus between 2021 December 3 and 2022 March 12, while the dayside clouds were studied between 2022 March 13 and July 31. Table 1 describes the discontinuity events identified during these campaigns, while Figs. 1 and 4 exhibit images of these events. Despite the number of observations with IRTF/SpeX between December 2021 until March 2022, only one positive event was confirmed with the clouds’ discontinuity with a length/width of / km, an orientation of , and propagating with an phase speed of ms-1 ( ms-1 faster than winds), and faster than the speed ms-1 in 2016–2018 (Peralta et al. 2020). An abrupt change in the clouds’ opacity was also observed in February 15 and 20 (see Fig.5), suggesting the reappearance of the first discontinuity after several full revolutions. Nevertheless, their zonal speeds matched those of the background winds within error bars and we decided to discard them from the analysis. The fast increase of zonal wind speeds after February 4 (see Fig. 2a) suggests a probable dissipation of the wave leaving a persistent reminiscence of its effect on the clouds’ opacity.
| Date/Time (UT) | Clouds a aa a aa Approximate level sensed: the dayside upper clouds (56.5–70 km above the surface), the dayside middle clouds (50.5–56.5 km), and the nightside lower clouds (47.5–50.5 km). | Wavelength b bb b bb Filters used: contK (2.22–2.32 ), Astronomik ProPlanet 742 IR-pass filter (742 nm), Baader SLOAN/SDSS z’-s’ (820–920 nm), Baader IR-Pass Filter (685 nm) and VCO/UVI 365-nm (345–380 nm). | Observer |
|---|---|---|---|
| 2022-02-04 16:55 | Lower | 2.26 | IRTF/SpeX |
| 2022-05-05 04:36 | Middle | 742 nm | C. Foster |
| 06:13 | Middle | 820–920 nm | A. Cidadão |
| 2022-05-15 04:29 | Middle | 742 nm | C. Foster |
| 08:16 | Middle | 820–920 nm | A. Cidadão |
| 2022-05-25 04:41 | Middle | 742 nm | C. Foster |
| 07:58 | Middle | 820–920 nm | A. Cidadão |
| 2022-05-30 05:14 | Middle | 742 nm | C. Foster |
| 09:06 | Middle | 685 nm | L. S. Viola |
| 2022-06-04 05:09 | Middle | 820–920 nm | L. Morrone |
| 09:52 | Middle | 820–920 nm | A. Cidadão |
| 2022-06-13 14:05 | Upper | 345–380 nm | VCO c cc c cc Venus Climate Orbiter: 1st name of Akatsuki (Nakamura et al. 2007)./UVI |
| 2022-06-14 23:05 | |||
| 2022-06-14 05:16 | Middle | 820–920 nm | L. Morrone |
| 2022-06-19 05:52 | Middle | 820–920 nm | L. Morrone |
| 06:48 | Middle | 820–920 nm | A. Cidadão |
| 2022-06-24 05:46 | Middle | 820–920 nm | L. Morrone |
| 07:36 | Middle | 820–920 nm | A. Cidadão |
| 2022-07-09 06:33 | Middle | 820–920 nm | A. Cidadão |
| 2022-07-13 10:33 | Middle | 820–920 nm | A. Cidadão |
| 2022-07-18 11:57 | Middle | 820–920 nm | A. Cidadão |
| 2022-07-23 06:27 | Middle | 820–920 nm | L. Morrone |
| 07:54 | Middle | 820–920 nm | A. Cidadão |
| 2022-07-28 09:21 | Middle | 820–920 nm | A. Cidadão |
A total of 13 events were confirmed in the set of amateur images sensing the dayside middle clouds of Venus between April and July 2022 (see Table 1 and Fig. 1). In average, the discontinuity at the middle clouds exhibited a mean length/width of / km, while the average phase speed is ms-1 and rotation period terrestrial days. These values match the results from Akatsuki/IR1 images during 2016 ( ms-1 and days; see Peralta et al. 2020) and amateur images during March–April 2020 ( ms-1 and days; see Kardasis et al. 2022).

The time evolution of the discontinuity zonal phase speed, orientation relative to the equator and meridional coverage is displayed in Figure 2. Regarding the night lower clouds, the low number of discontinuity events observed during February 2022 might be related with a potential dissipation of the wave due to the fast increase of the zonal winds after February 4, maybe caused by an episode of equatorial jet (Horinouchi et al. 2017). Concerning the events at the dayside middle clouds, two periods may be distinguished. From May to June 2022 the discontinuity exhibits its strongest perturbation over the clouds’ albedo, specially between May 30 and June 24 (see Fig. 1) when its characteristic dark-to-bright streak pattern is clearly visible (Kardasis et al. 2022). During this period we also observe that the discontinuity seems to rotate faster as it becomes more perpendicular to the equator (see Fig.2a–b). During July 2022, the rotation period and the orientation exhibit a higher variability, accompanied by a less pronounced alteration on the clouds albedo (see Fig. 1). Although this might be interpreted as an episode of gradual weakening of the discontinuity, we cannot rule out an observational bias since during July 2022 the spatial resolution becomes comparable to the discontinuity width ( km).
3.2 The discontinuity at the top of the clouds?
Given that it could not be identified in the images of the upper clouds taken by Akatsuki during 2016, the discontinuity has been interpreted as a Kelvin-type wave which propagates at the deeper clouds and probably dissipates before arriving at the upper clouds (Peralta et al. 2020), which is supported by zonal phase speeds faster than winds at the deeper clouds and slower than winds at the top of the clouds (Kardasis et al. 2022). During June 13–14 (see Table 1 and Fig. 1) and probably also in May 30 (see Fig. 6), a discontinuity-like pattern propagating m s-1 faster than background winds was observed in UVI images at 365 and 283 nm (Fig. 1), but not in 10- thermal images from LIR (presumably due to their worse spatial resolution during these dates). This pattern became apparent at the top of the clouds in June 13 at about 20:00 UT near the border of the –also present– Y-feature, gradually intensifying and then vanishing in 14 of June 17:00 UT (see animated Fig. 3).
Although the ultraviolet albedo sometimes exhibits sharp patterns, the one on June 13–14 shares with the discontinuity at the middle clouds location, rotation period, orientation and latitudinal coverage, while the zonal winds at the clouds’ top are slow enough to change the altitude of the critical level and facilitate the vertical propagation of the Kelvin wave (see Fig. 2). Using the amateur image acquired in 2022 June 14 05:15:50 UT and the UVI image at 06:04:44 UT (see Fig. 6), we derived the position of the discontinuity at the middle clouds when the UVI image was taken considering that ms-1, and obtained a phase difference (i.e. km) for the discontinuity at both levels. Assuming that the top of the clouds and the middle clouds are located at km (Ignatiev et al. 2009) and km (Khatuntsev et al. 2017) respectively, the altitude difference is km and the angle between the wave vector and the horizontal plane () will be . And given that (Gubenko et al. 2011) and considering that the width of the discontinuity is representative of the zonal wavelength ( km), the vertical wavelength will be km.
4 Conclusions
- 1.
Thanks to the coordinated observations by JAXA’s Akatsuki mission and ground-based professional/amateur observers during the first half of 2022, we present the longest uninterrupted study of the clouds’ discontinuity of Venus up to date, extending 109 days from 2022 March 13 until July 31 and covering several cloud layers of the atmosphere.
- 2.
The nightside lower clouds were explored by means of 2.26- images taken by IRTF/SpeX along 41 days from December 2021 until March 2022. Nevertheless, the discontinuity seems to manifest only once prior to an intensification of the zonal winds at lower latitudes.
- 3.
The middle and upper clouds were studied between 2022 March–July with amateur and Akatsuki/UVI observations, respectively. As many as 13 discontinuity events were identified at the middle clouds, exhibiting an average length and width of km and km and a mean rotation period of terrestrial days, a period identical to estimates from 2016 (Peralta et al. 2020) and 2020 (Kardasis et al. 2022).
- 4.
For the first time, we report the possible manifestation of the discontinuity at the top of the clouds during 21 hours, suggesting that the critical level for this Kelvin wave ascended due to the slower winds at the clouds’ top. Nonetheless, further research about atmospheric conditions is required to explain why the discontinuity seemed absent at the clouds’ top in other dates with slower winds.
- 5.
Even though the discontinuity was not identified in Akatsuki/LIR images, future Akatsuki observations might accomplish new positive identifications if discontinuity events occur during pericentric observations (when Akatsuki images have better spatial resolution). In addition, a revisit of Venus ultraviolet images during past episodes of slower winds may reveal new discontinuity events with Akatsuki (Horinouchi et al. 2018) and previous space missions like NASA’s Pioneer Venus or ESA’s Venus Express (Rossow et al. 1990; Hueso et al. 2015; Khatuntsev et al. 2013), allowing to characterise its recurrence with better accuracy.
Acknowledgements.
J.P. thanks EMERGIA funding from Junta de Andalucía in Spain (code: EMERGIA20_00414). I.G.-L. and A.S.-L. were supported by Grant PID2019-109467GB-I00 funded by MCIN/AEI/10.13039/501100011033/ and by Grupos 1128 Gobierno Vasco IT1742-22. We thank the members of JAXA’s Akatsuki mission and Visiting Astronomers at the Infrared Telescope Facility operated by the University of Hawaii under contract 80HQTR19D0030 with NASA. This research would have been impossible without the many amateur observers who observed Venus intensively during the investigated period and shared their images, although we would like to highlight contributions from M. A. Bianchi, G. Calapai, D. Kananovich, N. MacNeill, V. Mirabella, W. M. Lonsdale, R. Sedrani, L. S. Viola and G. Z. Wang. Finally, we thank the two anonymous reviewers whose comments/suggestions helped improve and clarify this manuscript.References
- Akiba et al. (2021) Akiba, M., Taguchi, M., Fukuhara, T., et al. 2021, Journal of Geophysical Research (Planets), 126, e06808
- Boyer & Camichel (1961) Boyer, C. & Camichel, H. 1961, Annales d’Astrophysique, 24, 531
- Farsiu et al. (2004) Farsiu, S., Robinson, M. D., Elad, M., & Milanfar, P. 2004, IEEE Transactions on Image Processing, 13, 1327
- Fukuhara et al. (2017) Fukuhara, T., Futaguchi, M., Hashimoto, G. L., et al. 2017, Nature Geoscience, 10, 85
- Fukuya et al. (2021) Fukuya, K., Imamura, T., Taguchi, M., et al. 2021, Nature, 595, 511
- Gubenko et al. (2011) Gubenko, V. N., Pavelyev, A. G., Salimzyanov, R. R., & Pavelyev, A. A. 2011, Atmospheric Measurement Techniques, 4, 2153
- Horinouchi et al. (2020) Horinouchi, T., Hayashi, Y.-Y., Watanabe, S., et al. 2020, Science, 368, 405
- Horinouchi et al. (2018) Horinouchi, T., Kouyama, T., Lee, Y. J., et al. 2018, Earth, Planets, and Space, 70, 10
- Horinouchi et al. (2017) Horinouchi, T., Murakami, S., Satoh, T., et al. 2017, Nature Geoscience, 10, 646
- Hueso et al. (2015) Hueso, R., Peralta, J., Garate-Lopez, I., Bandos, T. V., & Sánchez-Lavega, A. 2015, Planetary and Space Science, 113, 78
- Ignatiev et al. (2009) Ignatiev, N. I., Titov, D. V., Piccioni, G., et al. 2009, Journal of Geophysical Research (Planets), 114, E00B43
- Kardasis et al. (2022) Kardasis, E. M., Peralta, J., Maravelias, G., et al. 2022, Atmosphere, 13, 348
- Khatuntsev et al. (2017) Khatuntsev, I. V., Patsaeva, M. V., Titov, D. V., et al. 2017, Journal of Geophysical Research (Planets), 122, 2312
- Khatuntsev et al. (2013) Khatuntsev, I. V., Patsaeva, M. V., Titov, D. V., et al. 2013, Icarus, 226, 140
- Kitahara et al. (2019) Kitahara, T., Imamura, T., Sato, T. M., et al. 2019, Journal of Geophysical Research (Planets), 124, 1266
- Kouyama et al. (2012) Kouyama, T., Imamura, T., Nakamura, M., Satoh, T., & Futaana, Y. 2012, Planetary and Space Science, 60, 207
- Kouyama et al. (2015) Kouyama, T., Imamura, T., Nakamura, M., Satoh, T., & Futaana, Y. 2015, Icarus, 248, 560
- Kouyama et al. (2017) Kouyama, T., Imamura, T., Taguchi, M., et al. 2017, Geophysical Research Letters, 44, 12,098, 2017GL075792
- Kouyama et al. (2019) Kouyama, T., Taguchi, M., Fukuhara, T., et al. 2019, Geophysical Research Letters, 46, 9457
- Law et al. (2006) Law, N. M., Mackay, C. D., & Baldwin, J. E. 2006, A&A, 446, 739
- Lebonnois et al. (2013) Lebonnois, S., Lee, C., Yamamoto, M., et al. 2013, Models of Venus Atmosphere, ed. L. Bengtsson, R.-M. Bonnet, D. Grinspoon, S. Koumoutsaris, S. Lebonnois, & D. Titov, 129
- Limaye et al. (2018) Limaye, S. S., Watanabe, S., Yamazaki, A., et al. 2018, Earth, Planets, and Space, 70, 38
- McGouldrick et al. (2021) McGouldrick, K., Peralta, J., Barstow, J. K., & Tsang, C. C. C. 2021, The Planetary Science Journal, 2, 153
- Murakami et al. (2019) Murakami, S., Yamamoto, Y. McGouldrick, K., Hashimoto, G. L., et al. 2019, in JAXA Data Archives and Transmission System (Institute of Space and Astronautical Science, Japan Aerospace Exploration Agency)
- Nakamura et al. (2016) Nakamura, M., Imamura, T., Ishii, N., et al. 2016, Earth, Planets and Space, 68, 1
- Nakamura et al. (2007) Nakamura, M., Imamura, T., Ueno, M., et al. 2007, Planetary and Space Science, 55, 1831
- Navarro et al. (2021) Navarro, T., Gilli, G., Schubert, G., et al. 2021, Icarus, 366, 114400
- Ogohara et al. (2017) Ogohara, K., Takagi, M., Murakami, S.-y., et al. 2017, Earth, Planets, and Space, 69, 167
- Peralta et al. (2017) Peralta, J., Hueso, R., Sánchez-Lavega, A., et al. 2017, Nature Astronomy, 1, 0187
- Peralta et al. (2019a) Peralta, J., Iwagami, N., Sánchez-Lavega, A., et al. 2019a, Geophysical Research Letters, 46, 2399
- Peralta et al. (2018) Peralta, J., Muto, K., Hueso, R., et al. 2018, The Astrophysical Journal Supplement Series, 239, 17
- Peralta et al. (2020) Peralta, J., Navarro, T., Vun, C. W., et al. 2020, Geophysical Research Letters, 47, e87221
- Peralta et al. (2019b) Peralta, J., Sánchez-Lavega, A., Horinouchi, T., et al. 2019b, Icarus, 333, 177
- Peralta et al. (2015) Peralta, J., Sánchez-Lavega, A., López-Valverde, M. A., Luz, D., & Machado, P. 2015, Geophysical Research Letters, 42, 705, 2014GL062280
- Rayner et al. (2003) Rayner, J. T., Toomey, D. W., Onaka, P. M., et al. 2003, The Publications of the Astronomical Society of the Pacific, 115, 362
- Rossow et al. (1990) Rossow, W. B., del Genio, A. D., & Eichler, T. 1990, Journal of Atmospheric Sciences, 47, 2053
- Sánchez-Lavega et al. (2017) Sánchez-Lavega, A., Lebonnois, S., Imamura, T., Read, P., & Luz, D. 2017, Space Science Reviews, 212, 1541
- Sánchez-Lavega et al. (2016) Sánchez-Lavega, A., Peralta, J., Gomez-Forrellad, J. M., et al. 2016, The Astrophysical Journal Letters, 833, L7
- Sato (2018) Sato, T. 2018, Journal of the Association of Lunar and Planetary Observers, the Strolling Astronomer, 60, 20
- Sato et al. (2020) Sato, T. M., Satoh, T., Sagawa, H., et al. 2020, Icarus, 345, 113682
- Satoh et al. (2017) Satoh, T., Sato, T. M., Nakamura, M., et al. 2017, Earth, Planets, and Space, 69, 154
- Satoh et al. (2022) Satoh, T., Uemizu, K., Ueno, M., Kimata, M., & Sato, T. M. 2022, in Society of Photo-Optical Instrumentation Engineers (SPIE) Conference Series, Vol. 12264, Society of Photo-Optical Instrumentation Engineers (SPIE) Conference Series, ed. S. R. Babu, A. Hélière, & T. Kimura, 122640H
- Scarica et al. (2019) Scarica, P., Garate-Lopez, I., Lebonnois, S., et al. 2019, Atmosphere, 10, 584
- Svedhem et al. (2007) Svedhem, H., Titov, D. V., McCoy, D., et al. 2007, Planetary and Space Science, 55, 1636
- Taguchi et al. (2007) Taguchi, M., Fukuhara, T., Imamura, T., et al. 2007, Advances in Space Research, 40, 861
- Titov et al. (2018) Titov, D. V., Ignatiev, N. I., McGouldrick, K., Wilquet, V., & Wilson, C. F. 2018, Space Science Reviews, 214, 126
- Yamazaki et al. (2018) Yamazaki, A., Yamada, M., Lee, Y. J., et al. 2018, Earth, Planets and Space, 70, 23
Appendix A Discontinuity events projected
Appendix B The discontinuity at the lower clouds

Appendix C The discontinuity at two cloud layers