Practical Privacy Preservation in a Mobile Cloud Environment
Abstract
The proliferation of smartphone devices has led to the emergence of powerful user services from enabling interactions with friends and business associates to mapping, finding nearby businesses and alerting users in real-time. Moreover, users do not realize that continuously sharing their trajectory data with online systems may end up revealing a great amount of information in terms of their behavior, mobility patterns and social relationships. Thus, addressing these privacy risks is a fundamental challenge. In this work, we present , a Privacy Protection system for Trajectory analytics. Our contributions are the following: (1) we model a new type of attack, namely ’social link exploitation attack’, (2) we utilize the coresets theory, a fast and accurate technique which approximates well the original data using a small data set, and running queries on the coreset produces similar results to the original data, and (3) we employ the Serverless computing paradigm to accommodate a set of privacy operations for achieving high system performance with minimized provisioning costs, while preserving the users’ privacy. We have developed these techniques in our system that works with state-of-the-art trajectory analytics apps and applies different types of privacy operations. Our detailed experimental evaluation illustrates that our approach is both efficient and practical.
Index Terms:
serverless, privacy, mobile cloudI Introduction
The proliferation of smartphone devices has opened up a new era of collaboration and sharing. With the advent of the Internet of Things (IoT), the paradigm shift towards interconnected devices and platforms has allowed the gathering of more information about the environment from heterogeneous sources and the exchange of information with the real world. The IoT paradigm allows for a renewed form of context-aware computing, where applications interact with the user, and adapt their services based on the prevailing user context. For instance, trajectory-based systems such as Uber (https://www.uber.com), Foursquare’s Swarm (https://www.swarmapp.com/) and DiDi (https://www.didiglobal.com/) have enabled users to systematically share updates about their activities and whereabouts. In these systems, users often contribute their user IDs and timestamped locations in real-time, possibly enriched with multimedia content, such as images, videos or text, in order to track family members and friends, get rewards, or receive recommendations about places of interest. For the vast majority of the individuals, there are several benefits from sharing their whereabouts (e.g., friends trying to find each other in busy places such as shopping centers or parks, parents tracking their children locations for safety purposes or citizens earning free parking time in smart cities11 1 http://www.vavel-project.eu/).
Trajectory Analytics. It has been shown that users issue various types of queries to trajectory analytics applications while taking private leisure walks in public places or while strolling with friends around the city, asking for recommendations or other types of services, e.g. querying for available taxis, which are performed by sharing their own trajectories. The majority of these state-of-the-art works aim at capturing human movement, dynamics, regularities [1] and provide secure analytics [2] observing mobility patterns in data streams, providing answers to questions regarding the geographic movement of people (”where do they move?”) or aiming to understand how social ties impact mobility patterns, answering questions such as ”what the friends of a user can reveal about the user’s mobility patterns” and ”how similar users are based on their mobility” [3, 4]. A fundamental insight in these works is that people exhibit strong periodic behavior in their mobility patterns as they move back and forth between their homes and workplaces [5, 6], and that user mobility is shaped by our social relationships as we are more likely to visit places that our friends and people with similar interests have visited in the past or have shared common activities with, a phenomenon known as social homophily [7].
Trajectory Privacy Preservation. Current trajectory analytics applications are crude, since users are asked to ”opt-in” (thus allowing for disclosing possible sensitive data to them) in order to receive higher accuracy, whereas in others they may ”opt-out” and accept generic recommendations but with much lower quality and accuracy. A typical operating scenario of such applications employs a system for delivering trajectories from users to data analysts, in order to be further processed and returns a set of beneficial services for the users. In the current big data ecosystem, it is typical to have direct access to users’ private data, and they must be trusted not to abuse it. However, this trust has been violated in the past22 2 https://www.eff.org/deeplinks/2015/01/healthcare.gov-sends-personal-data. Additionally, as privacy preferences are subjective by nature, only a small percentage of the users of these systems realize the serious privacy implications that may arise and their extent. An adversary, or third party, can extract social trajectory-based data to identify social ties among the users of these systems. The adversary can further exploit the extracted information to target individual users for marketing campaigns, monitor their movements to compromise one’s personal safety, or even act on behalf of a third company (i.e., an insurance company that aims to extract personal biometric characteristics from fitness applications, evaluate the health status of the users and appropriately adjust their insurance rates [8]). The adversary can also target groups of users with similar mobility patterns. For example, it is known that location and mobility data are examined by NSA to identify new (or unknown) members of criminal gangs or terrorist cells of targets that already knows about33 3 https://www.expressvpn.com/internet-privacy/guides/nsa-spying/. Or finally, groups of users can be exploited for targeted advertising: advertising companies create targeted ad groups, based on interests, lifestyles, demographics, geo-location or mobility patterns. Similar examples can be found in mobile alerting systems or social transportation systems [9] where mobility groups are utilized for ride-sharing or to react to disruptions of transportation services in real-time.
The serverless computing model. Recently, a new privacy-preserving model for trajectories in Mobile Cloud Environments(MCEs) has been proposed, referred to as on-device public-private TPP model [10], where user data is partitioned into two parts: (a) a public part that can be shared with a data analyst, and (b) a private part (on-device data) that is protected from disclosure. The model conducts computations using both private and public data on the user’s phone. However, storing all the user trajectories in the phones is impossible due to storage limitations and therefore, unavoidably, they must be conducted through a mobile cloud service provider before being disclosed to the data analyst. The advent of cloud computing has enabled providing low-latency trajectory analytics and has enabled many service providers to move their hardware infrastructure from on-premise deployments into large-scale shared cloud resources [11]. The Serverless Computing has been introduced recently in the literature [11] as a scheme to enable Mobile Cloud providers balance the trade-off between the computational costs for users (i.e. provide results with low-latency) and the provisioning costs (i.e resource allocation costs), compared to traditional on-premises deployments. While marrying these two paradigms, we face two challenges: the first is how to detect social ties between users based on the trajectories, in real-time. The question is whether the estimation of privacy exposure can utilize only a subset (sample) of the user’s trajectories. The second challenge is, since the Serverless Computing paradigm enables for a pay-as-you-use service, how we can exploit it to balance the trade-off between providing trajectory analytics with low-latency and minimizing the costs associated with using such a service, while considering the different privacy perspectives of the individual users.
The goal of the work is to present a cost-effective and practical system for MCEs enhanced with a user-tunable degree of privacy preservation, that provide solutions to these two major challenges: (1) minimize the volume of mobility patterns required for the privacy estimation analysis to enable on-device storage, and (2) utilize the serverless computing paradigm for trajectory analytics, to balance the trade-off between low-latency computations and minimization of provisioning costs, preserving at the same time the privacy of the trajectories.
Contributions. In this work we make the following contributions:
- •
We propose , a Practical Privacy preservation system for trajectory analytics in MCEs. adopts an on-device model that reduces the volume of the examined mobility patterns using the theory of coresets and allows the system to obtain guaranteed, fast and accurate approximations of user trajectory data.
- •
We model a new type of attack, namely social link exploitation attack, where a third party data analyst can infer information about the user and the user’s behavior by associating the user’s patterns with groups of similar users while sharing trajectory data.
- •
We exploit the Serverless Computing paradigm for providing a balance between high performance trajectory analytics and low provisioning costs, utilizing a Pareto-Frontier search algorithm. We apply four different privacy operations achieving a good balance between accuracy and privacy of the disclosed trajectories.
- •
We have implemented the system to support trajectory analytics apps on top of Android devices and the OpenFaaS serverless platform, and evaluated its performance. We illustrate that is a cost-effective approach and can achieve at least 47% reduction of the risk of privacy exposure while users are able to contribute data to trajectory analytics apps.
II Model and Threat Definition
II-A On-device Model
Users. Users in the system are characterized by the tuple , where is the unique id of user and is a list of all the contributed publicly available data reports made by the user through the trajectory analytics apps. Typically, these reports are coupled with location and timestamps and illustrate the user’s presence activity. The -th spatio-temporal data report issued by a user , , is a tuple , where are the geospatial coordinates, a timestamp value annotating the time when the user issued the specific report and denotes the data associated with the spatio-temporal report. In the case of a traffic monitoring application e.g., the data can represent the traffic state (e.g. ”traffic jam”, ”road closure” etc.), whereas in location-based recommendation apps it can reveal the location semantics of a place where a user has checked-in.
Trajectories. Users share reports to trajectory analytics apps which are represented in the form of trajectories. That is, users maintain locally their spatio-temporal data reports which form their mobility patterns. Each user trajectory has a unique identity and a sequence of spatio-temporal data reports ; these denote the route the user was following while issuing the spatio-temporal data reports.
Mobility Profiles. The Mobility Profile (MP) of a user , , is represented through the user’s trajectories, . We discuss in detail how mobility profiles are compiled in our system in section III-A.
Utility. The notion of utility has been introduced in recent works[12, 13] as a performance metric of location privacy protection systems in order to capture the trade-off between data quality and user privacy preservation. The goal is to preserve data utility as much as possible (in terms of how useful and accurate the data report is) while preserving the users’ privacy. In , our aim is to measure the utility of a perturbed trajectory , thus we define it as the inverted distance between each one true report and the corresponding released report . More formally, , where denotes the difference between the reports (also called ”correctness” [14]). In the case of trajectory analytics applications the aforementioned formula considers the geographical distance between the reports, whereas in the case of emergency response trajectory analytics applications, for which time is a critical parameter, the equation also considers the difference in the timestamps among the original and the released reports.
Social Graph. The set of users form an undirected social graph , where each node denotes user , each edge annotates the social tie between users and , and finally is a value that represents the strength of the social tie between users and .
II-B Serverless Model
We chose to deploy on a Serverless environment rather than a traditional hosting solution in a cloud provider. Choosing the Serverless computing model [11], we have a lower operational and deployment cost due to its unique pricing policy based on a pay-as-you-use model. This model allows for using ephemeral containers that are utilized only during our workload. During long periods of inactivity, containers stop running automatically (scale to zero) to keep the operational cost low, since it provides a seamless method for autoscaling the resources. That is the number of active instances can adapt dynamically according to the number of requests, e.g., if 3 active instances are typically employed, these can increase to 10 during data bursts and can go back to normal levels when the number of requests decreases. Apart from the aforementioned benefits, it allows developers to build simpler software by designing their services as functions. In our approach we use OpenFaaS (https://www.openfaas.com/) as our Serverless environment, but our system works inline with existing state-of-the art Serverless systems such as AWS, GCF, IBM Cloud, etc.

II-C Threat Model
Social Strength. To infer whether a pair of individuals are socially connected, recent works [3, 4] have attempted to model the relationship between the users’ mobility patterns and their social ties. One approach is to use a graph model [4] where learning the users’ mobility features and evaluating the users’ mobility similarity, the social tie between two users can be captured. A similar model was introduced in [3] where they aim at recording the diversity of the locations visited by the users. However, both approaches are not appropriate for our setting as they focus on single locations rather than trajectories, and thus cannot encapsulate the users’ movement regularity, dependencies or transitions among different locations. Trajectory-based modeling, on the other hand, allows us to meet with high accuracy the requirements of applications with spatiotemporal correlations among queries issued by the users for trajectory analytics apps [15].
We use an entropy-based model to capture the social strength among two users of the system, given their mobility profiles. Our metric captures the diversity of the users (i.e. in terms of the number of different places they visit) by evaluating the similarity of their mobility profiles. Thus, the social strength among two users given their mobility profiles , , is defined as: where
where is a parameter to tune the degree of privacy preservation tailored to the user’s personal needs (explained in detail in the next section). For instance, a value of () indicates that the user is highly concerned about the privacy. Additionally, ; a value of equal to 1 indicates that the two users are highly socially connected and have identical mobility behavior, while a value close to 0 indicates that there is little social connection among the users.
The probability function evaluates the similarity between the trajectories , of users ,. To perform this computation, we utilize the notion of expected edit distance metric [16], which characterizes the similarity between trajectories with a respective probability to show up. That is, given the trajectory , the function captures what is the probability to find the trajectory , as implied by the metric. Therefore, the probability function is defined formally as: where denotes the longest common consecutive subsequence between two trajectories. We assume a third party data analyst that aims at exploiting the social ties among mobile users. The data analyst has compiled a list of mobility profiles (MPs) for all users that have shared trajectories with the trajectory analytics apps. The MPs are compiled from the users’ mobility patterns using most frequent subset pattern mining procedure[17].
Social Link Exploitation Attack. We introduce a novel type of attack, namely the social link exploitation attack, where the a data analyst attempts to exploit the social relationships through trajectory analytics apps in order to predict the movement patterns of a particular user. In our setting, the analyst has already compiled a model of human mobility based on the geospatial movements of the users. By estimating the social strength between a user and the set of compiled mobility profiles, the attacker is able to associate the user with other users with the same behavior and estimate the user’s mobility pattern [18]. The attacker can exploit this information not only to compromise one’s safety but also for marketing purposes to predict the most likely venue that a user will visit and select an appropriate ad to pop-up in the user’s phone.
Example. In Figure 1 we illustrate a scenario of how a curious data analyst can associate a user with one of the MPs of the set that has already been compiled. The left part of the figure illustrates three users of a specific trajectory analytics app. In a real world scenario, the users typically provide direct access of their trajectories to the data analyst. The right part of the figure shows a small sample of the MPs compiled from our Fousquare dataset (described in section V) for various users utilizing this app. We show 6 different trajectories that correspond to three users, based on the Foursquare data. The bottom of the figure illustrates the trajectory of the user that is evaluated, which consists of the following report sequence: Train Station, Cafe, Clothing Store, Bookstore and finally the user enjoys a burger in a Burger Shop. We may observe that there is a common pattern among user and the third trajectory which belongs to user who has probably visited a ”Mall”. The data analyst computes the social strength of user’s trajectory (up to the 5th report) and the MPs that have been compiled. The computed social strength reveals, with high probability, that user is very likely to visit an ”Ice-cream Shop” in one of the next moves. Subsequently, after associating those users two users as more highly socially connected, the data analyst can infer the next probable visit of the user in order to provide for e.g. targeted advertisements for ”Ice Cream Shops” or related ads.
III approach
In this section we present the main mechanisms of the system: a) we first build mobility profiles using the theory of coresets, that provides a guaranteed approximation sample of the original geolocated data reports stored on-device, b) we formulate our multi-objective optimization problem, c) we present our algorithm for estimating the set of all the non-dominated solutions, which constitute a Pareto frontier, and d) we apply a set of serverless privacy operations at the last stage of the system that aim at minimizing the social strength of the user with any kind of social relationships, (i.e., friends or users with similar behavior) to preserve his privacy.
III-A Building Mobility Profiles
is built based on the observation that people show strong regularities in their behavior while using trajectory-based apps. For example, during weekdays they typically follow specific movement patterns between primary (e.g., ”home”) and secondary (e.g., ”work”) locations, while on weekends they present different mobility behavior that alternates between ”home” and various social locations. We model the users’ movement patterns using coresets, a data reduction technique that allows us to significantly reduce the trajectories size while providing a guaranteed approximating sample of the original trajectory stored on-device.
Theoretical Background. We utilize a sampling technique in order to generate a representative set of reports that approximates well the trajectory of a user over space and time rather than keeping all his spatio-temporal reports. In the literature, many different sampling techniques have been proposed such as [19]. The sampling technique should be designed with the following properties: i) provide guaranteed approximation of the initial dataset, ii) provide a sample set of minimal size with bounded loss of information, and finally, iii) have small algorithmic complexity that can be executed in memory-constrained environments, such as users’ mobile phones in our setting. In ’s services, we exploit the theory of coresets[20], which fits our setting and has been recently used to address geometric and graph problems[21], such as k-means, k-median, etc. Our approach differs from the above works, since: (1) we consider user trajectories rather than single geospatial reports, and (2) address different privacy goals. The benefit of coresets is that they constitute a small set which approximates well the original data, and running queries on the coreset produces similar results to the original data. Thus, in our approach: (1) we keep only the reports of the generated coreset when compiling and storing a user’s trajectory, (2) this results in significant performance benefits, as the number of reports kept locally on a user’s phone is significantly reduced, as extensively evaluated in [6].
In computational geometry, a coreset of a point set is a sample that can efficiently approximate the initial set of points . Given a set of user shared spatio-temporal reports , we assume that can be approximated by a factor from a smaller subset of the user’s shared spatio-temporal reports. More formally, for the given point set and a class of queries , the following property holds for the coreset and for a given :
Trajectory Coresets. We build the coreset of the user’s trajectory by selecting the appropriate spatio-temporal reports that will comprise the coreset as follows: Without loss of generality, we apply a well-known compression mechanism[6] on the user’s trajectory to generate a set of spatio-temporal reports that preserve the shape of the user’s trajectory but with fewer number of reports. The generated set of reports after applying this scheme is the coreset of the user’s trajectory. In our work, we apply a procedure similar to [6]. This procedure generates a trajectory that preserves the sequence in space and time but approximates the original user trajectory with fewer data reports. In order to decide whether a new trajectory shared by the user can be described by a coreset, we evaluate its reports. Specifically, the algorithm evaluates, for two consecutive reports & , if the percentage change of the tangent is over a predefined threshold . More formally, . High values of () define a stricter sampling (and a smaller size of coreset) compared to values close to zero.
III-B Our multi-objective optimization problem
III-B1 Social Strength Minimization
Assume a user trajectory comprising a list of data reports shared by user . Then assume that a user wishes to share a new trajectory. The question is whether it is safe for the user to issue a query sharing this trajectory. The role of is to evaluate the safety for the user to issue it and then apply appropriate privacy measures. Thus, given a set of MPs that belong to possible social user ties and a threshold , we compute the social strength of the user’s trajectory , compared to the users represented by the MPs, using a score function as follows:
III-B2 Performance Maximization
The second metric we consider in our multi-objective problem is the requests success rate(RSR). The RSR has been introduced in recent works [22] as a performance metric of serverless functions. For a given memory allocation from a set of possible memory allocations, the requests success rate is defined as the ratio of the number of user requests successfully served by this memory allocation , , to the overall number of the requests submitted by the users to the system, . In our work, our goal is to maximize the execution performance for all possible given memory allocations . Thus, our objective can be formulated as follows: .
III-B3 Spending Budget minimization
The third metric we consider in our multi-objective problem is the spending budget . To compute this metric, we applied a pricing model similar to the one used by popular cloud providers like IBM (https://cloud.ibm.com/functions/learn/pricing). The metric considers a basic rate which denotes the amount of monetary units to pay per GB of data per sec, the average execution time of the serverless privacy preserving operation , the memory allocation allocated for the execution of the function and the number of successful requests served by the system, . More formally, .
Thus, for a finite cloud operator budget monetary units, our goal is to maximize the difference between and . More formally, .
Problem Definition. More formally, our problem can be formulated as a maximization problem as follows:
| (1) | |||
| (2) | |||
| (3) |
where is our objective function that considers both the execution performance and the spending budget.
III-C Pareto Frontier Search Algorithm
In , we solve a multi-objective optimization problem where we aim to balance the trade-off between the performance maximization and the required budget, while preserving privacy for the user trajectories. One of the most common ways of detecting appropriate solutions in such problems is constructing the Pareto frontier. In order to detect the optimal solutions in the examining search space, we need to define the notion of dominance [23]. Given two memory allocations and , dominates () if one of the following criteria is met: (1) the spending budget for is less than equal than the one required for and the performance of is greater than equal to the performance of or (2) requires strictly smaller budget than and also the performance of is greater than or equal to the performance of . However, computing the Pareto frontier is a computationally costly process. A naive approach is to enumerate all possible combinations of memory allocations, performance the spending budget. Such an exhaustive search algorithm has exponential complexity as it generates all these possible allocations. We propose a novel approach that detects near-optimal memory allocations in an efficient and fast way without enumerating all the solutions. Our greedy algorithm approximates the Pareto-optimal frontier by selecting the appropriate memory allocation for the serverless privacy function that is affected the most in its performance by memory allocation. Starting with the memory allocation that helps maximize the performance, we traverse the frontier to select the most appropriate one that minimizes the spending budget. By doing so, it is not required to enumerate all possible solutions.
III-D Serverless Privacy-Preserving Operations
aims for social strength minimization against a set of MPs that it has already compiled and appropriately stored. This is achieved by applying privacy-preserving operations that distort the users’ trajectories and therefore minimize the social strength with any social ties. Such techniques include spatial-location cloaking approaches [24], temporal cloaking methods [25], addition of redundant dummy locations [26] and path confusion techniques [27]. Depending on the user’s required level for privacy, applies the appropriate privacy operation each time the user wishes to publish new trajectory data to minimize the social strength below the -threshold.
Cloaking. In the Spatial-location cloaking privacy model [24], the exact location of the user is replaced by a broader spatial region termed cloaking region (CR). This privacy-preserving operation takes as input a spatio-temporal data report and returns a region cell (rather than the exact spatio-temporal location) that includes the spatio-temporal data report the user wants to publish. This technique simply blurs a user spatio-temporal report into an uncertainty region. A larger region size indicates a more strict privacy requirement, at the expense of not providing useful information for the system.
TempCloaking. Compared to the Spatial Cloaking model, this privacy-preserving model [25] uses time transformation and delays the user’s response by a time period. That is, for two consecutive time instances , the time instance of a new report is set to the time plus a random cloaking factor. In , the timestamp value of the trajectory’s data reports is changed accordingly by a specific amount of time, which consequently leads to a different trajectory, thus reducing the similarity with the compiled MPs.
Dummy Locations. An alternative approach to applying time or spatial transformations is this privacy-preserving model [26] where a number of dummy locations is generated. The user, instead of reporting the actual location, reports one or more locations which are very close to the actual one. Thus, for a given spatio-temporal data report , a list of one or more dummy spatio-temporal data reports is generated. Instead of publishing the trajectory with only the actual spatio-temporal reports , publishes the list of the dummy spatio-temporal reports generated, including the original ones.
Path Confusion. This privacy model [27] differs from the previous models, since perturbations of the previous locations are applied in order to obfuscate and reduce the similarity with the MPs. Given a set of spatio-temporal reports the user wants to share, the goal is to apply a perturbation technique that changes the actual trajectory of the user (i.e. publish another report instead of the actual one), which results to a different user trajectory. The perturbation process considers up to sequential spatio-temporal reports to perturb and changes their sequence.

IV Implementation



On-device service. For the on-device service of on the Android devices we utilized the Android Development Framework. We implemented an Android Service that works in concert with the Waze (https://www.waze.com/) and CrowdAlert (http://crowdalert.aueb.gr) and allows for the secure sharing of trajectories. Currently, it provides an API to those apps from which calls to trajectory-publishing methods are redirected through the Data Delivery Service of . If the user is willing to share a trajectory or a list of past trajectories with a data analyst, the Android Service of system is triggered and prepares appropriately the trajectory or the list of trajectories for delivering through the Data Delivery Service of , in order to be evaluated based on his personal privacy preferences.
Data Delivery service. The Data Delivery service in is responsible for processing trajectory shared from the Android Service. The Data Delivery service employs Apache Kafka as its fundamental building block. Apache Kafka is one of the most popular pub/sub systems and it is used for propagating millions of messages per second between a set of producers and consumers or across different services. Apache Kafka, apart from its ultra high throughput, uses replication, thus guarantying zero lost messages. Each user’s on-device service acts as a Kafka Producer and sends trajectories in specific topics, based to the user’s personal privacy preferences. Kafka Consumers constantly poll trajectories from these topics and send them through appropriate HTTP endpoints to the OpenFaaS Gateway to invoke the respective Serverless Privacy Function. Afterwards, the sanitized output is provided through appropriate HTTP endpoints to the data analyst.
Serverless Privacy Functions. This component sanitizes the user’s trajectory before being publishing it to the data analyst. comprises three different modes of privacy models (loose, moderate and strict), in which different privacy operations are applied in order to distort the users’ trajectories. The loose privacy mode corresponds to the application of the Dummy Location or Path Confusion privacy function, depending on the type of trajectory app (i.e., Path Confusion is suitable for applications where the perturbation of the reports in a trajectory is preferred rather than suppressing them, such as venue recommendation applications), which is encapsulated in the message received from the on-device service. The moderate privacy mode corresponds to the Cloaking function and finally, the strict privacy mode refers to the TempCloaking function, which changes the nature of the user’s trajectory. Finally, the sanitized trajectory is forwarded through the appropriate HTTP endpoints to the data analyst, preserving user’s privacy and utility. Our architecture overview is given in Figure 2.
V Experimental Evaluation


We conducted series of experiments to identify the effect of different parameters on the efficiency of each privacy operation in minimizing the social strength among the users and to show the benefits of employing a serverless model to maximize the system’s performance and minimize the cost. We answer the following questions: 1) how memory allocations affect the average response time, 2) how the memory allocations affect the throughput in terms of request/sec in each privacy operation, 3) how the different memory allocations affect the RSR, 4) what is the effect of the trajectories’ length to the social strength minimization, 5) how the stored report size is affected by each privacy operation, 6) how the memory allocations affect the spending budget of the system operator, 7) what is the effect of the percentage of trajectories that the data analyst has in his possession, 8) how the percentage of the sanitized trajectories affects the utility and finally 9) how performs compared to state-of-the-art techniques.
V-A Experimental Setting


Data Description. To validate our analysis we utilized a real-world dataset from the Foursquare location-based service. The Foursquare dataset includes check-in data in New York city collected from Foursquare from 12 April 2012 to 16 February 2013 [28]. The dataset contains 227428 check-ins and 1083 users, where the users were anonymized for privacy reasons. We selected 60% of the dataset’s users to train the appropriate MPs and the remaining 40% users as the test set. This represents a range of cases in a real system where a data analyst can have a range of knowledge about users and their respective trajectories, but it is not possible at all times to have a global view of the users.


Setup. We deployed OpenFaaS in our cluster, which consists of 5 nodes (Intel(R) Core(TM) i7 3770 CPU @3.40GHz, 16GB RAM, Ubuntu 16.04 LTS). We used Docker Swarm as the orchestrator and we deactivated Prometheus AlertManager in order to deactivate autoscaling of functions. We used (https://github.com/rakyll/hey) for traffic measurements. We tested three different workload scenarios with five different memory allocation setups: (512, 1024, 1536, 2048 and 2560 (in MB)). In OpenFaaS, we setup our images to allocate 512MB of memory and we used replication in order to increase the total allocated memory. That is, each machine will host a container of each function with 512MB of allocated memory (so 1024MB means 2 replicas in 2 machines, 1536MB 3 replicas in 3 machines etc.).
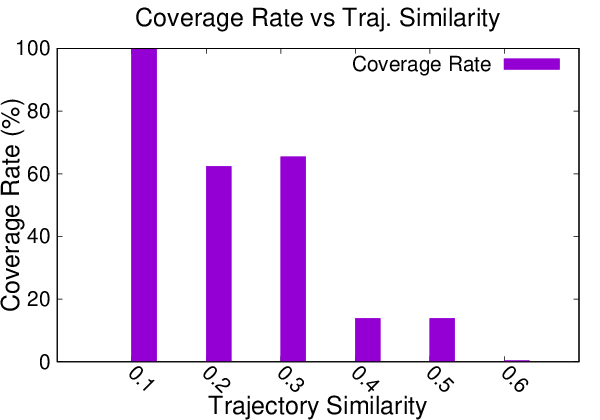
Mobility Profile Coverage Rate. We introduce a novel metric, namely mobility profile coverage rate, for capturing the percentage of users that are associated with compiled mobility profiles. The metric considers how similar the trajectory of a user is compared to the compiled mobility profiles. Formally, where denotes every user that has above the threshold and # denotes the number of users.
Analysis. Figures 6 & 6 illustrate the number of trajectories considered and what is the average length of the training trajectories. As we may conclude, selecting an time window length is reasonable for selecting the trajectories, since it provides a good balance between the length of trajectories to explore and the number of trajectories. In Figure 6 we draw the coverage rate for different degrees of trajectory similarity. As we may observe, as we set higher levels of similarity with the mobility profiles, the coverage rate decreases. However, even for only 30% of trajectory similarity over 60% of users are captured by the mobility profiles. In Figure 6 we draw the number of users captured by the mobility profiles. We observe that even for the case of 50% similarity, the number of captured users is 200 out of the 1084 users, which consists a considerable number of users. Thus, we conclude that mobility profiles may expose the privacy of a large number of users even with low mobility pattern similarity.
Baselines. We evaluated the performance of ’s privacy operations compared to a state-of-the-art technique, namely SmartMask [29], which applies a location obfuscation technique that assigns a spatio-temporal data report(a check-in), to the nearest, in terms of distance, point-of-interest.
V-B Experimental Workloads
To show the benefits of employing the serverless model for the privacy functions and different user inputs, we used Hey to generate 20000 HTTP requests using as a payload either single trajectories or mobility profiles, without any rate limitation to stress to its limits and test each privacy function independently. We setup three real-world scenarios, in which, each user of the test set, is willing to share either a single trajectory or the whole set of the trajectories that consist his mobility profile. The experimental results draw the average value for each one of the examined metrics from all the users in the test set.
One-vs-One Scenario - (OvO). In the first scenario, we examine the performance of the system when each user shares a single trajectory in the serverless system, evaluated against the most frequent mobility profile encountered in our system.
One-vs-Many Scenario - (OvM). Second, we examine the case in which the user shares a single trajectory which is evaluated against the whole set of mobility profiles compiled by our system. The goal is to capture the possible set of users with whom he may have similar mobility patterns with his trajectory.


Many-vs-Many Scenario - (MvM). Last, we evaluate the case where the user shares his whole set of trajectories, i.e., his entire mobility profile, against the whole set of mobility profiles compiled by our system. Compared to the previous scenario, in this one we aim at capturing all possible users with similar MPs, considering the entire MP of the user.
V-C Parameters Examined


1)Average Response Time vs Memory. In Figures 7(a), 7(b), 7(c) and 7(d) we illustrate the Average Response Time of our system which denotes the flexibility of the serverless model with respect to the memory allocation. Our results depict the impact of having flexible memory allocations in the amount of time required to respond to a request. An interesting finding that we observe, is that, increasing the total amount of allocated memory, this results to a significant decrease of the average response time for all the privacy functions in all scenarios.


2) Requests/sec vs Memory. Figures 8(a), 8(b), 8(c) and 8(d) depict our initial intuition that, by having flexible memory allocations using a serverless model, we should expect high increase in the number of requests served per sec. We reason these results to the fact that with higher memory the system can handle more concurrent HTTP requests and we can safely conclude that it is beneficial to employ a serverless model for serving multiple concurrent requests.
3) Requests Success Rate vs Memory. In Figures 9(a), 9(b), 9(c) and 9(d), we draw the ratio of successful requests served using a serverless model towards the total number of requests received for a specific memory allocation. The results show that as we increase the allocated memory, and consequently the number of replicas, the ratio increases to a value equal to one, meaning all user requests are successfully served by . This result is expected due to our setup, since the Docker Swarm load balances the traffic across all active replicas. Overall, the results show that it is beneficial to employ a serverless model for maximizing the system’s performance.
4) Trajectory length vs Social Strength. We evaluated the performance of each privacy operation for reducing the social strength considering trajectories of different length. We considered trajectories with length equal or greater than a varying trajectories length parameter. Figures 10(a), 10(b), 10(c) & 10(d) illustrate the social strength in logarithmic scale observed after applying each privacy operation for different values of trajectory length. An interesting finding is that the Dummy Locations technique outperforms the Cloaking technique for a trajectory length equal to 3. This is due to the fact that the Dummy Locations technique better obfuscates the user trajectory, since the random points inserted for this trajectory length, change it significantly. Overall, the TempCloaking and Cloaking privacy operations outperform the other techniques in terms of social strength minimization.
5) Coreset size vs Stored Reports. We investigated the effect of the size of the coresets on the size of stored reports when each privacy operation is applied. From our experimental analysis, we considered a value of which is reflected on a moderate level of sampling (and is the default settig in our implementation). Figures 14 and 14 illustrate the performance in terms of stored reports size reduction for each privacy operation. The results depict that the privacy operations allow for reducing the number of stored reports in the users phones significantly. We observe that TempCloaking (76% size reduction) still outperforms the privacy operations having Path Confusion and Cloaking as runner ups.
6) Spending Budget vs Memory. We examined the spending budget performance against different memory allocations and for every workload scenario. In Figure 14, we draw the spending budget performance for the many-to-many scenario, which is the most heavy in terms of performance, for the different privacy operations and memory allocations. We observe that the spending budget is relatively low compared to having a fixed budget. In addition, we observe that we can vary the spending budget with regards to the serverless privacy function we want to execute, thus providing a tunable-degree of privacy with regard to the execution costs.
7) Percentage of data analyst trajectories. In Figure 14 we draw the percentage of trajectories captured by the percentage of users for whom the data analyst has compiled MPs, with no privacy technique applied and after using ’s privacy operations. We observe that as the percentage of users in possession of the data analyst increases, the percentage of trajectories captured also increases for all the privacy operations but still remains under 50%. That is, since the data analyst has the 100% of the users, only 45% of user trajectories can be detected if only Cloaking technique is selected from all users to be applied. We also observe that TempCloaking technique totally minimizes the similarity of user trajectories with a MP due to the fact that it totally changes the nature of the user’s trajectories. Path Confusion and Dummy Locations methods also present good performance and so, we can conclude that can successfully trade-off between different levels of privacy and desired accuracy of results.
8) Utility vs Percentage of Shared Trajectory. We investigated the balance between data quality and privacy, when each one of ’s privacy operations is applied. Once a privacy operation has been selected, the goal is to apply it while preserving as much data utility as possible. In Figure 16 we draw the utility for the different privacy operations applied. The x-axis denotes the percentage of the trajectory that has already been published without applying any privacy operation. The published data are considered useful when the utility equals 100%. Path Confusion and Temporal Cloaking have utility 100%, since in the Foursquare location-based application they affect only the times of the reports rather than the corresponding locations. Overall, we safely conclude that succeeds in maintaining a balance between the data accuracy and privacy.
9) Comparison with state-of-the-art. In Figure 16 we draw the percentage of similarity for the different privacy operations applied. We observe that outperforms SmartMask, since for every provided privacy operation by , it results in lower similarity (it performs 47% better than SmartMask). This implies that is practical and efficient for protecting against social link exploitation attacks.
VI Related Work
Privacy Models. Privacy preservation is not a new area and approaches have been proposed in the literature[4, 3, 30, 31, 32]. However, these works have several limitations. In [4], they propose an attack that predicts social links between users, but it does not consider trajectories nor focuses on how a user associates to a group of users based on his mobility patterns. The authors of [3] aim at understanding the significance of a location visited by a user, which is encapsulated in the number of visits to a specific location. However, it is limited since the focus is on single locations rather than trajectories. In [31], the authors focus on securing the sensitive attributes of each location visited by applying l-diversity whereas in our approach we provide different privacy operations tailored to user needs. The authors of [30] focus on Geo-Indistinguishability for single locations than trajectories as we do in our work. Finally, in [32], the authors proposed transformations based on the K-anonymity concept for user locations, without considering the users’ mobility patterns nor possible social ties, which is the focus of our work.
VII Conclusions
In this paper we presented , a privacy preservation system for trajectory analytics. We have modeled a new type of attack considering how social ties shape human mobility. Our proposed system employs the serverless paradigm and manages to balance the trade-off between maximizing the overall performance and minimizing the operational costs, while requiring low maintenance and administration from the cloud provider. runs in concert with state-of-the-art trajectory analytics apps. Our experimental evaluation, compared to state of the art schemes, illustrates a reduction of at least 47% in user privacy exposure, providing a tunable degree of privacy preservation with high system performance for users and low costs for cloud providers.
Acknowledgment
This research has been supported by the H2020 LAMBDA Project 734242, the EU ICT-48 2020 project TAILOR (No. 952215) and the H2020 AutoFair project (No. 101070568).
References
- [1] L. Backstrom et al., “Find me if you can: improving geographical prediction with social and spatial proximity,” in WWW. ACM, 2010.
- [2] M. Beck, P. Bhatotia, R. Chen, C. Fetzer, T. Strufe et al., “Privapprox: privacy-preserving stream analytics,” in USENIX, 2017, pp. 659–672.
- [3] H. Pham and et al., “Ebm: an entropy-based model to infer social strength from spatiotemporal data,” in SIGMOD. ACM, 2013.
- [4] M. Backes et al., “walk2friends: Inferring social links from mobility profiles,” in CCS. ACM, 2017, pp. 1943–1957.
- [5] E. Cho, S. A. Myers, and J. Leskovec, “Friendship and mobility: User movement in location-based social networks,” in KDD, 2011.
- [6] I. Boutsis and V. Kalogeraki, “Location Privacy for Crowdsourcing Applications,” in UbiComp, Heidelberg, Germany, Sep. 12-16 2016.
- [7] J. Tang, Y. Chang, and H. Liu, “Mining social media with social theories: a survey,” KDD, vol. 15, no. 2, pp. 20–29, 2014.
- [8] H. Fereidooni et al., “Fitness trackers: Fit for health but unfit for security and privacy,” in CHASE. IEEE, 2017, pp. 19–24.
- [9] X. Zheng et al., “Big data for social transportation,” TITS, vol. 17, no. 3, pp. 620–630, 2016.
- [10] A. Epasto, H. Esfandiari, and V. Mirrokni, “On-device algorithms for public-private data with absolute privacy,” 2019.
- [11] X. C. Lin and et al., “Serverless boom or bust? an analysis of economic incentives,” in USENIX, 2020.
- [12] M. E. Gursoy et al., “Utility-aware synthesis of differentially private and attack-resilient location traces,” in SIGSAC. ACM, 2018, pp. 196–211.
- [13] Y. Xiao and L. Xiong, “Protecting locations with differential privacy under temporal correlations,” in CCS. ACM, 2015, pp. 1298–1309.
- [14] R. Shokri et al., “Quantifying location privacy,” in 2011 IEEE SP. IEEE, 2011, pp. 247–262.
- [15] H. Zang and J. Bolot, “Anonymization of location data does not work: A large-scale measurement study,” in MOBICOM, 2011, pp. 145–156.
- [16] R. Cotterell, N. Peng, and J. Eisner, “Stochastic contextual edit distance and probabilistic fsts,” in ACL, 2014, pp. 625–630.
- [17] P. Fournier-Viger et al., “Tks: efficient mining of top-k sequential patterns,” in ADMA. Springer, 2013, pp. 109–120.
- [18] L. Kong et al., “Privacy-preserving compressive sensing for crowdsensing based trajectory recovery,” in ICDCS. IEEE, 2015, pp. 31–40.
- [19] E. Ohlsson, “Sequential poisson sampling,” Journal of official Statistics, vol. 14, no. 2, p. 149, 1998.
- [20] P. K. Agarwal et al., “Geometric approximation via coresets,” Combinatorial and computational geometry, vol. 52, pp. 1–30, 2005.
- [21] D. Feldman et al., “Coresets for differentially private k-means clustering and applications to privacy in mobile sensor networks.” in IPSN, 2017.
- [22] A. Palade and et al., “An evaluation of open source serverless computing frameworks support at the edge,” in Services, vol. 2642. IEEE, 2019.
- [23] O. A. Ben-Yehuda and et al., “Expert: Pareto-efficient task replication on grids and a cloud,” in IPDPS. IEEE, 2012, pp. 167–178.
- [24] L. Siksnys et al., “Private and flexible proximity detection in mobile social networks,” in MDM, Kansas City, MO, USA, 2010, pp. 75–84.
- [25] M. Gruteser and D. Grunwald, “Anonymous usage of location-based services through spatial and temporal cloaking,” in MobiSys, 2003.
- [26] E. Cho et al., “An anonymous communication model for privacy-enhanced location based service using an echo agent,” in ICUIMC, 2009.
- [27] B. Hoh et al., “Achieving Guaranteed Anonymity in GPS Traces Via Uncertainty-aware Path Cloaking,” IEEE TMC, vol. 9, no. 8, 2010.
- [28] D. Yang et al., “Modeling user activity preference by leveraging user spatial temporal characteristics in lbsns,” TSMC, vol. 45, no. 1, 2015.
- [29] H. Li et al., “Privacy leakage of location sharing in mobile social networks: Attacks and defense,” IEEE TDSC, 2016.
- [30] R. Ahuja et al., “A utility-preserving and scalable technique for protecting location data with geo-indistinguishability,” in EDBT, 2019.
- [31] L. Yao et al., “Publishing sensitive trajectory data under enhanced l-diversity model,” in MDM. IEEE, 10-13 June 2019, pp. 160–169.
- [32] P. Kalnis et al., “Preventing location-based identity inference in anonymous spatial queries,” TKDE, vol. 19, no. 12, pp. 1719–1733, 2007.