The characteristics of a hydrogenated amorphous silicon (a-Si:H) detector are presented here for monitoring in space solar flares and the evolution of strong to extreme energetic proton events. The importance and the feasibility to extend the proton measurements up to hundreds of MeV is evaluated. The a-Si:H presents an excellent radiation hardness and finds application in harsh radiation environments for medical purposes, for particle beam characterization and, as we propose here, for space weather science applications. The critical flux detection limits for X rays, electrons and protons are discussed.
A Hydrogenated amorphous silicon detector for Space Weather Applications
keywords
space weather, solar energetic particle events, hydrogenated amorphous silicon, solar activity1 Introduction
Space Weather predictions and energetic particle flux monitoring along the orbits of manned and unmanned missions are of paramount importance to preserve astronauts’ health, instrument performance in space, and to limit the damages to Earth infrastructures Christl et al 2009; Armano et al 2018; Armano et al 2019; Grimani et al 2020; Grimani et al 2021; Cid et al 2014; Taioli et al 2023. The flux of galactic cosmic rays (GCRs) with energies above tens of MeV at 1 au is of the order of 0.1 particles cm-2 s-1 Gaisser 1991. The GCR integral flux above 70 MeV/n has been observed to vary by a factor of four near Earth during the last three solar cycles Grimani et al 2021. The overall bulk of observed energetic particles may increase by several orders of magnitude for a few days during gradual solar energetic particle (SEP) events. This increase may occur in less than half an hour in case the solar sources of the events are magnetically well-connected to the point of observations Grimani et al 2009b. Large disturbances of the Van Allen belts associated with the arrival at the Earth of the interplanetary counterparts of coronal mass ejections (ICMEs) and shocks (this last ones also at the origin of SEP acceleration) increase the dose to which are exposed those populations living at high altitude in Bolivia and Argentina in the region of the South Atlantic Anomaly (see Vernetto et al 2022 for a work at other latitudes). Some aspects of the physics of ICMEs and associated SEP events and their impact on astronauts and Earth populations are still poorly investigated, despite the NASA and ESA Parker Solar Probe (Fox et al 2016) and Solar Orbiter (García Marirrodriga et al 2021; Müller et al 2020) missions, among others, are presently in space to study how the Sun creates and influences the heliosphere. Spatial agencies and scientific communities aim at coordinating multi-spacecraft continuous monitoring and near-Earth environment observations to understand the role of the interplanetary particle scattering and transport effects to estimate the impact of individual SEP events in the point of observations. Recently, the widespread events dated November 29, 2020 Kollhoff et al 2021 and October 28, 2021 Papaioannou et al 2022 were observed with Parker Solar Probe, Solar Orbiter, Stereo Kaiser et al 2008, Bepi Colombo Benkhoff et al 2010, GOES/SEISS Kress et al 2020 and CSES-01/HEPD Martucci et al 2023 . These missions returned very different observations in various energy intervals due to different spacecraft orbits. Particle acceleration was observed up to 40 MeV during the November 29, 2020 event while the first ground level enhancement (GLE) of the solar cycle 25 Martucci et al 2023 was associated with the October 28, 2021 event. Consequently, the November 29, 2020 event was scarcely interesting from the point of view of impact on manned and unmanned missions, while this was not the case for the October 28, 2021 event. Multipoint measurements with low-cost, low-weight, low-power-consumption detectors for nanosatellites or long-lived missions in deep space provide precious clues on SEP dynamics, particle acceleration and, possibly, particle pitch angle distribution. We recall that the SEP pitch angle is defined as the angle between the particle velocity and the nominal interplanetary magnetic field vector direction. The majority of solar particle detectors presently hosted onboard space missions aiming at studying various aspects of Solar Physics allow for particle differential flux measurements up to 100-200 MeV. Since the typical amount of matter shielding instruments hosted on board space missions deep in the spacecraft is of the order of 10-15 g cm-2 (approximately equivalent to the stopping power of astronaut suits) Grimani et al 2015; Grimani et al 2021; Grimani 2022, GCR and SEP hadrons with energies below 100 MeV/n play a minor role in the deep charging of spacecraft and dose absorbed by astronauts Christl et al 2009. For completeness of discussion, we recall that some instruments over the years have covered a larger energy range. Between 2006 and 2016, the magnetic spectrometer PAMELA experiment gathered proton and helium differential flux data in a semi-polar elliptical orbit around the Earth above 70 MeV/n during several SEP events Bruno et al 2018, in particular monitored the evolution of the December 13 and December 14, 2006 events Adriani et al 2011. Moreover, some near-Earth instruments such as HEPD on board CSES-01 Bartocci et al 2020, SEISS on GOES and AMS-02 Aguilar et al 2018; Faldi et al 2023 on board the space station presently allow for the measurement of differential fluxes of solar and galactic protons up to 250 MeV, up to 500 MeV and above 450 MeV n-1, respectively. Also EPHIN on board SOHO Kühl et al 2015; Kühl et al 2017 is gathering proton data up to 700 MeV at the first Lagrange point after the mission launch in 1995. The proton differential fluxes measured with EPHIN presents uncertainties well above 30% at hundreds of MeV. Basically all these experiments are gathering data at or near 1 au. The comparison of widespread proton observation timeseries in different energy bins carried out with instruments placed on board distant spacecraft provide precious qualitative information about the propagation of particles. Unfortunately, normalization problems prevent us to infer from these measurements precise differential fluxes. The Solar Orbiter EPD/HET instrument Rodríguez-Pacheco et al 2020; Freiherr von Forstner, Johan L. et al 2021; Mason, G. M. et al 2021; Wimmer-Schweingruber et al 2021 gathers data between 0.28 and 1 au. Despite the HET Collaboration has made efforts to extend the energy range of observations up to 1 GeV, after more than three years since mission launch, data publicly available on the ESA Solar Orbiter archive11 1 https://soar.esac.esa.int/soar/ are limited to 100 MeV energy. The GCR proton data above 100 MeV, kindly provided by the HET Collaboration for September 2020 (private communication), appear higher by approximately a factor of two with respect to those of the AMS-02 experiment Aguilar et al 2021 gathered above 450 MeV during very similar conditions of solar modulation (October 2019). An instrument providing proton flux monitoring up to hundreds of MeV with uncertainties smaller than 30% if placed on board different spacecraft would improve the present observational scenario.
In this work we discuss the possibility to build a new instrument for solar activity and SEP observations up to hundreds of MeV. In particular, we aim at developing a detector in the framework of the INFN HASPIDE (Hydrogenated Amorphous Silicon PIxel DEtectors for ionizing radiation) project, with the sensitive part based on hydrogenated amorphous silicon (a-Si:H). The sensing devices are fabricated via the standard PECVD (Plasma Enhanced Chemical Vapor Deposition), with thickness ranging from hundreds of nanometers to tens of micrometers. The substrate resists to total ionizing doses up to 100 Mrad Srour et al 1999, displacement damage up to a fluence of 1016 1 MeV neutron equivalent cm-2 Menichelli et al 2022 and combined damage up to a fluence of 1016 24 GeV protons cm-2 Wyrsch et al 2006. An instrument based on a-Si:H would improve its response in current for extreme SEP events while silicon detectors reduce their performance if exposed to very high doses Sato et al 2020. Furthermore, the possibility of low-temperature deposition during device fabrication, allows us to use plastic materials like polymmide as substrate. The resulting device will be mechanically flexible, very thin and light-weighted, easily adaptable for curved configurations like cylinders, assuring a large coverage in solid angle.
Several a-Si:H devices have been produced and exposed to different radiation sources: 3 MeV protons, 6 MeV electrons, 6 MV clinical X-ray beams, laboratory X-ray tubes and synchrotron radiation. Preliminary results show a linear detector response in current versus dose-rate, within an uncertainty of 1-2. Besides, these devices can be operated with electric fields of 1.5-4.0 V/m or no bias at all. This latter characteristic is a very important feature for space applications, where power consumption is an important limitation, and for dosimetry in medical physics. These devices, in particular, could be used to equip missions with low-cost piggy-back modules for the monitoring of SEP events from multiple observational points by properly combining active and passive layers of material.
In Section 2 we report the characteristics of SEP events and the present observational scenario. In Section 3 the occurrence and evolution of SEP events is presented. In Section 4 a-Si:H is presented as detection material. In Section 5 the results of preliminary test beams with a-Si:H sensors are discussed. In Section 6 photon, electron and proton detection limits for a-Si:H devices are estimated on the basis of Monte Carlo simulations. Finally, in Section 7 the SEP measurement strategy with a-Si:H devices is illustrated.
2 Solar energetic particles
Impulsive, short-term (hours) and gradual, long-duration (days) increases of solar particles are associated with solar flares and CMEs, respectively. Impulsive events are due to magnetic reconnection on open field lines in solar jets Reames 2021. CMEs are believed to be generated by sudden disruptions of the Sun’s magnetic field. Statistical studies have shown that CMEs with plane of the sky speeds 1000 km s-1 and angular width 120∘ accelerate protons above 20 MeV in more than 90% of the cases, however only a few % of CMEs have speeds in this range Lario et al 2020; Alshehhi and Marpu 2021. The maximum energy of particles accelerated in impulsive events is about 50 MeV Mazur et al 1995. Pure impulsive or gradual events are rare. Often flares and CMEs originate from the same active region of the Sun. The evolution of gradual SEP events is characterized by particle flux rises over a minimum period of half-an-hour for events magnetically well connected to the point of measurement and a slow decay of a few days. A strong increase after a first decay phase observed during the most intense events is due to superposing CMEs and shocks. The majority of solar proton events occurs during years 5-8 of the solar cycle Shea and Smart 2001. It has to be pointed out that, in most cases, SEPs present energies smaller than 10 GeV even if observations of particles with energies as high as 50 GeV and more have been reported in the literature. In particular, integral proton intensities of about 10-5 (cm2 s sr)-1 at energies 500 GeV have been measured for the September 29, 1989, June 15, 1991, and October 12, 1981 GLEs Karpov et al 1997.
The Archimedean spiral pattern of the interplanetary magnetic field generates an asymmetry in the intensity-time profiles of SEP events from eastern and western longitudes on the Sun. In particular, events originating in the western hemisphere of the Sun are more likely observed at the Earth with respect to those from the eastern hemisphere. The properties of SEP profiles associated with gradual events are explained in terms of direct magnetic connection between the shock driven by the ICMEs and the detecting spacecraft. Here and in the following for onset of SEP events we mean the time when the integral flux of particles above several tens of MeV overcomes the background of galactic cosmic rays beyond statistical fluctuations and short-term variations. The peak is when the integral flux is maximum in the same energy range. The time of the onset corresponds to the period when particles are observed at the highest energies and it is believed to correspond to the time at which the shock intercepts the magnetic field lines to the spacecraft, plus the particle propagation time to the spacecraft. The time of the maximum integral flux is believed to be an indication of the time at which the spacecraft is connected to the part of the shock which accelerates the particles more efficiently Dalla et al 2003. Particle acceleration at parallel and perpendicular shocks occurs when the upstream magnetic field is almost parallel or orthogonal to the shock normal, respectively. Parallel shocks are considered to be the main SEP accelerators (see Joyce et al 2021 and references therein). Acceleration at perpendicular shocks, in comparison to parallel shocks, has been discussed in Zank et al 2006, for instance. A particle velocity dispersion is observed during the first phase of the events when particles arrive in inverse order to their velocity (an electron flux increase is observed before a proton flux increase), while identical time profiles are observed during the final part of the event. During gradual, magnetically well connected events, particles accelerated beyond 1 GeV are detected within tens of minutes after the visual recognition of the event on the Sun. Low-energy particles appear in increasing numbers during the evolution of the event while the high energy particles fade away. For many years all our knowledge on solar phenomena was acquired from the viewpoint of the Earth that moves between 7.25∘ in heliolatitude. The comparison of Ulysses Wenzel et al 1992; Issautier et al 2008, STEREO A and STEREO B Lario et al 2013, Helios 1 and 2 Lario et al 2006; Qin and Wang 2015 and more recently Parker Solar Probe, Solar Orbiter and Bepi Colombo observations, along with near-Earth data have provided precious clues about SEP propagation as a function of solar latitude, longitude and distance from the Sun.
Due to the paucity of instruments in space devoted to the detection of particles with energies larger than 100-200 MeV and the importance to measure SEP fluxes from MeV to the highest possible energies, we aim at building a robust detector to be hosted on long-duration missions in deep space or in harsh environments such as the Van Allen belts for the monitoring of strong-to-extreme SEP events and for the study of the effects of the Van Allen belt discharging due to ICME transit Zhao et al 2019; Adriani et al 2015.
3 Solar energetic particle event occurrence and forecast
The SEP event average occurrence as a function of fluence and solar activity can be estimated according to the Nymmik’s model Nymmik 1999a; Nymmik 1999b. The impact of ICMEs and SEP events on manned and unmanned space missions and Earth infrastructures must be studied on the basis of both particle fluence and flux. As a matter of fact, events with the same fluence can be associated with particle fluxes differently populated at high energies.
3.1 X-ray and electron emission from the Sun for SEP event forecast
Observations of strong emissions of soft X rays and near-relativistic electrons from the Sun can be used to forecast SEP events García-Rigo et al 2016; Núñez, Marlon 2018. In Fig. 1 we have reported the measurement of the X-ray spectrum carried out by the RHESSI experiment Grigis, P. C. and Benz, A. O. 2004; Benz 2017 during a class M flare dated November 9, 2002. This observation is used in the following as a benchmark for the performance of the instrument we propose.
Interplanetary electrons consist of several components Grimani et al 2009b. At steady state, below 30 MeV the majority of electrons are accelerated in the Jovian magnetosphere. The dot-dashed and continuous lines in Fig. 2 represent the minimum and maximum fluxes of electrons of Jovian origin near Earth. The Jovian electron flux change is due to the varying distance between Earth and Jupiter during the Jovian synodic year. Above 30 MeV electrons are mainly galactic. The dashed line above 30 MeV represents the maximum component of galactic electrons near Earth observed at solar minimum during negative polarity periods of the global solar magnetic field. During SEP events, relativistic electrons reach the point of observations always before non-relativistic ions. According to Posner Posner 2007 (see also Grimani et al 2009a), for events with intensities larger than 10 protons (cm2 sr s)-1 above 10 MeV, relativistic MeV electrons and non-relativistic 50 MeV proton fluxes show similar time profiles even though at different times due to the higher velocity of the electrons. Posner points also out that if the proton increase is not observed after 2-3 hours from electron increase, then it will not be observed at all. The top solar electron energy spectrum (dashed line) in Fig. 2, characterized by two different spectral indices, represents the electron flux of solar origin observed during the impulsive solar event dated September 7, 1973. The dotted line represents the energy spectrum of electrons observed during the gradual event dated November 3, 1973. Only one electron flux spectral index is observed during gradual events resulting from a process of shock acceleration. The dashed and dotted lines were obtained from data interpolation (see Grimani et al 2009b, for details).
3.2 Solar proton energy spectra
The observed energy spectra of solar particles vary during the evolution of the events, as a consequence of particle acceleration and propagation in the interplanetary medium. In particular, the majority of SEP energy spectra above tens of MeV show an exponential trend during the prompt phase and a power-law trend during the late phases of the majority of events (for a detailed study of the evolution of several SEP events evolution see Grimani et al 2013). The comparison of the proton timeseries in different energy bins allow us to study the arrival of particles as a function of their energy. For this kind of study any observation, above the galactic cosmic-ray background, provides precious clues on the particle propagation process and the qualitative comparison of data gathered with different spacecraft is meaningful. Nevertheless, to estimate spacecraft deep charging and instrument performance with Monte Carlo simulations, it is necessary to monitor the high-energy differential flux of particles versus time. Moreover, in order to obtain plausible results from the simulations, the uncertainty on the high-energy particle flux, which is the part of the flux that impacts the most in terms of deep charging and dose-rate release, must be kept low. The effort of comparing observations gathered with different instruments, in general, is unsuccessful due to particle flux normalization issues. To this purpose, in order to estimate the number of photons and particles that the instrument we propose may observe, in the following we privilege the flux of particles measured by single instruments, if possible. In particular we consider the energy spectra of solar protons associated with the evolution of SEP events dated February 23, 1956 Vashenyuk et al 2007, December 13, 2006 Adriani et al 2016, and October 28, 2021 Papaioannou et al 2022 as case studies. The proton spectra parameterizations at the onset and at the peak of the February 23, 1956 event are provided in the original paper Vashenyuk et al 2007, while for the December 13, 2006 event the reduced has been calculated on the basis of the data reported in the cosmic-ray database of the Italian Space Agency22 2 https://tools.ssdc.asi.it/CosmicRays/. For the event dated October 28, 2021, it is pointed out that the data and uncertainties of the EPD/HET instrument are reported on the Solar Orbiter archive. Within data uncertainties (100%) the fits present an excellent agreement. The best fits through the data during the different phases of each event were found by considering exponential, power-law and power-law with an exponential cut-off functions according to Grimani et al 2013. The results are shown in Table 3.2.1.
3.2.1 The February 23, 1956 SEP event
The SEP event dated February 23, 1956 was associated with the GLE 5 when neutron monitor (NM) counting increased by about 5000% Vashenyuk et al 2007.
This is the most intense event observed during the last seventy years characterized by particle acceleration above 2 GeV. The event onset was observed with NMs at 04:00 UT while the decay phase was detected at 06:00 UT. The fitting functions at the onset and at the peak of the event appear in Figs. 3 and 4 and in Table 3.2.1.
| \toprule | ndof | |||
| \midrule February 23, 1956 (inferred at the top of the atmosphere from NM data) | ||||
| \midrule 4:00 UT | - | - | ||
| 4:30 UT | - | - | ||
| \midrule December 13, 2006 (Pamela satellite experiment) | ||||
| \midrule 3:18-3:49 UT | 1.26 | 41 | ||
| 4:33-4:59 UT | 1.72 | 37 | ||
| \midrule October 28, 2021 (Solar Orbiter/HET instrument) | ||||
| \midrule 15:35-16:35 UT | 0.0050 | 7 | ||
| 0.0084 | 6 | |||
| - | - | |||
| 1.12 | 7 | |||
| 17:30-18:20 UT | 0.0012 | 7 | ||
| 0.0044 | 5 | |||
| - | - | |||
| 2.0344 | 12 | |||
| 20:35-22:35 UT | 0.0093 | 5 | ||
| 0.0021 | 6 | |||
| 0.0007 | 1 | |||
3.2.2 The December 13, 2006 SEP event
The measurements of SEP events carried out on December 13 and December 14, 2006 with the PAMELA low-Earth orbit satellite experiment covered the range of energy 70 MeV-2 GeV Adriani et al 2011 with an unprecedented accuracy. In Figs. 3 and 4 we have reported the onset and peak proton fluxes (light blue dots) associated with the strongest of the two events dated December 13, 2006. The fitting functions of the proton fluxes measured during this event are also reported in Table 3.2.1. The reduced () and the number of degrees of freedom (ndof) for each function appear in the same Table. The event dated December 14 was very weak and it is disregarded here.
3.2.3 The October 28, 2021 SEP event
On October 28, 2021 a SEP event was detected by several spacecraft at different distances from the Sun, by near-Earth space missions and with NMs, after using cosmic-ray nuclear transport in the atmosphere Papaioannou et al 2022. The atmosphere does not stop secondary particles only if primary cosmic rays have energies larger than 500 MeV. Protons accelerated above 2 GeV were associated with this event. In Fig. 5 we have shown the proton flux measured during the evolution of this event. Data below 100 MeV were gathered by the EPD/HET particle detector hosted on board the Solar Orbiter spacecraft that was almost lined up with Earth. HET data at the onset (small dots), at the peak on Earth (small triangles) and at the peak in space (small squares) are compared to data estimated with NM observations at the onset (large dots) and at the peak at the top of the Earth atmosphere (large triangles). No GLE was observed at the time of the peak observed in space (small squares). In other words, the peak of the event observed in space was associated with particles with energies smaller than 500 MeV. These observations reveal the importance of monitoring SEP events in space up to at least hundreds of MeV since this is the energy range of maximum interest to Space Weather. We have best fitted the data with broken lines where a unique function was not reproducing well the trend of the observations. The parameterizations of the proton energy spectra are reported in Table 3.2.1 with the reduced and number of degrees of freedom. Reasonable interpolation functions have been used to fill the gaps of missing data.
In Figs. 6 we have reported the October 28, 2021 SEP data at the onset of the event. The HET data have been parameterized between 50 MeV and 100 MeV (blue line), between 50 MeV and 400 MeV (red line) and between 50 MeV and 600 MeV (black line). Above 100 MeV the interpolation values obtained by considering the high-energy NM measurements extrapolated at the top of the atmosphere (light blue line) were used as input data. It is possible to notice that, in this last case, a quite good agreement with data is found up to 1 GeV when galactic cosmic rays overcome those of solar origin at solar minimum.
In Fig. 7 we report the observations gathered by HET during the peak of the event in space (small light blue dots) and on Earth with NM observations extrapolated at the top of the atmosphere (large light blue dots) during the same event. The proton peak in space is parameterized up to 600 MeV. Also in this case, by including in the parameterization the data up to 400 or 600 MeV, a better agreement is found (Fig. 7). In conclusion, in order to carry out reliable estimates of SEP fluxes at GeV energies, low uncertainty differential flux measurements between 50 MeV and 400-600 MeV are needed. This explains and motivates our maximum effort to design and build a new instrument to measure SEP fluxes in space up to hundreds of MeV.
4 a-Si:H as detection material
Hydrogenated amorphous silicon has been used since many years in the fabrication of devices related to optoelectronics, such as solar cells, thin-film transistors and other applications Street 2000. Several methods have been proposed for the preparation of device-grade a-Si:H but the PECVD method is the most widely used due to its capability to consistently prepare uniform, high-quality materials on a large-area substrate Matsuda 2017. The amorphous silicon is a material highly resistant to ionizing radiation damage due to its intrinsic disordered nature, but to obtain a detector grade device is necessary to reduce the number of dangling bonds inside the material. This is done by introducing H into the material to passivate dangling bonds hence reducing defects and recombination centers. The minimum amount of H necessary to passivate most of the dangling bonds is about 1% atomic. The increase of H content enlarges the bandgap hence reducing the background current of the device, and 14% is the typical value to obtain a detector grade device Wyrsch and Ballif 2016. The bandgap depends also on the deposition conditions such as the temperature. Typical deposition temperature should range between 100 ∘C (to reduce the number of defects in the material) and 350 ∘C (to avoid desorption of H), and normally occurs around 200 ∘C Matsuda 2017. This interval of processing temperature allows for the deposition of layers or devices on a variety of substrates, among which thin layers of plastic materials like polymmide Söderström et al 2008; Menichelli et al 2023. The capability of depositing small area devices over a flexible and thin substrate opens the possibility to several applications in different fields among which: instrumented flange at the vacuum/air separation of charged particle accelerators and transmission detectors for dosimetry of real dose delivered to patients by clinical beams in radiotherapy, by considering curved or bent small thickness devices of almost any geometrical shape suitable also for space applications.
Within the research program of the HASPIDE project several non-optimized devices have been fabricated and tested both with and without ionizing radiation beams. Fig. 8 shows 4 diodes of 4x4 mm2 area and 8.2 m thickness deposited within the same fabrication batch.
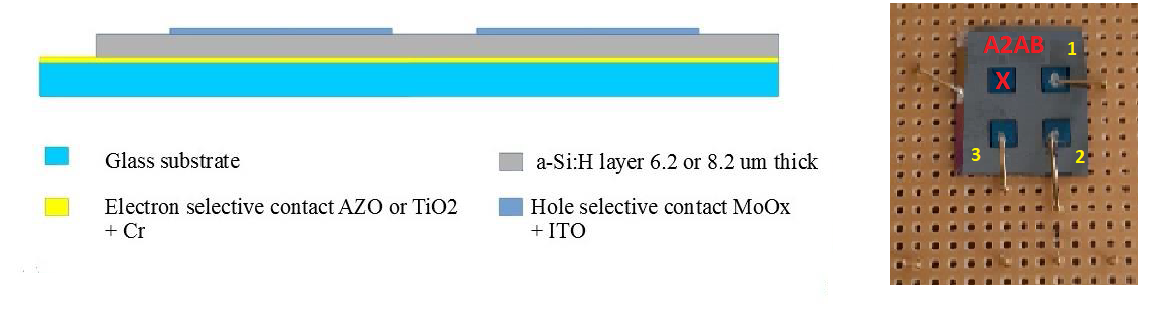
Two types of contacts have been used: standard p-i-n diodes, with the two contact layers, respectively p-doped (with B atoms) and n-doped (with P atoms), separated by the a-Si:H intrinsic layer and Charge Selective Contacts (CSC) where for the two contact layers are used metallic oxides, MoOx for hole contacts and TiO2 or ZnO:Al (AZO) as electron contacts, to produce different mobility values for electrons and holes Menichelli et al 2022. The devices are biased and readout by a precision source meter to record the current with a measurement frequency of 1 Hz.
An important property for the foreseen medical and space applications is the capability of devices to work at 0 V bias. Both contact options allow in principle for this feature that should be thoroughly investigated.
5 Tests of a-Si:H devices with photon, electron and proton beams
Several devices, both p-i-n diode and CSC have been characterized for noise, leakage current and with ionizing radiation beams at several facilities: X-ray photons (tube voltage up to 50 kV), 6 MV clinical photon beams, 6 MeV electron beams and 3 MeV proton beams Menichelli et al 2022; Menichelli et al 2021.33 3 Facilities used for beam tests: for photons below 50 keV see Menichelli et al 2023. For photons in the MeV range: ANSTO Melbourne, https://www.ansto.gov.au/facilities/australian-synchrotron. For protons: CEDAD Brindisi, http://www.cedad.unisalento.it/. For electrons: https://www.sbsc.unifi.it/.
The procedure for measuring the current signals from a device under test is: (i) start the data acquisition with no irradiation to measure the leakage current, (ii) irradiate the sensor (with X-ray photons, for instance), and finally (iii) measure again the background noise, after irradiation.

The uncertainty on current measurements (packaging included), is determined from the distribution of the measurements when the beam is off (red peak in Fig.9) and on (green peak in Fig.9). The distribution for the device under test shows a background current of the order of 20 pA with a noise of 10 pA including the contribution of the non-optimized setup, while in the presence of the X-ray beam the current rises up to hundreds of pA while the noise increases marginally (12 pA) including both the sensor response uncertainty and the beam stability. The current signal, due to the exposure of a device to radiation, is obtained by subtracting the background current, measured before the beam is switched on, from the measurement carried out after stabilization.
The homogeneity of devices produced in the same production batch follows from the deposition procedure and is 20 at worst for diodes in Fig. 8, reaching also 5 for more recent batch of diodes deposited on kapton. The variance for the entire bias range is smaller than 20, ensuring that the same readout chain would work for all devices after inter-calibration Menichelli et al 2023; Large et al 2023.
For this work, it is important to evaluate the detection limit of the signal, by determining the measurement uncertainty. This evaluation is carried out by looking at the fluctuations of the background current that is influenced by the setup and the measurement instrumentation. During the testing campaign we have found that the current noise ranges between 2 and 10 pA, depending mainly on the measurement setup rather than on the sensor characteristics. In the following we will adopt 5 pA as a reasonable average value of the whole testing campaign and as a worst case of the most recent optimized results (see Table 2).
| \topruleSensor Name | PAD(V2,V4) | A2AB1 | A3AC2 | UOW429 | |
|---|---|---|---|---|---|
| \midruleContact type | p-i-n | CSC | CSC | p-i-n | |
| Area [mm2] | 0.5x0.5 | 4.0x4.0 | 4.0x4.0 | 5.0x5.0 | |
| Thickness [m] | 10.0 | 6.2 | 8.2 | 10.0 | |
| Noise level [pA] | 2.0 | 8.0 | 5.0 | 2.5 |
If we define the detection limit at 5 for a typical device, this would imply 25 pA of minimum current signal.
Fundamental properties for the present study of a-Si:H meant for Space Weather application are the device noise, the linearity of the response to the ionizing radiation flux and the device sensitivity, i.e. the current signal associated with a given amount of deposited energy. The linearity has been measured using several devices (pixel, strips, pad) with different contact types (CSC or p-i-n) (see Table 2) over a variety of beam types. As an example, Fig. 10 shows the relation between dose-rate (measured using a certified dosimeter) and signal for a CSC device of 4x4 mm2 area, 8.2 m thickness for two potential bias values of 0 V (blue) and 20 V (red) and irradiation with an X-ray beam. See also Menichelli et al 2022. The two bias values represent a reasonable range for thin devices.

The linearity of the response over the dose-rate range is on average within 1.6 for both biases, with a maximum distance from the fit of 5 for low dose rate values. The sensitivity varies from 657 pA cGy-1 s-1 (20 V bias) to a value of 52 pA cGy-1 s-1 (0 V bias), one order of magnitude less. Since the current noise has been assumed of 5 pA, if the measurement threshold is set at 5, the minimum energy deposition that we could measure varies from 0.4 mGy s-1 for 20 V bias to 0.5 cGy s-1 for 0 V bias operation. Similar results were obtained for p-i-n devices and are available in Menichelli et al 2021. Table 3 reports the results obtained with several sensors exposed to different ionizing radiation beams.
| \topruleIonizing | Sensor | Bias | Sensitivity | 5 detection | Linearity |
| Radiation | Name | [V] | [nC cGy-1] | value [cGy] | [%] |
| \midrule X-ray | A2AB1 | 0.0 | 0.052 | 0.260 | 1.6 |
| 50 kV X-ray | A2AB1 | 20.0 | 0.657 | 0.040 | 1.6 |
| 50 kV X-ray | A3AC2 | 30.0 | 2.040 | 0.045 | 1.0 |
| Clinical (6 MV) | UOW429 | 0.0 | 0.049 | 0.245 | 1.5 |
| e- 6 MeV Clinical | UOW429 | 0.0 | 0.065 | 0.325 | 1.5 |
| Protons 3 MeV | PADV2 | 20.0 | 0.025 | 0.400 | 5 |
| Protons 3 MeV | PADV4 | 20.0 | 0.030 | 0.330 | 5 |
From the collected data we could draw some conclusions:
- •
both CSC and p-i-n devices grant a sufficient sensitivity for radiation measurement ( tens of pC cGy-1) coupled with a low noise ( 10 pA);
- •
the potential bias is an important parameter to increase the sensitivity, as expected.
6 Estimate of detection limits for a given a-Si:H device
In this paragraph, we consider the performance of a realistic a-Si:H device to estimate the minimum detectable flux of different ionizing radiation types associated with solar flares to obtain a signal-to-noise ratio (S/N) ratio 5, in the first instance.
For this exercise we use a ”virtual” device with characteristics similar to those reported in Table 2: 4x4 mm2 area, 10 m thickness and 5 pA current noise. The geometrical factor of such a device is 0.5 cm2 sr. To increase both geometrical factor and sensitivity, we may choose, for instance, to build a single, large device with an area 25 times larger than a single device, 20x20 mm2, or to arrange a bi-dimensional array of 25, 4x4 mm2 devices read out in parallel. In the following, we indicate both these equivalent solutions as H-SPACE. The final option for the H-SPACE design would depend most likely by the noise measured for the whole system of measurements.
The leakage current of the devices increases with the area, while the current noise increases with the square root of the area. Therefore, for the evaluation of particle detection thresholds, we plausibly assume that the noise of the H-SPACE device scales by a factor equal to the square root of the ratio of the area with respect to that of the small device, i.e. by a factor of 5. This leads to a noise of 25 pA and consequently to 125 pA limit for the 5 detection level. Using the measured sensitivity of the device A3AC2, as a reference, and converting the dose-rate in deposited energy per second, a deposited energy of 105 MeV/s is the lower limit to obtain a S/N , while a S/N of 1 is reached for 21 MeV/s energy deposition. For the present preliminary design of our instrument we aim at estimating the dose-rate and associated current generated by incident solar energetic particles on the a-Si:H devices. Future developments of our a-Si:H sensors and electronics may allow us to measure single particles, but this will be matter of future improvements. To convert the current measurements in particle fluxes we will benefit of Monte Carlo simulations and beam tests. Multiple sensors to cover different portions of solid angles may be of great help in space. It is worthwhile to point out that the sensitivity of the H-SPACE devices is expected to improve in the future during the R&D campaign foreseen for the HASPIDE project. For the present exercise, the charged particle energy loss distribution in the H-SPACE device represents a lower limit with respect to actual energy losses , since only particles with normal incidence on the sensor area are considered, condition that strictly applies to photons only.
In the following, we simulate the H-SPACE device performance using the FLUKA Monte Carlo program Battistoni et al 2014; Böhlen et al 2014; Vlachoudis 2009. For the moment, we have taken into consideration the characteristics of a-Si:H by decreasing by 10% the density of c-Si and consequently, the number of electrons produced per unit length and per unit energy that is proportional to the to the material density Workman et al 2022.
6.1 Photon rate detection limits
The current signal generated by photons incident on the detector depends strongly on the photon energy distribution that sets the photon interaction probability in the sensitive material and, due to the small thickness of the a-Si:H layer, depends also on the partial containment of photoelectrons or Compton electrons.
Photon fluxes observed during solar flares are mainly populated below 10 keV Grigis, P. C. and Benz, A. O. 2004; Benz 2017 (see Fig. 1). Consequently, we focus on photons in the energy range 3-20 keV for which the photoelectric effect is the dominant process occurring within the a-Si:H sensitive volume.
In Table 4 we have reported the average energy deposition and the minimum rate of incident photons needed for detection for several photon energies in the range 3-20 keV. Since the current measurements are expected to be carried out at 1 Hz, the minimum required energy deposition per second by photons of given energy is estimated. It can be observed that, as the photon energy increases, the number of photons needed for a 5 detection increases, due to decreasing interaction probability of photons within the a-Si:H device and, to a smaller extent, to the increasing difficulty to contain all the energy of the photo-electrons. The percentage of interacting photons are also reported in Table 4. As an example, Fig. 11 shows the distribution of energies deposited by 10 keV photons traversing the H-SPACE device. Taking the 105 MeV energy deposition threshold set above, the detection limit of 10 keV photons reaching the device in order to obtain a S/N ratio of 5 is 1.4 105 s-1. By considering these results and by integrating the photon flux reported in Fig. 1 for the class M flare dated November 9, 2022 between 7 and 16 keV, it is found that the detection limit is met at 4 in this energy range in the H-SPACE device with the main contribution given by 7-10 keV photons. The reduction of the photon energy range of measurements to 5 keV, would obviously improve the detection capability of this or stronger (class X) solar flares.
| \topruleEnergyγ | Energydeposited | Interacting photons | Minimum photon rate detectable |
|---|---|---|---|
| (keV) | (keV) | (%) | with HASPIDE-SPACE (photons/s) |
| \midrule3.0 | 3.0 0.3 | 0.87 | 4.0104 |
| 5.0 | 4.9 0.4 | 0.40 | 5.4104 |
| 7.0 | 6.9 0.6 | 0.18 | 8.5104 |
| 8.0 | 7.8 0.8 | 0.13 | 1.0105 |
| 10.0 | 9.7 1.3 | 0.08 | 1.4105 |
| 15.0 | 14.0 3.1 | 0.04 | 3.8105 |
| 20.0 | 17.5 5.6 | 0.009 | 6.7105 |
6.2 Electron rate detection limits
Experimental results on electron energy deposits in thin silicon layers are reported in Meroli et al 2011; Dourki et al 2017. Table 5 summarizes the simulation results for deposited energy and minimum number of detectable electrons per second incident perpendicularly on the H-SPACE sensor surface. Looking at the solar electron energy spectra down to 200 keV reported in Fig. 2 (for energies below 200 keV see for instance Dresing et al 2020), we simulate the 50-1000 keV energy range because higher energy particles give a negligible contribution to the current signal. As an example, Fig. 12 shows the deposited energy distribution obtained for 200 keV electrons. The average is 5.7 keV despite the distribution is populated up to 200 keV.
| \topruleEnergy | Deposited Energy | Minimum electron rate detectable |
|---|---|---|
| (keV) | (keV) | with HASPIDE-SPACE (electrons/s) |
| \midrule50.0 | 28.9 16.0 | 3.6103 |
| 100.0 | 12.1 13.4 | 8.7103 |
| 200.0 | 5.7 7.3 | 1.8104 |
| 250.0 | 4.7 5.6 | 2.2104 |
| 300.0 | 4.1 4.7 | 2.6104 |
| 500.0 | 3.3 3.7 | 3.2104 |
| 1000.0 | 2.8 3.3 | 3.8104 |
The simulation results clearly show that the minimum electron rate required for detection can be obtained by measuring low-energy electrons that deposit large amounts of energy in the device. By integrating the electron flux in the range 200-250 keV and by taking into account the H-SPACE geometrical factor, we obtain electrons/s. This result is unsatisfactory for solar electron detection being the S/N ratio . However, in Dresing et al 2020 it is shown that below 100 keV the solar electron energy spectrum maintains a power-law or a broken power-law trend with respect to higher energies. In principle, by extending the electron measurements down to 50 keV, a factor of more than 2.5 in the deposited energy and more than a factor of 5 in particle flux would be gained. We will evaluate, by comparing Monte Carlo simulations and beam-test results, how the S/N ratio for electron detection may increase with respect to the background of other particles.
6.3 Proton rate detection limits
In Table 6 we have reported the average values of the energy losses of protons of different energies incident perpendicularly on the H-SPACE sensitive area. The minimum proton rate needed for detection with a S/N ratio of 5 is also reported. As in the case of photons and electrons, Table 6 shows how the minimum detectable proton rate with S/N 5 varies with proton energy. For our proposal it is important to have the possibility to monitor solar protons between 3 MeV (Fig. 13) and 400 MeV (Fig. 14).
The average energy deposits vary between 5.1 keV and 289.5 keV. This means that the needed number of protons/s crossing the H-SPACE device to have a S/N = 5 scales by the same factor.
| \topruleEnergy | Deposited Energy | Minimum proton rate detectable |
|---|---|---|
| (MeV) | (keV) | with HASPIDE-SPACE (protons/s) |
| \midrule3.0 | 289.5 19.5 | 3.6102 |
| 5.0 | 141.5 14.5 | 7.4102 |
| 10.0 | 75.6 14.5 | 1.4103 |
| 20.0 | 43.1 24.9 | 2.4103 |
| 50.0 | 21.0 34.5 | 5.0103 |
| 70.0 | 16.3 35.1 | 6.4103 |
| 100.0 | 12.4 30.7 | 8.5103 |
| 200.0 | 7.6 30.8 | 1.4104 |
| 400.0 | 5.1 35.2 | 2.1104 |
| 600.0 | 4.3 40.4 | 2.6104 |
We use Table 6 to evaluate the detection capability of the H-SPACE sensor for the SEP events reported in Table 3.2.1 and Figs. 3-7:
- •
February 23 1956: Fig. 3 shows the measured proton spectrum at the onset; by integrating the spectrum in the 500-700 MeV range of measurement availability, we obtain 224 protons/s across our device at the onset. FLUKA simulations associate to this proton flux an average energy deposit of 963 keV, i.e. undetectable. Of course in space also lower energy particles would be measured.
- •
February 23 1956: Fig. 4 shows the spectrum at the peak. For the same energy bin as above we obtain 55250 protons/s corresponding to 238 MeV, i.e. a S/N ratio of 2.3 and therefore, within possible detection range. For GCR/SEP discrimination, detection limits of 2.5-3 will still retain the capability to discriminate the SEP dynamics from noise.
- •
October 28, 2021: for this event data down to a few MeV are available on the Solar Orbiter archive. Fig. 5 shows the measured proton flux at the onset (black dots). If we consider the energy bin 80-100 MeV where the spectrum is more populated, by integrating the data, we obtain 10 protons/s crossing the H-SPACE device, corresponding to 0.15 MeV/s of deposited energy, i.e. the event would not be detected;
- •
October 28, 2021: Fig. 5 shows the measured proton fluxes at the peak (black squares). If we consider again the energy bin 80-100 MeV for the peak, integrating the data, we obtain 142 protons/s, corresponding to 2.0 MeV/s of deposited energy. Also in this case the event would not be detectable.
- •
Similar results would be obtained for the December 13, 2006 event, characterized by a similar intensity with respect to that of the event dated October 28, 2021.
In conclusion, with just one layer of the H-SPACE device we would be able to detect SEP proton fluxes above hundreds of MeV only at the peak of extreme, rare events with a S/N ratio 3.
7 A tentative demonstrator and measuring strategy
Our future work will be aimed at showing that a demonstrator consisting of active and passive layers of sensors and material, respectively, may be built to monitor solar flares and the evolution of medium-strong SEP events in space. The separation of different particle species and photons and the attempt to measure the differential flux of protons, will critically depend on the timing of the arrival of photons, electrons and protons at the instrument. X rays will arrive first and will stop in the first plane of sensors. The superposition of arrival of relativistic electrons and protons will follow, but the current that we will measure in each sensor plane will be different for electrons and protons due to the different penetration characteristics of the two kind of particles through the layers of passive material of various thickness. In the first plane we will observe electrons and protons. Deep in the detector, we will measure the current associated with the passage of protons only through a varying number of sensitive planes, depending on particle’s energy. At present time, we would not be able to follow the onset of even strong SEP events, but we should at the peak when the particle energies decrease. To improve the instrument performance we will count on a very long campaign of beam tests with photons in the keV range, electrons in the MeV range and protons of different energies. The experiment data will be reconciled with Monte Carlo simulations. We will simulate the performance of our instrument from flare detection through the arrival of protons on the basis of real event observations. Basically, following the approach described in Klein et al 2022 for the October 28, 2021 event.
7.1 Soft X-rays
A device capable of photon detection at 4 for energies above 5 keV could be built given the available deposition techniques of a-Si:H on kapton substrate Menichelli et al 2023 by considering also a deposition of a metal layer of hundreds of nm on top the sensors for visible light shielding. To further increase the detection power of the device, we could use identical sensitive layers to sum up the current signals in coincidence.
7.2 Electrons
For one same event, electrons will arrive at the sensor typically after tens of minutes with respect to photons, hence, in principle, we could use the same device used for photons for the detection of these particles down to 50 keV. Detailed Monte Carlo simulations, validated by test-beam measurements, will be carried out to estimate precisely the current signal needed for electron detection as a function of the thickness of the material to be placed in front of the sensitive a-Si:H region and of the thickness of the substrate (300 nm may be feasible).
7.3 Protons
Special care will be needed to measure the energy spectra of solar protons. In section 3.2.3, we have pointed out that a detector able to measure solar protons up to 400 MeV during medium-strong events will allow us to reliably estimate the particle differential flux up to GeV energies above the background of GCRs. From table 6 we observe that by reducing the proton energy in the instrument we will improve sensibly the S/N ratio. The technique of proton energy degradation using layers of passive material is well known and applied in several domains. Hence we propose to use layers of passive material (typically tungsten44 4 https://www.nist.gov/pml/stopping-power-range-tables-electrons-protons-and-helium-ions) to obtain two results at once: to degrade the energy of the protons and absorb the protons ranged down in energy, in order to be able to measure the proton differential flux up to 400 MeV energy. Since 50 keV electrons and hundreds of MeV protons have similar speeds, these particles will reach the instrument at the same time. However, because of the very different capability of propagation in the passive material of these electrons and protons, we will be able to separate the two different particle species.
To estimate the proton fluxes, the current measurements will be converted in number of protons penetrating different layers of passive material. For this achievement, we will use both Monte Carlo simulations and beam tests. In particular, due to the varying spatial distribution of solar particles during the evolution of the SEP events and to the particle interactions in the passive material, the instrument will be tested at different angles of incidence of the beam. Adding single sensors in space to cover the solid angle (with zero bias) around the main instrument may also help. The instrument should contain approximately 8 cm of tungsten to stop 75% of 400 MeV protons incident perpendicularly. The typical weight and power consumption for a radiation monitor are 1 kg and 1 W, respectively Desorgher et al 2013. In order to limit the role of particle crossing the instrument on the side, we need to use extra passive material surrounding the sensitive part of the instrument and consequently we may need to drop the strict requirement of 1 kg on the weight while the power consumption may remain competitive by limiting the power bias to a few V. The actual limits will be set on the basis of the constraints of the possibly assigned space mission. The number of sensitive planes mounted between slabs of tungsten of different thickness and passive material surrounding the a-Si:H sensors will be optimized with future Monte Carlo simulations.
7.4 a-Si:H device improvements
A boost for the detection capability of sensitive layers of our instrument could come from the R&D program presently in progress. We may evaluate to:
- •
increase the sensor surface: we expect a linear increase of current signal and a noise increasing with the square root of the device area;
- •
increase the sensor thickness; a thickness of 30 m is possible, for a gain factor of 3;
- •
noise reduction below 1 pA: we are currently developing a readout chip in 28 nm technology; this is expected to reduce the noise by a factor 2-5;
- •
increase sensitivity: we are experimenting different contact types and also different deposition techniques with a possible gain factor of 5.
Finally, the optimization of the detector design, the estimate of the final geometrical factor, the number of detector units to be adopted should be assessed on the basis of the aims of the mission hosting the instrument. In case the instrument would be aimed at monitoring extreme SEP events (fluence larger than 108 protons/cm2), one unit with a first special layer to detect X-ray and electrons followed by 4 sensitive and 4 passive layers for a total of not less than 8 cm thickness; to monitor the evolution of strong to medium intensity events (similar to the event dated December 13, 2006), several units could be considered to increase the geometrical factor by not less than a factor of 40. Finally, at least four instruments observing different solid angles with respect to spacecraft-Sun direction should be considered to study the SEP pitch angle.
8 Conclusions
In this work we have reported a preliminary study of an instrument based on a-Si:H as active material for solar photon, electron and proton monitoring. We have demonstrated that proton measurements up to 400 MeV range allow us to reasonably extend the parameterization of SEP data above 1 GeV which is the energy range of major interest for Space Weather. At the moment this is feasible at the peak of extreme events only. Future, dedicated Monte Carlo simulations and R&D activities will lead to an optimization of the detector design. This preliminary investigation represents the basis of an effort to respond to future space agencies calls for the development of innovative space-based instruments.
Acknowledgments
We are grateful to the anonymous referee for his/her very constructive comments that allowed us to substantially improve our manuscript. The HASPIDE project is funded by INFN through the CSN5 and was partially supported by the “Fondazione Cassa di Risparmio di Perugia” RISAI project n. 2019.0245. F. Peverini has a PhD scholarship funded by the PON program.
Declarations
- •
Funding The HASPIDE project is funded by INFN through the CSN5 and was partially supported by the “Fondazione Cassa di Risparmio di Perugia” RISAI project n. 2019.0245.
- •
Conflict of interest/Competing interest
The authors declare that they have no conflict of interest.
Ethics approval ’Not applicable’
Consent to participate ’Not applicable’
Consent for publication ’Not applicable’
Availability of data and materials All data mentioned in the paper are publicly available.
Code availability Code is available upon request
Authors’ contributions Conceptualization: Catia Grimani, Leonello Servoli; Methodology: Leonello Servoli, Mattia Villani, Federico Sabbatini, Catia Grimani, Lucio Calcagnile, Anna Paola Caricato, Maurizio Martino, Giuseppe Maruccio, Anna Grazia Monteduro, Gianluca Quarta, Silvia Rizzato; Formal analysis and investigation: Leonello Servoli, Catia Grimani, Mattia Villani, Federico Sabbatini, Roberto Catalano, Giuseppe Antonio Pablo Cirrone, Tommaso Croci, Giacomo Cuttone, Luca Frontini, Maria Ionica, Keida Kanxheri, Matthew Large, Valentino Liberali, Giovanni Mazza, Mauro Menichelli, Arianna Morozzi, Francesco Moscatelli, Stefania Pallotta, Daniele Passeri, Maddalena Pedio, Marco Petasecca, Giada Petringa, Francesca Peverini, Lorenzo Piccolo, Pisana Placidi, Alberto Stabile, Cinzia Talamonti, James Richard Wheadon; Writing - original draft preparation: Catia Grimani, Leonello Servoli; Writing - review and editing: Mattia Villani, Federico Sabbatini, Michele Fabi, Lucio Calcagnile, Anna Paola Caricato, Roberto Catalano, Giuseppe Antonio Pablo Cirrone, Tommaso Croci, Giacomo Cuttone, Sylvain Dunand, Luca Frontini, Maria Ionica, Keida Kanxheri, Matthew Large, Valentino Liberali, Maurizio Martino, Giuseppe Maruccio, Giovanni Mazza, Mauro Menichelli, Anna Grazia Monteduro, Arianna Morozzi, Francesco Moscatelli, Stefania Pallotta, Daniele Passeri, Maddalena Pedio, Marco Petasecca, Giada Petringa, Francesca Peverini, Lorenzo Piccolo, Pisana Placidi, Gianluca Quarta, Silvia Rizzato, Alberto Stabile, Cinzia Talamonti, James Richard Wheadon, Nicolas Wyrsch; Funding acquisition: Leonello Servoli; Resources: ; Supervision: Catia Grimani, Leonello Servoli.
References
- Adriani et al (2011) Adriani O, Barbarino GC, Bazilevskaya GA, et al (2011) Observations of the 2006 December 13 and 14 Solar Particle Events in the 80 MeV n-1-3 GeV n-1 Range from Space with the PAMELA Detector. ApJ 742(2):102. 10.1088/0004-637X/742/2/102, https://arxiv.org/abs/arXiv:1107.4519 [astro-ph.SR]
- Adriani et al (2015) Adriani O, Barbarino GC, Bazilevskaya GA, et al (2015) Trapped Proton Fluxes at Low Earth Orbits Measured by the PAMELA Experiment. ApJL 799(1):L4. 10.1088/2041-8205/799/1/L4, https://arxiv.org/abs/arXiv:1412.1258 [astro-ph.EP]
- Adriani et al (2016) Adriani O, Barbarino GC, Bazilevskaya GA, et al (2016) Erratum: “Search for Anisotropies in Cosmic-Ray Positrons Detected By the PAMELA Experiment” ¡A href=“/abs/2015ApJ…811…21A”¿(2015, ApJ, 811, 21)¡/A¿. ApJ 818(1):100. 10.3847/0004-637X/818/1/100
- Aguilar et al (2018) Aguilar M, Ali Cavasonza L, Alpat B, et al (2018) Observation of fine time structures in the cosmic proton and helium fluxes with the alpha magnetic spectrometer on the international space station. Phys Rev Lett 121:051,101. 10.1103/PhysRevLett.121.051101, URL https://link.aps.org/doi/10.1103/PhysRevLett.121.051101
- Aguilar et al (2021) Aguilar M, Cavasonza LA, Ambrosi G, et al (2021) Periodicities in the daily proton fluxes from 2011 to 2019 measured by the alpha magnetic spectrometer on the international space station from 1 to 100 gv. Phys Rev Lett 127:271,102. 10.1103/PhysRevLett.127.271102, URL https://link.aps.org/doi/10.1103/PhysRevLett.127.271102
- Alshehhi and Marpu (2021) Alshehhi R, Marpu PR (2021) Detection of Coronal Mass Ejections Using Unsupervised Deep Clustering. Sol Phys 296(6):104. 10.1007/s11207-021-01854-w
- Armano et al (2018) Armano M, Audley H, Baird J, et al (2018) Characteristics and Energy Dependence of Recurrent Galactic Cosmic-Ray Flux Depressions and of a Forbush Decrease with LISA Pathfinder. ApJ 854:113. 10.3847/1538-4357/aaa774, https://arxiv.org/abs/arXiv:1802.09374 [physics.space-ph]
- Armano et al (2019) Armano M, Audley H, Baird J, et al (2019) Forbush Decreases and 2 Day GCR Flux Non-recurrent Variations Studied with LISA Pathfinder. ApJ 874(2):167. 10.3847/1538-4357/ab0c99, https://arxiv.org/abs/arXiv:1904.04694 [physics.space-ph]
- Bartocci et al (2020) Bartocci S, Battiston R, Burger WJ, et al (2020) Galactic Cosmic-Ray Hydrogen Spectra in the 40-250 MeV Range Measured by the High-energy Particle Detector (HEPD) on board the CSES-01 Satellite between 2018 and 2020. ApJ 901(1):8. 10.3847/1538-4357/abad3e
- Battistoni et al (2014) Battistoni G, Boehlen T, Cerutti F, et al (2014) Overview of the FLUKA code. In: Joint International Conference on Supercomputing in Nuclear Applications + Monte Carlo, p 06005, 10.1051/snamc/201406005
- Benkhoff et al (2010) Benkhoff J, van Casteren J, Hayakawa H, et al (2010) BepiColombo—Comprehensive exploration of Mercury: Mission overview and science goals. Planetary and Space Science 58(1-2):2–20. 10.1016/j.pss.2009.09.020
- Benz (2017) Benz AO (2017) Flare Observations. Living Reviews in Solar Physics 14(1):2. 10.1007/s41116-016-0004-3
- Böhlen et al (2014) Böhlen TT, Cerutti F, Chin MPW, et al (2014) The FLUKA Code: Developments and Challenges for High Energy and Medical Applications. Nuclear Data Sheets 120:211–214. 10.1016/j.nds.2014.07.049
- Bruno et al (2018) Bruno A, Christian ER, de Nolfo GA, et al (2018) Solar energetic particle events observed by the PAMELA mission. In: AGU Fall Meeting Abstracts, pp SH51C–2831
- Christl et al (2009) Christl M, Adams Jr. JH, Kuznetsov EN, et al (2009) A Solar Energetic Particle Spectrometer (SEPS) Concept. In: International Cosmic Ray Conference, International Cosmic Ray Conference
- Cid et al (2014) Cid C, Palacios J, Saiz E, et al (2014) On extreme geomagnetic storms. Journal of Space Weather and Space Climate 4:A28. 10.1051/swsc/2014026
- Dalla et al (2003) Dalla S, Balogh A, Krucker S, et al (2003) Properties of high heliolatitude solar energetic particle events and constraints on models of acceleration and propagation. Geophysical Research Letters 30(19). https://doi.org/10.1029/2003GL017139, URL https://agupubs.onlinelibrary.wiley.com/doi/abs/10.1029/2003GL017139, https://arxiv.org/abs/https://agupubs.onlinelibrary.wiley.com/doi/pdf/10.1029/2003GL017139
- Desorgher et al (2013) Desorgher L, Hajdas W, Britvitch I, et al (2013) Esa next generation radiation monitor. In: 2013 14th European Conference on Radiation and Its Effects on Components and Systems (RADECS), pp 1–5
- Dourki et al (2017) Dourki I, Westermeier F, Schopper F, et al (2017) Characterization and optimization of a thin direct electron detector for fast imaging applications. Journal of Instrumentation 12:C03,047–C03,047. 10.1088/1748-0221/12/03/C03047
- Dresing et al (2020) Dresing N, Effenberger F, Gómez-Herrero R, et al (2020) Statistical results for solar energetic electron spectra observed over 12 yr with stereo/sept. The Astrophysical Journal 889(2):143. 10.3847/1538-4357/ab64e5, URL https://dx.doi.org/10.3847/1538-4357/ab64e5
- Faldi et al (2023) Faldi F, Bertucci B, Tomassetti N, et al (2023) Real-time monitoring of solar energetic particles outside the ISS with the AMS-02 instrument. Rendiconti Lincei Scienze Fisiche e Naturali 34(2):339–345. 10.1007/s12210-023-01156-2
- Fox et al (2016) Fox NJ, Velli MC, Bale SD, et al (2016) The Solar Probe Plus Mission: Humanity’s First Visit to Our Star. Space Sci Rev 204(1-4):7–48. 10.1007/s11214-015-0211-6
- Freiherr von Forstner, Johan L. et al (2021) Freiherr von Forstner, Johan L., Dumbovi´c, Mateja, Möstl, Christian, et al (2021) Radial evolution of the april 2020 stealth coronal mass ejection between 0.8 and 1 au - comparison of forbush decreases at solar orbiter and near the earth. A&A 656:A1. 10.1051/0004-6361/202039848, URL https://doi.org/10.1051/0004-6361/202039848
- Gaisser (1991) Gaisser TK (1991) Cosmic Rays and Particle Physics
- García Marirrodriga et al (2021) García Marirrodriga C, Pacros A, Strandmoe, S., et al (2021) Solar orbiter: Mission and spacecraft design. A&A 646:A121. 10.1051/0004-6361/202038519, URL https://doi.org/10.1051/0004-6361/202038519
- García-Rigo et al (2016) García-Rigo A, Núñez M, Qahwaji R, et al (2016) Prediction and warning system of SEP events and solar flares for risk estimation in space launch operations. Journal of Space Weather and Space Climate 6:A28. 10.1051/swsc/2016021
- Grigis, P. C. and Benz, A. O. (2004) Grigis, P. C., Benz, A. O. (2004) The spectral evolution of impulsive solar x-ray flares. A&A 426(3):1093–1101. 10.1051/0004-6361:20041367, URL https://doi.org/10.1051/0004-6361:20041367
- Grimani et al (2009a) Grimani C, Fabi M, Finetti N, et al (2009a) The role of interplanetary electrons at the time of the lisa missions. Classical and Quantum Gravity 26:215,004. 10.1088/0264-9381/26/21/215004
- Grimani et al (2009b) Grimani C, Fabi M, Finetti N, et al (2009b) The role of interplanetary electrons at the time of the LISA missions. CQG 26:215,004. 10.1088/0264-9381/26/21/215004
- Grimani et al (2013) Grimani C, Fabi M, Finetti N, et al (2013) Spectral shape of solar particle events at energies above 100 MeV/n. In: Journal of Physics Conference Series, p 012159, 10.1088/1742-6596/409/1/012159
- Grimani et al (2015) Grimani C, Fabi M, Lobo A, et al (2015) LISA Pathfinder test-mass charging during galactic cosmic-ray flux short-term variations. CQG 32(3):035001. 10.1088/0264-9381/32/3/035001
- Grimani et al (2020) Grimani C, Cesarini A, Fabi M, et al (2020) Recurrent galactic cosmic-ray flux modulation in l1 and geomagnetic activity during the declining phase of the solar cycle 24. ApJ 904(1):64. 10.3847/1538-4357/abbb90, URL https://doi.org/10.3847/1538-4357/abbb90
- Grimani et al (2021) Grimani C, Andretta V, Chioetto P, et al (2021) Cosmic-ray flux predictions and observations for and with Metis on board Solar Orbiter. A&A 656:A15. 10.1051/0004-6361/202140930, https://arxiv.org/abs/arXiv:2104.13700 [astro-ph.IM]
- Grimani (2022) Grimani Cea (2022) Bridging the gap between Monte Carlo simulations and measurements of the LISA Pathfinder test-mass charging for LISA. Astronomy and Astrophysics 666:A38. 10.1051/0004-6361/202243984, https://arxiv.org/abs/arXiv:2208.08849 [astro-ph.HE]
- Issautier et al (2008) Issautier K, Hoang S, Le Chat G, et al (2008) Ulysses mission: The end of an odyssey. In: Charbonnel C, Combes F, Samadi R (eds) SF2A-2008, p 551
- Joyce et al (2021) Joyce CJ, McComas DJ, Schwadron NA, et al (2021) Energetic particle evolution during coronal mass ejection passage from 0.3 to 1 AU. A&A 651:A2. 10.1051/0004-6361/202039933
- Kaiser et al (2008) Kaiser ML, Kucera TA, Davila JM, et al (2008) The STEREO Mission: An Introduction. Space Sci Rev 136(1-4):5–16. 10.1007/s11214-007-9277-0
- Karpov et al (1997) Karpov SN, Miroscnichenko LI, Vashenyuk EV (1997) On a Search for the Extremely High-Energy Particles from the Sun by the Baksan Underground Scintillation Telescope Data. In: International Cosmic Ray Conference, p 157
- Klein et al (2022) Klein KL, Musset S, Vilmer N, et al (2022) The relativistic solar particle event on 28 October 2021: Evidence of particle acceleration within and escape from the solar corona. Astronomy and Astrophysics, 663:A173. 10.1051/0004-6361/202243903
- Kollhoff et al (2021) Kollhoff A, Kouloumvakos A, Lario D, et al (2021) The first widespread solar energetic particle event observed by Solar Orbiter on 2020 November 29. A&A 656:A20. 10.1051/0004-6361/202140937
- Kress et al (2020) Kress B, Rodriguez J, Onsager T (2020) The GOES-R Space Environment In Situ Suite (SEISS): Measurement of Energetic Particles in Geospace, pp 243–250. 10.1016/B978-0-12-814327-8.00020-2
- Kühl et al (2015) Kühl P, Banjac S, Dresing N, et al (2015) Proton intensity spectra during the solar energetic particle events of May 17, 2012 and January 6, 2014. A&A 576:A120. 10.1051/0004-6361/201424874
- Kühl et al (2017) Kühl P, Dresing N, Heber B, et al (2017) Solar Energetic Particle Events with Protons Above 500 MeV Between 1995 and 2015 Measured with SOHO/EPHIN. Sol Phys 292(1):10. 10.1007/s11207-016-1033-8, https://arxiv.org/abs/arXiv:1611.03289 [physics.space-ph]
- Large et al (2023) Large MJ, Bizzarri M, Calcagnile L, et al (2023) Hydrogenated amorphous silicon high flux x-ray detectors for synchrotron microbeam radiation therapy. Physics in Medicine and Biology 68(13):135010. 10.1088/1361-6560/acdb43
- Lario et al (2006) Lario D, Kallenrode MB, Decker RB, et al (2006) Radial and Longitudinal Dependence of Solar 4-13 MeV and 27-37 MeV Proton Peak Intensities and Fluences: Helios and IMP 8 Observations. ApJ 653(2):1531–1544. 10.1086/508982
- Lario et al (2013) Lario D, Aran A, Gómez-Herrero R, et al (2013) Longitudinal and Radial Dependence of Solar Energetic Particle Peak Intensities: STEREO, ACE, SOHO, GOES, and MESSENGER Observations. ApJ 767(1):41. 10.1088/0004-637X/767/1/41
- Lario et al (2020) Lario D, Kwon RY, Balmaceda L, et al (2020) Fast and Wide CMEs without Observed ¿20 MeV Protons. ApJ 889(2):92. 10.3847/1538-4357/ab64e1
- Martucci et al (2023) Martucci M, Laurenza M, Benella S, et al (2023) The first ground-level enhancement of solar cycle 25 as seen by the high-energy particle detector (hepd-01) on board the cses-01 satellite. Space Weather 21(1):e2022SW003,191. https://doi.org/10.1029/2022SW003191, URL https://agupubs.onlinelibrary.wiley.com/doi/abs/10.1029/2022SW003191, e2022SW003191 2022SW003191, https://arxiv.org/abs/https://agupubs.onlinelibrary.wiley.com/doi/pdf/10.1029/2022SW003191
- Mason, G. M. et al (2021) Mason, G. M., Ho, G. C., Allen, R. C., et al (2021) Quiet-time low energy ion spectra observed on solar orbiter during solar minimum. A&A 656:L5. 10.1051/0004-6361/202140540, URL https://doi.org/10.1051/0004-6361/202140540
- Matsuda (2017) Matsuda A (2017) Amorphous and Microcrystalline Silicon, pp 1–1. 10.1007/978-3-319-48933-9_25
- Mazur et al (1995) Mazur JE, Mason GM, Klecker B (1995) Heavy Ion Acceleration beyond 10 MeV per Nucleon in Impulsive Solar Flares. ApJL 448:L53. 10.1086/309589
- Menichelli et al (2021) Menichelli M, Bizzarri M, Boscardin M, et al (2021) Fabrication of a hydrogenated amorphous silicon detector in 3-d geometry and preliminary test on planar prototypes. Instruments 4-5:32. 10.3390/instruments5040032
- Menichelli et al (2022) Menichelli M, Bizzarri M, Boscardin M, et al (2022) Displacement damage in Hydrogenated Amorphous Silicon p-i-n diodes and charge selective contacts detectors. 10.36227/techrxiv.19555042.v3
- Menichelli et al (2022) Menichelli M, Bizzarri M, Boscardin M, et al (2022) Testing of planar hydrogenated amorphous silicon sensors with charge selective contacts for the construction of 3d-detectors. Journal of Instrumentation 17(03):C03,033. 10.1088/1748-0221/17/03/C03033, URL https://dx.doi.org/10.1088/1748-0221/17/03/C03033
- Menichelli et al (2022) Menichelli M, Bizzarri M, Calcagnile L, et al (2022) Development of thin hydrogenated amorphous silicon detectors on a flexible substrate. arXiv e-prints arXiv:2211.17114. 10.48550/arXiv.2211.17114, https://arxiv.org/abs/arXiv:2211.17114 [physics.ins-det]
- Menichelli et al (2023) Menichelli M, Antognini L, Bashiri A, et al (2023) X-ray qualification of hydrogenated amorphous silicon sensors on flexible substrate. In: 2023 9th International Workshop on Advances in Sensors and Interfaces (IWASI), pp 190–193, 10.1109/IWASI58316.2023.10164611
- Meroli et al (2011) Meroli S, Passeri D, Servoli L (2011) Energy loss measurement for charged particles in very thin silicon layers. Journal of Instrumentation 6:P06,013. 10.1088/1748-0221/6/06/P06013
- Müller et al (2020) Müller D, St. Cyr OC, Zouganelis I, et al (2020) The solar orbiter mission - science overview. A&A 642:A1. 10.1051/0004-6361/202038467, URL https://doi.org/10.1051/0004-6361/202038467
- Núñez, Marlon (2018) Núñez, Marlon (2018) Predicting well-connected sep events from observations of solar soft x-rays and near-relativistic electrons. J Space Weather Space Clim 8:A36. 10.1051/swsc/2018023, URL https://doi.org/10.1051/swsc/2018023
- Nymmik (1999a) Nymmik R (1999a) SEP Event Distribution Function as Inferred from Spaceborne Measurements and Lunar Rock Isotopic Data. In: 26th Int. Cosmic Ray Conf. (Salt Lake City), pp 268–271
- Nymmik (1999b) Nymmik R (1999b) Relationships among Solar Activity, SEP Occurrence Frequency, and Solar Energetic Particle Event Distribution Function. In: 26th Int. Cosmic Ray Conf. (Salt Lake City), pp 280–283
- Papaioannou et al (2022) Papaioannou A, Kouloumvakos A, Mishev A, et al (2022) The first ground-level enhancement of solar cycle 25 on 28 October 2021. A&A 660:L5. 10.1051/0004-6361/202142855, https://arxiv.org/abs/arXiv:2202.07927 [astro-ph.SR]
- Posner (2007) Posner A (2007) Up to 1-hour forecasting of radiation hazards from solar energetic ion events with relativistic electrons. Space Weather 5:S05,001. 10.1029/2006SW000268
- Qin and Wang (2015) Qin G, Wang Y (2015) Simulations of a gradual solar energetic particle event observed by helios 1, helios 2, and imp 8. The Astrophysical Journal 809(2):177. 10.1088/0004-637X/809/2/177, URL https://dx.doi.org/10.1088/0004-637X/809/2/177
- Reames (2021) Reames DV (2021) Solar Energetic Particles. A Modern Primer on Understanding Sources, Acceleration and Propagation, vol 978. 10.1007/978-3-030-66402-2
- Rodríguez-Pacheco et al (2020) Rodríguez-Pacheco J, Wimmer-Schweingruber RF, Mason GM, et al (2020) The energetic particle detector - energetic particle instrument suite for the solar orbiter mission. A&A 642:A7. 10.1051/0004-6361/201935287, URL https://doi.org/10.1051/0004-6361/201935287
- Sato et al (2020) Sato K, Hara K, Onaru K, et al (2020) Characteristics of silicon strip sensor irradiated up to a proton fluence of 1017neq /cm2. Nuclear Instruments and Methods in Physics Research A 982:164507. 10.1016/j.nima.2020.164507
- Shea and Smart (2001) Shea MA, Smart DF (2001) Solar proton and GLE event frequency: 1955-2000. In: International Cosmic Ray Conference, pp 3401–3404
- Srour et al (1999) Srour J, Jr G, Lo D, et al (1999) Damage mechanisms in radiation-tolerant amorphous silicon solar cells. Nuclear Science, IEEE Transactions on 45:2624 – 2631. 10.1109/23.736506
- Street (2000) Street R (2000) Technology and Applications of Amorphous Silicon. 10.1007/978-3-662-04141-3
- Söderström et al (2008) Söderström T, Haug FJ, Terrazzoni-Daudrix V, et al (2008) Optimization of amorphous silicon thin film solar cells for flexible photovoltaics. Journal of Applied Physics 103(11):114,509. 10.1063/1.2938839, URL https://doi.org/10.1063/1.2938839, https://arxiv.org/abs/https://doi.org/10.1063/1.2938839
- Taioli et al (2023) Taioli S, Dapor M, Dimiccoli F, et al (2023) The role of low-energy electrons in the charging process of LISA test masses. Classical and Quantum Gravity 40(7):075001. 10.1088/1361-6382/acbadd, https://arxiv.org/abs/arXiv:2209.12791 [physics.space-ph]
- Vashenyuk et al (2007) Vashenyuk EV, Balabin YV, Gvozdevsky BB, et al (2007) Characteristics of relativistic solar cosmic rays in large ground-level events in 1956-2005. Bulletin of the Russian Academy of Sciences, Physics 71(7):933–937. 10.3103/S106287380707012X
- Vernetto et al (2022) Vernetto S, Laurenza M, Storini M, et al (2022) Long term measurements of neutron dose rates at Testa Grigia high altitude research station (3480 m. a.s.l.). Radiation Physics and Chemistry 193:109972. 10.1016/j.radphyschem.2022.109972
- Vlachoudis (2009) Vlachoudis V (2009) Flair: A powerful but user friendly graphical interface for FLUKA. In: International Conference on Mathematics, Computational Methods & Reactor Physics (M&C 2009), Saratoga Springs, New York, pp 790–800
- Wenzel et al (1992) Wenzel KP, Marsden RG, Page DE, et al (1992) The ULYSSES Mission. Astronomy and Astrophysics Supplement 92:207
- Wimmer-Schweingruber et al (2021) Wimmer-Schweingruber RF, Pacheco D, Janitzek N, et al (2021) The first year of energetic particle measurements in the inner heliosphere with solar orbiter’s energetic particle detector, submitted to A&A
- Workman et al (2022) Workman RL, Burkert VD, Crede V, et al (2022) Review of Particle Physics. Progress of Theoretical and Experimental Physics 2022(8):083C01. 10.1093/ptep/ptac097
- Wyrsch and Ballif (2016) Wyrsch N, Ballif C (2016) Review of amorphous silicon based particle detectors: the quest for single particle detection. Semiconductor Science Technology 31(10):103005. 10.1088/0268-1242/31/10/103005
- Wyrsch et al (2006) Wyrsch N, Miazza C, Dunand S, et al (2006) Radiation hardness of amorphous silicon particle sensors. Journal of Non-Crystalline Solids 352:1797–1800. 10.1016/j.jnoncrysol.2005.10.035
- Zank et al (2006) Zank GP, Li G, Florinski V, et al (2006) Particle acceleration at perpendicular shock waves: Model and observations. Journal of Geophysical Research: Space Physics 111(A6). https://doi.org/10.1029/2005JA011524, URL https://agupubs.onlinelibrary.wiley.com/doi/abs/10.1029/2005JA011524, https://arxiv.org/abs/https://agupubs.onlinelibrary.wiley.com/doi/pdf/10.1029/2005JA011524
- Zhao et al (2019) Zhao H, Johnston WR, Baker DN, et al (2019) Characterization and evolution of radiation belt electron energy spectra based on the van allen probes measurements. Journal of Geophysical Research: Space Physics 124(6):4217–4232. https://doi.org/10.1029/2019JA026697, URL https://agupubs.onlinelibrary.wiley.com/doi/abs/10.1029/2019JA026697, https://arxiv.org/abs/https://agupubs.onlinelibrary.wiley.com/doi/pdf/10.1029/2019JA026697