Location-based Activity Behavior Deviation Detection for Nursing Home using IoT Devices
Abstract
With the advancement of the Internet of Things(IoT) and pervasive computing applications, it provides a better opportunity to understand the behavior of the aging population. However, in a nursing home scenario, common sensors and techniques used to track an elderly living alone are not suitable. In this paper, we design a location-based tracking system for a four-story nursing home - The Salvation Army, Peacehaven Nursing Home in Singapore. The main challenge here is to identify the group activity among the nursing home’s residents and to detect if they have any deviated activity behavior. We propose a location-based deviated activity behavior detection system to detect deviated activity behavior by leveraging data fusion technique. In order to compute the features for data fusion, an adaptive method is applied for extracting the group and individual activity time and generate daily hybrid norm for each of the residents. Next, deviated activity behavior detection is executed by considering the difference between daily norm patterns and daily input data for each resident. Lastly, the deviated activity behavior among the residents are classified using a rule-based classification approach. Through the implementation, there are 44.4% of the residents do not have deviated activity behavior, while 37% residents involved in one deviated activity behavior and 18.6% residents have two or more deviated activity behaviors.
Index Terms:
Internet of Things, Deviated Activity Behavior Detection, Data Fusion, Location-based Sensing, Nursing Home MonitoringI Introduction
Over the past few years, the advancement of the Internet of Things (IoT) technology has opened up a lot of research potential in the area of tracking and monitoring. Among them, a wide variety of projects have been carried out to monitor the behavior of the human being as shown in [1, 2, 3, 4, 5]. These technologies made room for implementing convenient applications for enhancing day to day living of urban residents.
With the increase of the world aging population as shown in [6] and [7], research in monitoring the elderly has gained attention from different research principles. While these works [8, 9, 10, 11] address the support of the elderly as independent beings of the society, and others [12, 13] have provided the facility for the nursing home to monitor the daily activity behavior of the residents. The former method commonly leverages boundary-less tracking and monitoring techniques as shown in [4, 5], which include smartphones and smart wearable devices. The majority of the latter approaches [12, 13] mostly provide tracking in a confined environment, where the accuracy of the boundary-less approach is not ideal. Our work focuses on the latter approach, where the constraints of monitoring senior citizens are limited to a nursing home. Traditionally, it is labor-intensive to take care of the day-to-day life of an elderly resident, and it is not possible to constantly track an individual across 24 hours. Therefore, using a building-scale human monitoring approach, it can assist the nursing home staff to monitor residents and better understand their activity behavior.
With this challenge in mind, we design a system to monitor the deviated activity behavior of nursing home’s residents leveraging IoT technology. We use bluetooth low energy (BLE) technology as backbone for collecting the elderly data due to nature of low energy, and coverage suitable for indoor application compared to WiFi, RFID, ZigBee, etc. The deviated activity behavior denotes a nursing home’s resident behaves irregularly compared to his/her normal routine of daily life. This type of detection only can be achieved through fully understanding a resident’s life routine. The main objectives of such a system are to identify the residents’ activity behavior and determine the irregular activity behaviors. The constraints of monitoring residents’ activity behavior in a nursing home are bounded by building structure, and also their daily activity is influenced by the group activities or community. Therefore, our aim is to differentiate their activity between private and group activity when computing their deviated activity behavior. Another constraint when designing this system is that we do not have ground truth on the data collected, which resulting the accuracy of system output cannot be validated. Moreover, the identity of the nursing home residents is anonymized to comply with Singapore Personal Data Protection Act [14]. Thus, unsupervised knowledge extraction is more desired when compared to the supervised knowledge extraction model.
To address the aforementioned challenges, in this paper, we present a building-scale monitoring system to study 50 residents’ activity behavior in the Peacehaven Nursing Home, Singapore. Using the building-scale monitoring system, residents’ activity behavior based on their location are investigated using a wearable card tag with a build-in Bluetooth beacon. Each room is equipped with a receiver to detect the Bluetooth beacon transmitted to perform the resident’s location detection. Based on the detected location, we study the activity behavior of residents over 6 months and cluster them based on their common patterns. In order to identify the normal activity behavior, we use a data fusion method to generate the hybrid norm by combining the group and individual norm. Using the hybrid norm, deviated activity behavior can be extracted, which does not follow the normal daily pattern of a resident. Afterward, we perform empirical analysis on the deviated activity behavior and classify them.
The key contributions of this paper are as follows:
- •
We study the resident’s activity behavior in a nursing home from a location-based implementation of a monitoring system.
- •
We propose a data fusion method to identify the daily norm for each nursing home’s resident based on two data sources, which are individual and group norm.
- •
Based on the daily norm generated, we perform empirical analysis on the deviated activity behavior and identify the types of them using rules-based classification.
Our paper can be detailed as follows: In Section II, we study related work about existing methodologies in detecting deviated activity behavior with their pros and cons. Subsequently, in Section III, the system architecture and data processing model is presented. Afterward, we describe the group activity behavior clustering method in Section IV. Based on the group detected, we compute the deviated activity behavior utilizing the hybrid norm and analyze them in Section V. Lastly, we conclude our work in Section VI.
II Related Work
In this section, we discuss some of the related works in the field, which are types of monitoring techniques used to achieve human monitoring and methodologies applied to study deviated activity behavior.
II-A Types of Monitoring Techniques
There are four common types of monitoring techniques in the literature, which are (1) people-driven, (2) event-driven, (3) location-driven, and (4) data-driven.
The people-driven monitoring technique uses humans as the main source of generating information, which normally involves sensors installed in smartphones, watch, bracelets, and other types of wearable. It is commonly not restricted by location and has a wider coverage of sensing capability. Examples of smartphone monitoring techniques can be found in [4, 15, 16], where common sensors used are accelerometer, GPS, microphone, etc. Examples of other types of wearable devices are belt equipped with sensing unit [12] and bracelets [11]. Generally, these types of monitoring techniques are intrusive but able to capture good accuracy data.
The event-driven monitoring technique uses the activity of daily life (ADL) of the users and attempts to understand the activity behavior of the targeted user. For instance, Alcala et. al. [17] uses the hidden Markov model (HMM) to process ADL and detect the deviated activity behavior from the daily routine, while Zerkouk et.al. [18] use a long term short term memory-based model to identify deviated routine among senior citizen. A detailed review of the ADL monitoring approaches can be found in [19]. The downside of the events-driven monitoring technique is that detailed data is desired and requires a lot of effort as incomplete information will mislead the study outcome.
When monitoring techniques involve installing multiple sensors at a particular location or building, often it is known as a location-driven method of monitoring people. The coverage of the monitoring often involves a building or a particular area, and commonly used sensors include motion sensors [20], vision [21], RFID sensors [22], infra-red [23], WiFi-passive [24]. However, the inconvenience of this monitoring approach is limited to the area coverage since it is location-bound and only limited study scenarios would benefit from such an approach.
The data-driven approach uses various information sources and combines them to infer human activity behavior. It can be a mixture of different data sources as described in [25] such as physical sensors or cyber data sources such as social media. Examples of data fusion driven approaches can be found in these works [26, 27], where multiple sensors are fused to study human behavior. The disadvantages of this approach are due to the complexity of the model and domain knowledge required to select relevant information sources to combine. Besides, every data sources require different preprocessing techniques, which can be rather tedious and challenging.
II-B Methodologies in Deviated Activity Behavior Extraction
The common methodologies in studying the deviated activity behavior of senior citizens can be categorized into the following: (1) prediction model, (2) state estimation model, and (3) clustering and exploration model.
The prediction model utilizes statistics to predict the potential activity behavior of a particular user and if the predicted behavior does not match the predictive outcome, it will be labeled as deviated activity behavior. Recent prediction methods such as long short term memory (LSTM) can be found in [18], which detect the deviated activity behaviors among the senior citizens using a deep learning approach. Other types of statistical predictive models also can be found in [20, 8, 28, 29]. The predictive model generally requires good quality and a large amount of data as it is not ideal to perform a model with limited or noisy data.
State estimation modeling maps the state behavior of a particular user into a system state, which can be used to model the users’ activity behavior and detect any deviated activity behavior. State estimation usually requires human intervention to map the total state of the given system, which involves domain experts to carry out such tasks. In [30], Novak et. al. performed the Self Organizing Maps (SOM) and Makrov prediction model onto ADL of a senior citizen to detect their deviated activity behavior. Another example of state estimation modeling can be found in [31], where they detect the deviated activity behavior using HMM. Other state estimation examples can be found in [32, 33]. The drawback of this approach can be rather complex since it does not consider the relationship between activities that happened in parallel.
The clustering and exploration model normally use four steps to generate an insights extraction model, which the user’s deviated activity behavior is studied during the exploration phase. It is first proposed in [34] and commonly used when there is no ground-truth available or no prior knowledge regarding deviated activity behavior. An example of this approach can be found in [11], where Kurnianingsih et. al. use hybrid -means clustering and isolation forest to detect the deviated vital signals among senior citizen. In [22], authors also use -means clustering to formulate normal pattern and if any event does not fit into the cluster, it will be labeled as deviated activity behavior. Meanwhile, authors [4] studied the activity behavior of senior citizens using -means clustering approach and decision tree to generate features for analyzing the users’ demographic. The main drawback of this method is that it requires extensive knowledge in specific domains when analyzing potential deviated activity behavior, however it works effectively when there is no ground-truth available.


III System Design
In this paper, we focus on the location-driven monitoring techniques since the resident of the nursing home stay within the premises. Therefore, building-wide monitoring is more desirable in our studies. Given that collecting ground-truth appears to be impossible in our problem, the insights exploration approach and unsupervised machine learning method is more appropriate. In this section, the overall system design of the deviated activity behavior detection system is presented followed by the data specification and data preprocessing steps.
III-A Hardware Setup
The proposed hardware setup comprises of two crucial components installed in the nursing home, which are card tags with BLE beacons and beacon receiver. The Bluetooth beacon card model is shown in Fig. 1(a), which is capable of transmitting beacon every 1000ms using Nordic nRF52 chip with a range of up to meters.
It is equipped with a battery and capable of transmitting the data for up to 6 months without recharging. To provide sufficient coverage for the nursing home, each room has a beacon receiver installed and pick up the Bluetooth beacon transmitted. To filter out the irrelevant Bluetooth devices, a unique identifier is assigned to each of the card tags. The building studied as illustrated in Fig. 1(b) consists of 4 levels with the top 2 levels served as the residential area, while the lower 2 levels are the staff area and basement level 1. Note that the residential area and basement level consists of a common and dining area, where the residents can interact and have activity together. In total, there is over Bluetooth beacon receiver installed to provide sufficient coverage to monitor residents’ activity behavior. There is a total of residents within the nursing home who are agreed to participate in this study. The beacon receiver uses RedBear Duo as shown in Fig. 1(a), which later transmits the collected Bluetooth beacon list to the local server for further processing.
After the local server received the broadcast messages, it performs threshold filtering to remove any weak signal less than dBm. Subsequently, we compute the residents’ stay location using Algorithm 1. The Algorithm 1 undergoes a cycle of seconds to determine the location of the residents based on the strongest RSSI signal. The complexity of the Algorithm 1 is , which it depends on the number of RSSI signals received, .
III-B Data Specification and Processing pipeline
After the residents’ location data is stored in the database, we perform a series of processing onto the residents’ trajectory data to extract the deviated activity behaviors. In this paper, 6 months of the residents’ trajectory data is studied ranged from 01 Sep 2019 until 01 March 2020. The overall data processing architecture is shown in Fig. 2. Each resident undergoes the following preprocessing steps to extract their daily trajectory as well as residing room for further analysis. The preprocess module consists of the following steps, which are (1) time-sync, (2) location encoding, (3) windows fitting, and (4) data smoothing. The time-sync process is used to synchronize time for the data entry as previously proposed in [35]. Subsequently, the residents’ locations are encoded into discrete numerical values for easier location representation. Subsequently, windows fitting is performed to fit the location data into five-minute windows with the location with the longest duration denoted as stay location. Lastly, the data smoothing is performed to remove location with short duration stay, which could be a potential noise. After the preprocessing step, we would obtain a more structured residents’ trajectory data.
We have performed the complexity analysis on the system architecture to ensure the proposed system does not take ages to detect the activity behavior of a given nursing home resident. The computational complexity is , which the most time-consuming part is during clustering phase of the nursing home resident, . On the other hand, the space complexity of the proposed system is .
Based on the trajectory, we compute the origin for each resident based on their longest stay duration and location from 11:00pm to 6:00am. Note that origin denotes the room that a resident stayed in, while other rooms are denoted as private. The encoded locations are divided into the following: (a) origin level 2, (b) origin level 3, (c) private level 2, (d) private level 3, (e) public area basement level, (f) public area level 2, (g) public area level 3, and (h) restricted area.
In order to detect the different types of activity behavior among the nursing home’s residents, the clustering method utilizing a custom kernel is applied to compute similarity metrics across different elderly. Based on the daily trajectory data, there are group activities among residents, where the residents are divided into multiple groups. To find the common patterns among residents, the clustering approach is utilized to group residents with similar activity behavior. Further details of the clustering will be elaborated in Section IV.
After that, we want to study the deviated activity behavior of the residents in the nursing home. Using the aggregated residents’ data and cluster data, there are two types of norm data that can be computed, which are (1) individual, and (2) group norm data. Based on these two norms, a data fusion technique is used to generate daily hybrid norm for each resident and from there further extract each resident’s deviated activity behavior. Subsequently, the deviated activity behavior of the nursing home’s residents is analyzed and categorized.
IV Group Activity Behavior Clustering
IV-A Clustering Algorithm
In this subsection, we aim to study residents’ activity behavior by applying the clustering algorithm to group residents with similar trajectory patterns. To study the similarity between residents based on the location data, a custom similarity kernel is proposed to measure the resemblance between residents’ activity behavior. Each location is treated as categorical data and perform the windows sliding method to determine the similarity score between residents. Let’s denote each resident as in a nursing home, where the number of residents consists range of . The resident is assigned a location , which it consists of the spatial information and temporal information over the days . This formulates the basic trajectory of residents in a nursing home. By collecting the data over different days, a spatial-temporal matrix, consists of the temporal information can be denoted such as:
| (1) |
where the denotes number of days for the data collected and the denotes timestamp for each location . Based on the matrix , the residents’ location is aggregated to generate an individual pattern, , which later will be used for clustering. We consolidate the spatial-temporal matrix into a vector of samples, which each time-slot represents minutes interval of an encoded location. The main motivation of choosing sample is we want to achieve between computing speed and data processing size. This is computed using ordinal ranking [36] based on the frequency of the location a resident stays throughout the data collection period. The aggregation trajectory for resident into can be shown in the following Algorithm 2:
After obtaining the residents’ aggregated data, we calculate the similarity metrics between different residents for clustering purposes in order to generate a similar group. Therefore, the Weighted Windowed Overlap (WWO) similarity kernel is introduced to calculate the similarity between pairwise resident and . The WWO function can be defined as following:
| (2) |
where denotes window sliding parameter over the time by comparing the location of pairwise residents . Meanwhile, represents the threshold of the windows sliding mechanism. In this paper, the threshold of is defined as minutes. Subsequently, the similarity calculation, can be calculated using the following equation:
| (3) |
where denotes the weight vector corresponding to the time of the day.
To ensure the effectiveness of computing similarity, we use a toy example of two different residents with the same origin but different activity behavior patterns to study similarity measure as shown in Fig 3(a) as follows:
| ||
| (b) Weights used for calculating the similarity function |
Three different weight vectors are being considered when computing the similarity kernels for resident and using WWO, which are (1) uniform, (2) active-day focus, and (3) only active-day. The illustration of varying weight is presented in Fig 3(b). These three weight vectors try to highlight different temporal parts of the day and weight is adjusted accordingly. For instance, active-day focus emphasizes the active period of the day (06:00am - 11:59pm), where only active-day only consider the active period (07:00am - 08:00pm). Note that the total value of weight is and is allocated across vectors depending on the weight characteristic. We choose one of the weights depending on the emphasis of the outcome of the desired similarity measurement. Using some common similarity measurement as introduced in [37], a comparison of the similarity measurement is shown in Table I.
| Similarity Measurement Method | Similarity Score |
|---|---|
| WWO (active-day focus) | 0.7250 |
| WWO (uniform) | 0.7778 |
| WWO (only active-day) | 0.5675 |
| Overlap [38] | 0.8182 |
| Eskin [39] | 0.9259 |
| Goodall [40] | 0.9254 |
Based on the observation, the variation of overlap methods has similar results ranging from to , where the similarity score of the WWO with only active-day is . Meanwhile, the other methods (Eskin and Goodall) have a higher similarity score despite the visualization of two residents’ trajectory in Fig. 3 shows different patterns. Ideally, the overlap method presents the most straightforward method of computing the similarity score, which is roughly around . However, the overlap method only highlights the similarity between two users during night time (08:00pm - 06:00am), which represents a large amount of time when users are inactive. Thus, after considering the different weightage similarity scores, active-day focus weight is more desirable for computing the similarity metric, where it emphasizes a more active period on the day.
By iterating the similarity score through different pairwise residents, we can obtain the similarity matrix, A as such:
| (4) |
In order to compute the laplacian matrix, degree matrix, can be computed as follows:
| (5) |
where it represents a non-zero affinity matrix.
Next, using Eqn. 4 and Eqn 5, the normalized Laplacian matrix, L can be generated using following equation:
| (6) |
where denotes the identity matrix.
Subsequently, we compute the generalized eigenvectors using the normalized Laplacian matrix, L as follows:
| (7) |
where vector, is the calculated using the smallest eigenvalue. By combining the afore-mentioned equation, we formulate the spectral clustering in the Algorithm 3. The computational complexity of the spectral clustering is , which is the most time consuming part of the proposed system. Based on the proposed algorithm, we perform group detection and show the result in next sub-section.
IV-B Results and Validation
In order to study the optimal for deciding the number of clusters in the nursing home, we apply the sum of squared distance (SSD) for different number of values. The SSD can be defined as follows:
| (8) |
where it utilizes from Eqn. 2. It calculates the summation of squared distance for different values in clustering, which lower value indicates higher similarity between residents in the same cluster. Ideally, we want to find clusters within the range of to clusters out from residents. The SSD result is presented in Fig 4.
Based on observation, = is an ideal number for the clusters as the SSD value is the lowest compared to other choices of . Using =, the clustering algorithm is formulated as shown in Algorithm 3, and the clustering result is presented in Fig. 5.
 |
 |
| (a) Cluster 1 | (b) Cluster 2 |
 |
 |
| (c) Cluster 3 | (d) Cluster 4 |
 |
 |
| (e) Cluster 5 |
We observed clusters are separated by building level and have their own characteristic. The level 3 residents generally can be divided into three different groups, where level 2 can be divided into 2 different groups. The residents from Cluster 1 tend to have a longer visit duration at level 3 public area compared to Cluster 2 and Cluster 3. Meanwhile, resident in Cluster 3 spends his/her lunchtime in the level 3 public area instead of the basement public area.
Meanwhile, residents from Cluster 2 tend to spend less time in public places, where Cluster 3’s residents spend more time in level 2 public areas. In Cluster 2, resident and resident spend time in their room without going to public spaces, which is quite peculiar. Level 2’s residents in Cluster 4 mostly spend their time in the public area, while residents in Cluster 5 spend less time in the public area and spend most of their time in their respective origin.
Based on these 5 clusters, we will generate daily activity based on their group to compute their daily activity behavior. Further details of fusing individual activity behavior and group activity behavior are elaborated in the next section.
V Residents’ Deviated Activity Behavior Study
V-A Residents’ Hybrid Norm Computation
Despite there is group activity behavior among the nursing home’s residents in their daily routine, there exist cases of some residents who behave differently than the others. The trajectory of the residents may vary day to day depending on the group schedule for the day. Therefore, it is crucial to consider the residents’ groups daily trajectory to provide additional information to generate daily norms for studying potential deviated activity behavior. To show an example of deviated activity behavior detection, we use resident ’s norm and the group norm (Cluster 3) as an example to demonstrate the working of extracting the deviated locations from the data. The example of input data and hybrid norm generation are shown in following Fig. 6:
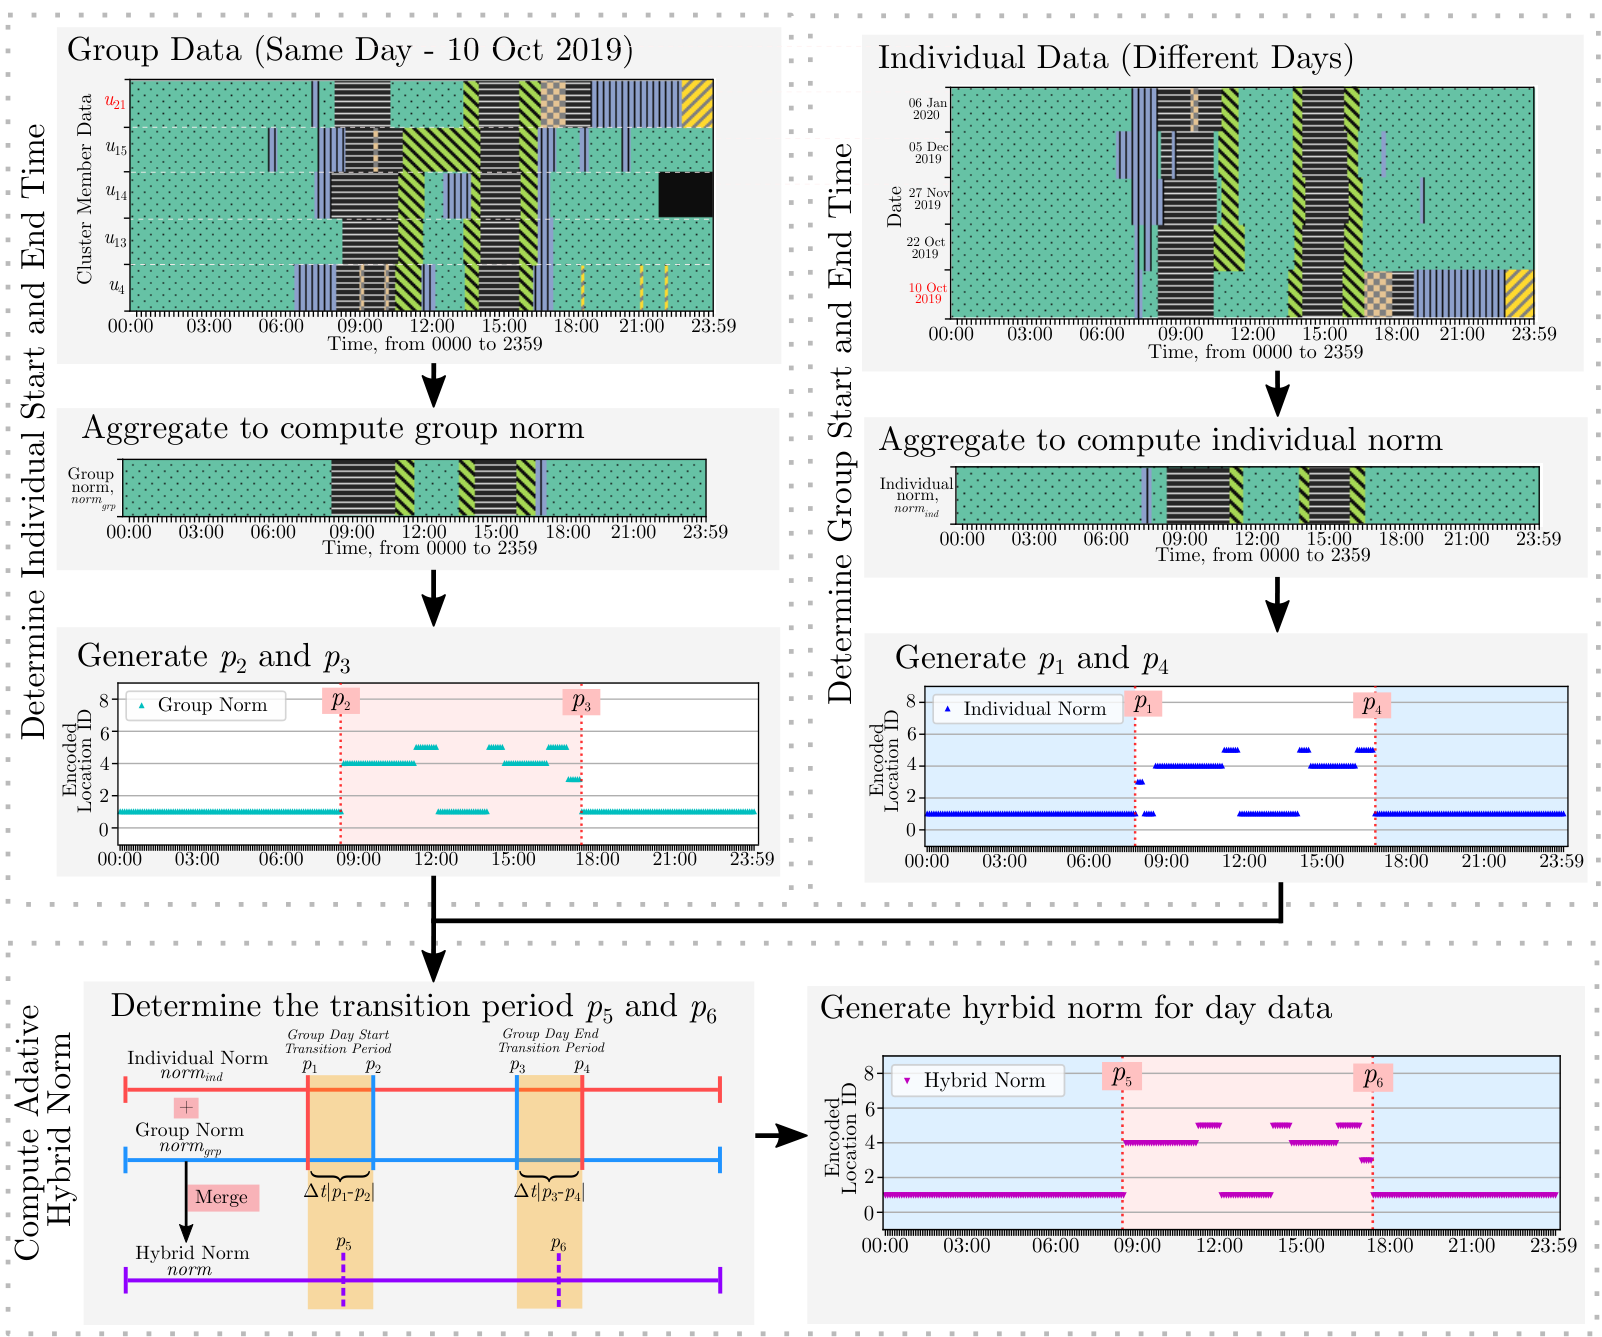
Using the example, we extract two different norms from the resident to generate a hybrid norm for 10 October 2019. Both norms used as data input to generate a hybrid norm can be defined as follows:
- •
Individual Norm, - The individual norm represents the regular pattern of the resident over the data collection period. The regular pattern is generated through the aggregated of the resident’s valid data, which can be obtained using the user group detection module’s Algorithm 2. Note that the individual norm is obtained using aggregated trajectory for each resident, .
- •
Group Norm, - Group norm denotes the regular pattern of all clustered residents obtained using the clustering algorithm in the previous section. Note that this pattern changes every day as a nursing home have different activities/events arranged during the active hour. Therefore, is calculated every day for each cluster.
Utilizing these norms, we propose a data fusion method to generate a hybrid norm . The main challenge here is to address the transition method between and , where overlapping between two norms is possible when combining both norms.
There are two transition periods in the day of study, which are the group activity start transition period and group activity end transition period. One needs to decide the exact timing for transition based on the starting period of the group using and ending period . Moreover, similar consideration applied for the ending time of the private period, and the starting period of private period . The denotes the starting of the group activity, while represents the group activity ending period. To compute the transition period using , the following Eqn. 9 is used and 10 to decide the transition period for group starting and group ending period:
| (9) |
| (10) |
where denotes the time gap limit between 2 time slots such as and . Note that if the time overlap such as or , the earliest time is considered as transition period as default overlapping time.
After deciding the transition period, we compute the hybrid norm, by combining the individual and group norm of the nursing home residents. The merging process between and can be formulated as follows:
| (11) |
where the period between = and = uses norm from . The denotes the group time. In addition, represents the particular day we are studying, while denotes each of the residents in the nursing home. By combining the aforementioned equations, the hybrid norm for each resident can be computed using Algorithm 4 and the computational complexity is .
V-B Residents’ Deviated Activity Behavior Identification
After computing the adaptive hybrid norm for each user, we extract the deviated locations using a filtering function based on the norm and daily input data, . Since the encoded location is categorical data, the binary comparison method is adopted to compare whether the input data is the same as the generated adaptive hybrid norm. The Eqn. 12 describe the afore-mentioned process:
| (12) |
where the filter() function is applied to the daily input data to remove norm data, while preserving the deviated locations. Therefore, the following Algorithm 5 is proposed to compute for daily trajectory by iterating the filter function every day.
Using the example stated earlier in Fig. 6, the deviated activity behaviors of resident can be computed for 10 October 2019. The deviated activity behaviors are highlighted as illustrated in Fig. 7.
In the upper part of Fig. 7, we show an example of obtaining a hybrid norm based on the data fusion approach by fusing group features and individual features. After performing the filtering function, the input trajectory is highlighted in red color, which the users’ trajectory is different than the computed hybrid norm. Here, three different deviated activity behaviors are detected across different locations. The first deviated activity behavior happened around 7:30am, where the resident visit level 3 public area for 15 minutes. After that, resident return to his origin and stayed from 10:45am to 2:00pm. Based on the hybrid norm, the resident from cluster 4 went back to their room after 11:45pm, which is conflicted with the resident ’s hybrid norm. Lastly, the last deviated activity behavior occurred around 4:50pm and continued until the end of the day. Supposedly, the resident would spend most of his/her time in origin, but instead, went to public spaces around level 3 and level 2 private area. This shows the process of detecting deviated activity behaviors for a particular user by integrating the group norm and individual norm. By fusing both information, the deviated activity behaviors can be computed for every resident in the nursing home and further study the types of deviated activity behavior.
V-C Analysis and Classification of Deviated Activity Behaviors
After obtaining deviated activity behaviors, we proceed to identify the types of it among the nursing home’s residents. We found out some residents suffered from sleep irregularity, and some of them absent during the group activity. Based on observation of the data, three different deviated activity behaviors can be generalized, which are (1) sleep irregularity, (2) awake irregularity, and (3) private visiting. The definition of deviated activity behaviors are listed as follows:
- •
(1) sleep irregularity - The sleep irregularity denotes the resident goes to another location instead of staying back to his/her origin at the usual timing during night time.
- •
(2) awake irregularity - The awake irregularity denotes the resident either leaves the room late or early compared to their routine schedule.
- •
(3) private visiting - The resident went to another staying room (staying room for level 2 or level 3) instead of the common places cluster or he/she normally will present.
Subsequently, a rules-based classification method is introduced to define the features for identifying deviated activity behavior. The rationality of using such an approach is that labels can be assigned based on the predefined rules using a statistical approach given there is no ground-truth available. Note that each user can be assigned multiple classification labels.
| Temporal Period | Time Range of the Day |
|---|---|
| Midnight | day start () |
| Morning | |
| Pre-group | mins |
| Group | minsmins |
| Post-group | mins |
| Evening | ) |
| Midnight | day end |
To generate features for the classification, we further break down the time of the day into seven different finer temporal periods as shown in Fig. 8. By breaking down into different periods, the time before and after group activity can be investigated to generate features for studying deviated activity behavior. Note that and shown here are based on the average time start and time end throughout the data collection period for each user. Using Fig. 8 as a reference, the finer temporal periods are introduced as shown in Table II.
Next, the probabilities of deviated locations’ occurrence are calculated based on the daily filtered deviated location for each finer temporal period. This can be used to define rules using the probabilistic calculation based on the deviated activity behavior statistic. The location probability, can be computed using following Eqn. 13
| (13) |
where denotes the timeslot of the day and represents the location resident went when a deviated behavior occurred. The counts the occurrence number of deviated activity behavior and denotes the total number of the valid time slot. By combining the probability of deviated locations of every user, we can study the potential timeslot for each user, where the deviated activity behaviors occurred most. To simplify the locations of where deviated activity behaviors occurred, encoded locations with similar functionalities are combined and study the probability for each timeslot. The combined encoded list are listed as follows: (c1) null, (c2) origin, (c3) public area, (c4) private area, and (c5) restricted location.
| (a) Example of awake irregularity detected for resident |
 |
| (b) Example of sleep irregularity detected for resident |
 |
| (c) Example of private visiting detected for resident |
 |
 |
After computing the probabilities of deviated locations for the nursing home’s residents, we illustrate the distribution of deviated locations using a violin plot as shown in Fig. 9. The category c1 represents the probability of residents not involving in deviated activity behavior at a different time of the day, where category c2 to c5 represents the location for a deviated activity behavior to be detected. The probability of deviated activity behavior occur at other locations c2 to c5 is small which the value ranges from to . One can observe a lot of deviated activity behaviors that happened mostly in the public area (c3) and follow by origin (c2). That being said, to further understand those involved in sleep irregularity and social visiting events, attention is given to the residents who yield a higher probability of deviated activity behaviors. Specifically, we are interested in the distribution of residents, whose probability is higher than the median for the encoded location c2 to c5. Those residents have higher chances of showing deviated activity behaviors compared to the median of the distribution. Using the characteristic of a violin plot, the classification threshold is defined based on the upper adjustment value (UAV) and lower adjustment value (LAV), which are computed through the first or third quantile interquartile range. Based on the specific timing’s distribution, the UAV and LAV values are extracted as shown in Table III to define the threshold values for the classification rules.
| Deviated Location | c1 | c2 | c4 |
| LAV | UAV | UAV | |
| midnight | 0.8762 | - | - |
| Morning | 0.7323 | - | 0.0118 |
| pre-group | - | 0.2717 | 0.0312 |
| group | - | - | 0.0521 |
| post-group | - | - | 0.0223 |
| evening | 0.7522 | - | 0.0174 |
| Deviated Activity Behavior | Classification Rules | |||||
|---|---|---|---|---|---|---|
| Sleep Irregularity | c1 midnight LAV or c1 Evening LAV | |||||
| Awake Irregularity | c1 morning LAV or c2 pre-group LAV | |||||
| Private Visiting |
|
After defining the classification rules, we classify every nursing home’s residents based on their probability for the finer hybrid temporal period. A general statistic for the classified labels after performing the rules-based classification is presented in Fig. 10. Based on the result, 44.4% of residents do not have a classification label, which indicates the majority of the residents do not have deviated activity behavior. The remaining 37% of the residents are associated with one classification label only, of which 40% of them are having private social visiting irregularity. On the other hand, half of the residents with two classification labels mainly consist of sleep and awake irregularity.
Based on the classification labels generated, we examine three residents as case studies to study normal daily activity behavior and deviated activity behavior. Three different deviated activity behaviors are illustrated in Fig. 11. From Fig. 11(a), the resident is not waking up based on his/her daily schedule. Based on observation, there are two types of awake irregularity, which are wake up earlier or wake up way later than the normal wake up time (around 7:30 am). Next, we investigate the sleep irregularity of resident as depicted in Fig. 11(b). The resident normally goes back to the origin after 9:00pm, but in the deviated activity behavior’s extracted days, he/she remained at the public area until the end of the day. These activity behaviors normally do not occur in his/her normal routine, and this is a good representation of the sleep irregularity. Subsequently in Fig. 11(c), one can discover that the resident absent during the group activity for few days, where he/she went to a private area instead. This phenomenon indicates the resident either is having social interaction with other residents in their private space or avoiding group activity. This could be potentially a deviated activity behavior.
By utilizing the proposed hybrid deviated activity behavior classification, we managed to obtain types of residents’ deviated activity behaviors in a nursing home. This provides insight into the nursing home’s management regarding the residents’ deviated activity behavior and attention can be provided to the individual with needs.
VI Conclusion
In this paper, we present a location-based deviated activity behavior detection system for the Salvation Army, Peacehaven Nursing Home, Singapore. The 50 residents can be segmented into different groups based on their activity behavior, which contributes to formulating group norms. By combining group and individual norms, we can generate a hybrid norm to identify the common behavior for each resident. By understanding residents’ normal activity behavior, the deviated activity behavior can be differentiated and extracted from normal activity behavior to study it. Based on the types of deviated activity behavior, three categories of deviated activity behavior are proposed, which are (1) sleep irregularity, (2) awake irregularity, and (3) private visiting. Next, three users’ normal and deviated activity behavior are studied after performing rules-based classification.
For future works, we plan to incorporate more data sources to generate more accurate deviated activity behavior detection. Also, a real-time deviated activity behavior system is part of the future research direction as the dynamic formation of group activity is yet another issue to address. Another aspect that can be improved is getting ground-truth for the data collected to further enhancing deviated activity behavior detection module. Moreover, a more throughout study on the compatibility with different countries’ data protection rules would be part of the research interest to reach out to more nursing homes.
References
- [1] B. P. L. Lau, N. Wijerathne, B. K. K. Ng, and C. Yuen, “Sensor fusion for public space utilization monitoring in a smart city,” IEEE Internet of Things Journal, vol. 5, no. 2, pp. 473–481, 2018.
- [2] V. Mighali, L. Patrono, M. L. Stefanizzi, J. J. P. C. Rodrigues, and P. Solic, “A smart remote elderly monitoring system based on iot technologies,” in 2017 Ninth International Conference on Ubiquitous and Future Networks (ICUFN), July 2017, pp. 43–48.
- [3] S. Dhingra, R. B. Madda, R. Patan, P. Jiao, K. Barri, and A. H. Alavi, “Internet of things-based fog and cloud computing technology for smart traffic monitoring,” Internet of Things, vol. 14, p. 100175, 2021. [Online]. Available: https://www.sciencedirect.com/science/article/pii/S2542660519302100
- [4] S. H. Marakkalage, R. Liu, S. K. Viswanath, and C. Yuen, “Identifying indoor points of interest via mobile crowdsensing: An experimental study,” in 2019 IEEE VTS Asia Pacific Wireless Communications Symposium (APWCS), Aug 2019, pp. 1–5.
- [5] L. Wang, Y. Hsiao, X. Xie, and S. Lee, “An outdoor intelligent healthcare monitoring device for the elderly,” IEEE Transactions on Consumer Electronics, vol. 62, no. 2, pp. 128–135, May 2016.
- [6] R. Becker, “World population expected to reach 9.7 billion by 2050,” National Geographic. July, 2015.
- [7] T. Kaneda, “China’s concern over population aging and health,” Population Reference Bureau, 2006.
- [8] O. Aran, D. Sanchez-Cortes, M.-T. Do, and D. Gatica-Perez, “Anomaly detection in elderly daily behavior in ambient sensing environments,” in Human Behavior Understanding, M. Chetouani, J. Cohn, and A. A. Salah, Eds. Cham: Springer International Publishing, 2016, pp. 51–67.
- [9] M. M. Rahman, G. Hossain, C. Rajab, and M. R. Mrizkal, “irestroom : A smart restroom cyberinfrastructure for elderly people,” Internet of Things, p. 100573, 2022. [Online]. Available: https://www.sciencedirect.com/science/article/pii/S2542660522000658
- [10] R. Sokullu, M. A. Akkaş, and E. Demir, “Iot supported smart home for the elderly,” Internet of Things, vol. 11, p. 100239, 2020. [Online]. Available: https://www.sciencedirect.com/science/article/pii/S254266052030072X
- [11] Kurnianingsih, L. E. Nugroho, Widyawan, L. Lazuardi, and A. S. Prabuwono, “Detection of anomalous vital sign of elderly using hybrid k-means clustering and isolation forest,” in TENCON 2018 - 2018 IEEE Region 10 Conference, Oct 2018, pp. 0913–0918.
- [12] P. Pierleoni, A. Belli, L. Palma, M. Pellegrini, L. Pernini, and S. Valenti, “A high reliability wearable device for elderly fall detection,” IEEE Sensors Journal, vol. 15, no. 8, pp. 4544–4553, Aug 2015.
- [13] R. Suzuki, S. Otake, T. Izutsu, M. Yoshida, and T. Iwaya, “Monitoring daily living activities of elderly people in a nursing home using an infrared motion-detection system,” Telemedicine Journal & e-Health, vol. 12, no. 2, pp. 146–155, 2006.
- [14] S. P. D. P. Commission, “Personal data protection act 2012,” 2012. [Online]. Available: https://www.pdpc.gov.sg/Overview-of-PDPA/The-Legislation/Personal-Data-Protection-Act
- [15] K. Ouchi and M. Doi, “Smartphone-based monitoring system for activities of daily living for elderly people and their relatives etc.” in Proceedings of the 2013 ACM Conference on Pervasive and Ubiquitous Computing Adjunct Publication, ser. UbiComp ’13 Adjunct. New York, NY, USA: Association for Computing Machinery, 2013, p. 103–106. [Online]. Available: https://doi.org/10.1145/2494091.2494120
- [16] B. P. L. Lau, M. S. Hasala, V. S. Kadaba, B. Thirunavukarasu, C. Yuen, B. Yuen, and R. Nayak, “Extracting point of interest and classifying environment for low sampling crowd sensing smartphone sensor data,” 2017 IEEE International Conference on Pervasive Computing and Communications Workshops, 2017.
- [17] J. Alcalá, O. Parson, and A. Rogers, “Detecting anomalies in activities of daily living of elderly residents via energy disaggregation and cox processes,” in Proceedings of the 2nd ACM International Conference on Embedded Systems for Energy-Efficient Built Environments, 2015, pp. 225–234.
- [18] M. Zerkouk and B. Chikhaoui, “Long short term memory based model for abnormal behavior prediction in elderly persons,” in International Conference on Smart Homes and Health Telematics. Springer, 2019, pp. 36–45.
- [19] J. Vermeulen, J. C. Neyens, E. van Rossum, M. D. Spreeuwenberg, and L. P. de Witte, “Predicting adl disability in community-dwelling elderly people using physical frailty indicators: a systematic review,” BMC geriatrics, vol. 11, no. 1, p. 33, 2011.
- [20] A. Lotfi, C. Langensiepen, S. M. Mahmoud, and M. J. Akhlaghinia, “Smart homes for the elderly dementia sufferers: identification and prediction of abnormal behaviour,” Journal of ambient intelligence and humanized computing, vol. 3, no. 3, pp. 205–218, 2012.
- [21] F. Harrou, N. Zerrouki, Y. Sun, and A. Houacine, “Vision-based fall detection system for improving safety of elderly people,” IEEE Instrumentation Measurement Magazine, vol. 20, no. 6, pp. 49–55, December 2017.
- [22] H.-H. Hsu and C.-C. Chen, “Rfid-based human behavior modeling and anomaly detection for elderly care,” Mobile Information Systems, vol. 6, no. 4, pp. 341–354, 2010.
- [23] M. Gochoo, T. Tan, T. Batjargal, O. Seredin, and S. Huang, “Device-free non-privacy invasive indoor human posture recognition using low-resolution infrared sensor-based wireless sensor networks and dcnn,” in 2018 IEEE International Conference on Systems, Man, and Cybernetics (SMC), Oct 2018, pp. 2311–2316.
- [24] Y. Zhou, B. P. L. Lau, Z. Koh, C. Yuen, and B. K. K. Ng, “Understanding crowd behaviors in a social event by passive wifi sensing and data mining,” IEEE Internet of Things Journal, pp. 1–1, 2020.
- [25] B. P. L. Lau, S. H. Marakkalage, Y. Zhou, N. U. Hassan, C. Yuen, M. Zhang, and U.-X. Tan, “A survey of data fusion in smart city applications,” Information Fusion, vol. 52, pp. 357 – 374, 2019. [Online]. Available: http://www.sciencedirect.com/science/article/pii/S1566253519300326
- [26] H. Ghayvat, S. Mukhopadhyay, B. Shenjie, A. Chouhan, and W. Chen, “Smart home based ambient assisted living: Recognition of anomaly in the activity of daily living for an elderly living alone,” in 2018 IEEE International Instrumentation and Measurement Technology Conference (I2MTC), May 2018, pp. 1–5.
- [27] N. K. Suryadevara, S. C. Mukhopadhyay, R. K. Rayudu, and Y. M. Huang, “Sensor data fusion to determine wellness of an elderly in intelligent home monitoring environment,” in 2012 IEEE International Instrumentation and Measurement Technology Conference Proceedings, May 2012, pp. 947–952.
- [28] D. Zekri, T. Delot, M. Desertot, S. Lecomte, and M. Thilliez, “Using learning techniques to observe elderly’s behavior changes over time in smart home,” in The Impact of Digital Technologies on Public Health in Developed and Developing Countries, M. Jmaiel, M. Mokhtari, B. Abdulrazak, H. Aloulou, and S. Kallel, Eds. Cham: Springer International Publishing, 2020, pp. 129–141.
- [29] J. H. Shin, B. Lee, and K. Suk Park, “Detection of abnormal living patterns for elderly living alone using support vector data description,” IEEE Transactions on Information Technology in Biomedicine, vol. 15, no. 3, pp. 438–448, May 2011.
- [30] M. Novák, M. Biňas, and F. Jakab, “Unobtrusive anomaly detection in presence of elderly in a smart-home environment,” in 2012 ELEKTRO, May 2012, pp. 341–344.
- [31] H. Ishii, K. Kimino, M. Inoue, M. Arahira, and Y. Suzuki, “Method of behavior modeling for detection of anomaly behavior using hidden markov model,” in 2018 International Conference on Electronics, Information, and Communication (ICEIC), Jan 2018, pp. 1–4.
- [32] D. N. Monekosso and P. Remagnino, “Anomalous behavior detection: Supporting independent living,” Intelligent Environments, pp. 33–48, 2009.
- [33] G. Singla, D. J. Cook, and M. Schmitter-Edgecombe, “Recognizing independent and joint activities among multiple residents in smart environments,” Journal of ambient intelligence and humanized computing, vol. 1, no. 1, pp. 57–63, 2010.
- [34] T. Cheng and Z. Li, “A multiscale approach for spatio-temporal outlier detection,” Transactions in GIS, vol. 10, no. 2, pp. 253–263, 2006. [Online]. Available: https://onlinelibrary.wiley.com/doi/abs/10.1111/j.1467-9671.2006.00256.x
- [35] B. P. L. Lau, T. Chaturvedi, B. K. K. Ng, K. Li, M. S. Hasala, and C. Yuen, “Spatial and temporal analysis of urban space utilization with renewable wireless sensor network,” in 2016 IEEE/ACM 3rd International Conference on Big Data Computing, Applications and Technologies. ACM, 2016, pp. 133–142.
- [36] A. Agresti, Analysis of Ordinal Categorical Data. John Wiley & Sons, 2010, vol. 656.
- [37] Shyam Boriah, Varun Chandola, and Vipin Kumar, “Similarity Measures for Categorical Data: A Comparative Evaluation,” in Proceedings of the 2008 SIAM International Conference on Data Mining, 2008, pp. 243–254. [Online]. Available: https://epubs.siam.org/doi/abs/10.1137/1.9781611972788.22
- [38] C. Stanfill and D. Waltz, “Toward memory-based reasoning,” Commun. ACM, vol. 29, no. 12, p. 1213–1228, Dec. 1986. [Online]. Available: https://doi.org/10.1145/7902.7906
- [39] E. Eskin, A. Arnold, M. Prerau, L. Portnoy, and S. Stolfo, A Geometric Framework for Unsupervised Anomaly Detection. Boston, MA: Springer US, 2002, pp. 77–101. [Online]. Available: https://doi.org/10.1007/978-1-4615-0953-0_4
- [40] D. W. Goodall, “A new similarity index based on probability,” Biometrics, vol. 22, no. 4, pp. 882–907, 1966. [Online]. Available: http://www.jstor.org/stable/2528080