Adults in the room?
Abstract
Keywords: Auditing, Dividends, Private firms, Natural experiment, Regression discontinuity
Abstract: We examine the effect of auditing on dividends in small private firms. We hypothesize that auditing can constrain dividends by way of promoting accounting conservatism. We use register data on private Norwegian firms and random variation induced by the introduction of a policy allowing small private firms to forgo the use of an auditor to estimate the effect of auditing on dividend payout. Identification is obtained by a regression discontinuity around the arbitrary thresholds for the policy. Propensity score matching is used to create a balanced synthetic control. We consistently find that forgoing auditing led to a significant increase in dividends in small private firms.
1 Introduction
The level of dividends is a key decision managers make in small- and medium-sized private firms. Dividends reflect a trade-off between compensating owners and maintaining firm liquidity and capitalization. Dividends are also a key variable of interest to policy makers concerned about how financial and accounting regulation may distort firm behavior. The finance and accounting literatures recognize the importance of dividends both as a primary mechanism for compensating shareholders (Baker and Wurgler 2004), as well as a costly signaling mechanism from firm managers to outside stakeholders about the financial condition of a firm (Easterbrook 1984; Miller and Rock 1985; Allen et al. 2012).
Arguably, the long-term interests of a private firm and its stakeholders and the short-term preferences of a manager may not always be aligned, even if the manager has a considerable ownership stake. Since equity shares of private firms can be difficult to sell, a cash-constrained owner wishing to extract liquidity from a firm can do so mainly through a dividend payout (Bauwhede et al. 2015).11 1 A prominent example from US business history of conflict over dividend payouts in a tightly held private firm comes from Koch Industries (Leonard 2019). In the late 1970’s, Kock Industries was a medium-sized, privately held firm where equity was held primarily by four brothers. While the firm was highly profitable and all the four brothers were wealthy on paper, the firm paid out only a small dividend, preferring to reinvest cash flow to expand the firm. This led to a conflict among the sibling-owners, ending in the shares of two of the brothers being bought out. The firm is currently the largest privately held firm in the US. Even in the small firms where the manager is the sole shareholder, conflicts could arise between the manager and outside stakeholders such as tax authorities and vendors. Auditors have the purpose of ensuring the completeness, validity and accuracy of transactions as reflected on firm financial statements. In this role, they can influence how a manager balances the trade-off between dividends and retained earnings.
In this article we hypothesize that auditors of private, small- and medium-sized firms constrain dividends by promoting accounting conservatism. The managers and owners of small firms often do not have formal accounting or financial training. Auditors are expected to maintain independence in relation to a firm’s strategy and operations, and by law they are not allowed to perform a bookkeeping role. But they do have a duty to report issues with the firm’s going concern, such as liquidity and financial robustness. They can also communicate weaknesses in the firm’s accounting and internal control processes (Downing and Langli 2019). In other words, the auditor can play the role of the financial adult in the room. By pointing out weaknesses in a firm’s accounting reports and explaining conservative accounting principles, the auditor can impose a degree of financial discipline on small firms. All else equal, accounting conservatism has the effect of reducing current earnings (Watts 2003), which in turn constrains dividends (Smith and Warner 1979; Smith and Watts 1992; Leuz 1998; Louis and Urcan 2015; Bradford et al. 2017).
To our knowledge, this mechanism of auditor impact is under-explored in the literature. Anecdotally, auditors we have spoken to see this mechanism as plausible for small firms. Small firms often see auditors as financial authority figures. The literature that does exist also seems to provide support for the hypothesis. Manson et al. 2001 study management letters by auditors among unlisted companies and find that auditors often provide advice on appropriate accounting methods and policies.
In this article we make use of Norwegian register data on small private firms and a recent implementation of an audit exemption policy for firms under given size thresholds to measure the effect of auditing on dividends. The policy shock is important since accounting conservatism can be difficult to measure directly (Chy and Hope 2021), and accounting conservatism may be endogenous to the process of determining dividends.
The identifying assumption in our article is that the threshold value for the exemption can be considered arbitrary within a narrow range of firm sizes. Whether a firm is just under or over the threshold can then be considered random. The introduction of this policy can be seen as a natural experiment, with a treatment group (i.e., those not being required to obtain an audit) being randomly assigned. This forms the heart of our identification: Comparing firms just below and above the thresholds to estimate an effect of auditing on dividends. We relax the assumption of random assignment by controlling for indicators of firm size and risk as well as by creating a balanced synthetic control with propensity score matching.
With the inclusion of several variables for firm characteristics, the methodology becomes a regression discontinuity. The estimate of the effect of auditing is obtained by measuring the jump, or discontinuity, at the policy threshold in relation to the overall trend of the size variables. We obtain estimates from specifications with both linear and non-parametric smoothed functions of the size variables. As a robustness check, we estimate difference-in-difference parameters that control for unobserved time-invariant variables.
We find a statistically and economically positive effect of audit exemption on dividends. A firm with operating revenues at the threshold of the exemption policy is estimated to increase their dividend by on average 35,000 - 85,000 NOK (or approximately €3,700-9,000). These estimated average magnitudes are significantly higher than the typical cost of auditing a small firm in Norway. Auditing costs for small firms can vary widely, though a report for the Norwegian Ministry of Finance from 2008 22 2 https://www.regjeringen.no/no/dokumenter/nou-2008-12/id520230/sec1 estimates an average cost of around 15,000-20,000 NOK. A report by Langli 2015 estimates average cost savings of approximately 14,000 NOK. Thus, the estimates likely reflect a real change in firm behavior rather than just a shifting of saved auditor costs. To put these magnitudes in perspective, the average firm in our sample had operating revenue of approximately 6.7 million NOK. Relative to revenues the average estimated change in dividends is modest, representing only between .5% and 1.2% of the operating revenues of a business. However, the mean dividend in our sample was approximately 136,000 NOK. The estimated change in dividends as a percentage of average dividends is substantial.
Our contribution is threefold. First, we contribute to the policy discussion of audit-exemption policies. We find that the absence of an auditor leads to an economically meaningful change in firm behavior in the form of increased dividends in small private firms. Second, we add to the literature on accounting conservatism by providing evidence that auditing has the effect of promoting conservative accounting practices and imposing a degree of financial discipline on small private firms that may lack financial sophistication. Finally, we apply the modern theory and methodology of causal modelling with the Rubin 1974 potential outcomes approach to a current topic within the accounting and auditing literature. The use of such methodologies within accounting research has become increasingly prominent, and this article provides another case study.
In the next section we discuss the institutional setting of our study, including a review of the theoretical mechanisms connecting auditing with dividends in private firms. In section 3, we describe the data and provide descriptive statistics. Section 4 provides a discussion of the assumptions necessary for a causal interpretation of our results and related challenges. Section 5 describes the regression discontinuity design and presents results. Section 6 extends the regression discontinuity model to include a matched control group that provides improved balance. Section 7 discusses results from a difference-in-difference estimation as a robustness check. Section 8 concludes with a summary of the results and implications.
2 Institutional Setting
While Norway is not an EU member, it is a member of the European Economic Area. Norway is bound to most European accounting and auditing laws and standards established by 4th and 7th European commission directives (“the accounting directives”) from 1978 and 1983. Norway is also a small open economy, where external trade makes up a large portion of GDP and where many firms have foreign customers, suppliers, investors, and owners. Norwegian auditing standards are largely in line with those from the International Standards of Auditing (ISA) (Downing and Langli 2019).
Norway has some institutional features that differentiates it from other countries. Much of the literature on auditing in private firms uses data from Anglo-Saxon countries, with a tradition for common-law judicial systems and relatively high litigation risk. Norway has a civil judicial system more in line with much of continental Europe, with lower litigation risk. This could in theory affect auditor independence, as the threat of litigation is sometimes seen as a check on auditors breaching their obligation of independence. But a study by Hope and Langli 2010 failed to find evidence for breaches of auditor independence in Norway.
The audit exemption rule was implemented in Norway as a part of a larger policy of reducing the bureaucratic and administrative costs to firms, especially small firms and start-ups. This policy goal was codified into law, requiring the government to reduce the bureaucratic costs of conducting business by at least 3 billion NOK per year. The audit exemption was the largest component of this policy, with an estimated cost reduction of 2 billion NOK per year (Langli 2015).
Most EU countries have long traditions for audit exemptions. Figure 1 shows thresholds for the Nordic countries as well as the UK. Small countries tend to have correspondingly small threshold values compared to the UK. Norway’s thresholds were set to a maximum balance sheet of approximately €2 million (20 million NOK) and a net turnover of approximately €500,000 (5 million NOK), and no more than 10 employees.33 3 From 2018, these were increased to 6 and 23 million NOK, though we only have data through 2015. In some countries the audit exemption thresholds coincide with thresholds associated with other policies. To our knowledge, the thresholds in Norway are only used for purposes of determining whether a firm qualifies for an audit exemption.
| Country | Total assets (€) | operating revenue (€) | Number of employees |
|---|---|---|---|
| Norway | 2,000,000 | 500,000 | 10 |
| Sweden | 150,000 | 300,000 | 3 |
| Denmark | 4,837,000 | 9,674,000 | 50 |
| Finland | 100,000 | 200,000 | 3 |
| Iceland | 1,400,000 | 2,800,000 | 50 |
| UK | 6,541,000 | 13,082,000 | 50 |
The threshold conditions for the Norwegian policy are cumulative, meaning that all conditions must be met before a firm can forgo auditing. To issue the proxy, a two-thirds majority of the votes and share of the capital represented at the annual general meeting is required.44 4 But, both the Norwegian law and the EU Fourth Company Law Directive specify exemptions from voluntary audit regulations. For instance, parent companies are required to submit audited financial statements regardless of firm size. As a consequence, a majority of subsidiary companies are audited, regardless of the flexibility the legislation provides. Some industries are also entirely exempted from this legislation (banks, insurance companies, law firms, auditors, providers of financial services and other entities under scrutiny of financial regulators. Status in any given year is determined from the previous year’s financial results. The thresholds are “hard”, meaning that they are not adjusted for firms that move across them from one year to another.
Norway is an interesting case study because it is a late adopter of the audit exemption policy. The UK, for example, already introduced an audit exemption in 1994 (Collis et al. 2004). By contrast, the Norwegian policy was rolled out first in 2011. Audits can be a significant expense for small- and medium-sized firms. Kausar et al. 2016 estimate that an audit can cost 6% or more among private small- and medium-sized European firms. Because Norway has had an auditing requirement for all firms up until 2011, a competitive market for audit services has developed with transparent pricing. Thus, we can compare our estimated magnitudes to reasonable estimates of the cost of obtaining an audit.
2.1 Theory of auditing and dividends
The hypothesis that auditing can reduce dividends by promoting accounting conservatism is, to our knowledge, new to the literature. Yet it can be seen as a combination of component ideas that have strong backing in both theoretical and empirical research. First, there is the question of whether mandatory auditing has any meaningful effect on firm behavior at a broad level. Furthermore, we are concerned with evidence that auditing promotes conservative accounting practices in firms. Finally, our proposed mechanism involves accounting conservatism reducing dividends by way of constraining current earnings.
An extensive literature finds evidence that auditing has real financial effects on firms (Blackwell et al. 1998; Allee and Yohn 2009; Kim et al. 2011; Minnis 2011). Kausar et al. 2016 is methodologically similar to our own study, making use of the implementation of the UK audit exemption policy as a natural experiment. They find that firms obtaining voluntary audits improved their investment and financial performance. Lennox and Pittman 2011 also study the effects of the UK audit exemption policy and finds that firms that voluntarily submitted to an audit received a higher credit rating compared to when there was a mandatory audit. In contrast to our own study, both these articles have a theoretical focus on the signaling effect of voluntary audits.
Several studies find evidence that auditing imposes financial discipline and promotes conservative accounting practices in firms. Clatworthy and Peel 2013 and Downing and Langli 2019 find that audited firms had higher compliance with tax and auditing regulations. Krishnan 2003 find a positive relationship between audit quality (as proxied by a big-six audit) and “opportunistic” accruals by management. Krishnan 2005 and Zhang et al. 2007 find positive associations between measures of auditor quality and fewer internal control problems. Chy and Hope 2021 find evidence that auditor conservatism reduced investments in innovation. Badolato et al. 2014 find that higher relative status of an auditor reduces earnings management. This is particularly relevant in our case as the firms in our sample are small and more likely to be financially unsophisticated. Presumably the auditor will have a high relative status in many such situations.
The second link in our hypothesis is between accounting conservatism and dividends. The accounting literature has long acknowledged that a conservative determination of net earnings restricts dividends in practice (Smith and Warner 1979; Smith and Watts 1992). Leuz 1998 argues that this relationship can be explained by the implicit constraints the accruals process puts on investment decisions made to generate a certain timing of future cash flow. Subsequent studies have supported the role of accounting conservatism in constraining net earnings and in turn dividends (Watts 2003; Andres et al. 2009; Louis and Urcan 2015; Bradford et al. 2017).
The hypothesis that forgoing auditing will on average lead to higher dividends among small firms is not ex-ante obvious. The theory on audit quality suggests that the absence of auditing could lead to increased retained earnings and lower dividends. If the absence of an auditor reduces the quality of the accounts, this could negatively affect financing by increasing the information asymmetry between a firm and its lenders. Empirical studies have shown that higher auditing quality leads to both lower cost of debt (Francis et al. 2005; Bauwhede et al. 2015) and equity (Hribar and Jenkins 2004). As the cost of capital decreases, the firm may pay out higher dividends compared to firms choosing to forgo auditing. Several studies provide empirical support for this hypothesis (Koo et al. 2017; Lawson and Wang 2016; Caskey and Hanlon 2013).
3 Data
Our data is from the Norwegian Centre for Corporate Governance research database, which consists of all Norwegian firms for the sample period (2010-2015). We limit the sample to firms that were active during the entire period 2005-2015. This limits the sample to 27,126 unique firms. We remove micro firms, with revenues or total balance of less than NOK 500,000 (approximately €50,000). We do not filter based on the number of employees since after filtering on revenues and assets, no firms had large deviations from the threshold on number of employees. We removed firms that do not report revenues, inventory, account receivables, or accounts payable each year in the sample period. Some industry groups are not eligible for an audit exemption and have not been included. This includes public limited corporations, financial firms, law firms, foundations, lottery firms, drugstores, and accounting and auditing firms. After these exclusions, we are left with 5,293 firms. We also remove firms with revenues of over NOK 15 million and a total balance of over NOK 50 million. We are left with 3,025 unique firms. Finally, the remaining firms are checked against the official Norwegian firm registry ("Brønnøysundsregistrene"), leaving 2,866 firms.
We loosen the assumption of random treatment assignment by controlling for a host of variables. Firm size is important as it signals that; i) managerial ownership normally decreases with increased firm size and ii) there may be fixed costs associated with starting an audit relationship, which will be relatively smaller for larger firms (Chow 1982; Fama and French 2001; Sharma 2011). We measure firm size as both total assets and operating revenue. These variables also determine eligibility for the audit exemption. By controlling for firm size in both the treatment and control groups, we measure the discontinuity at the threshold rather than the average difference between groups. Given the importance of controlling for firm size between treatment and control groups, we present results with both linear controls and non-parametric smoothed controls for firm size.
Agency theory suggests that high-risk firms are less likely to pay dividends, as they tend to have reduced access to capital markets and need to be self-financed to a higher degree (Ho 2003). We measure firm risk as the standard deviation of the return on assets (ROA), where ROA is defined as earnings before interest and taxes plus interests, divided by total assets.
According to the Jensen 1986 free cash flow hypothesis, higher cash holdings should be related to higher dividend payouts. Cash flow is measured as the sum of operating income and depreciation. We include firm mean cash flow across the years 2011-2015 in our analysis. Since cash flow uncertainty may constrain dividends, the standard deviation of cash flow is also included.
The profitability of a firm is important in determining the dividend. However we consider the reported income to be a post-treatment variable and co-determined with dividends, an issue we discuss below. But we do include lagged operating income as a control variable.
Leverage may also influence the propensity to pay dividends, as firms must ensure that they have sufficient liquidity to meet short- and long-term obligations. We measure leverage as total debt divided by total assets.
Finally, we control for sector and year fixed effects in the analysis. Table 2 shows the names and descriptions of the variables included in the regressions.
| Variable | Definition |
|---|---|
| dividend | Dividends per firm per year, normalized∗ |
| noAudit | Indicator of whether a firm chose to forgo an audit |
| operating revenue | Operating revenue per firm per year, |
| in thousands of Norwegian kroners, normalized | |
| total assets | Total assets per firm per year, |
| in thousands of Norwegian kroners, normalized | |
| operating income (t-1) | 1-year lagged operating income per firm per year, |
| in thousands of Norwegian kroners, normalized | |
| leverage | Ratio of total debt to total assets, |
| per firm per year, normalized | |
| risk (roa sd) | Risk as proxied by within-firm standard deviation |
| of return on assets | |
| (operating income divided by total assets), normalized | |
| cash flow (mean) | Within-firm mean of cash flow, normalized |
| cash flow (sd) | Within-firm standard deviation of cash flow, |
| normalized | |
| ∗Normalized: Subtracting the mean and dividing by the | |
| standard deviation of the variable. | |
Table 3 presents summary statistics for the variables used in the analysis. Statistics are calculated from firm-year observations from 2011 through 2015, which are the years in our sample where the audit exemption was instituted. Many firms pay out 0 in dividends at least some years. By design, all firms have significant amounts of revenue, however some firms have years with negative operating income. There is a wide range for both leverage and return on assets, but the 25th and 75th percentile statistics show that most firms lie within a much narrower range. Finally, the proportion of firms in a year that are eligible and choose to forgo an audit is 14% of the total.
| Statistic | Mean | St. Dev. | Min | Pctl(25) | Pctl(75) | Max |
|---|---|---|---|---|---|---|
| Dividend (1k NOK) | 141 | 390 | 0.00 | 0.00 | 50 | 10000 |
| Operating Revenue (1k NOK) | 6667 | 3319 | 503 | 3948 | 9098 | 25742 |
| Total Assets (1k NOK) | 4028 | 3379 | 500 | 1918 | 4997 | 42977 |
| Leverage | 0.60 | 0.44 | -0.15 | 0.34 | 0.79 | 20.65 |
| Operating income (lagged) | 251 | 581 | -6360 | -10 | 431 | 8219 |
| Return on Assets | 0.09 | 0.18 | -5.44 | 0.01 | 0.17 | 2.0 |
| noAudit | 0.14 | 0.34 | 0.00 | 0.00 | 0.00 | 1.0 |
Figure 1 shows correlations among the variables of interest. A star within a square indicates a correlation coefficient that is statistically significant at the 95% confidence level. Notably, the correlation coefficient between operating income and dividends is relatively high at approximately .50, though this is not statistically significant. The correlation between dividends and operating revenues, total assets, and number of employees, which are used as thresholds for the auditor exception rule, are substantially lower.

Eligibility for the exemption policy is established by way of three thresholds: Operating revenue, total assets, and number of employees. Figure 2 shows a scatter plot of all the firms in our data by operating revenue and total assets. The red lines represent the policy thresholds for firm size. Orange dots represent firms that chose to forgo auditing in that year. The policy had not been implemented yet in 2010, and only a limited roll-out happened in 2011. 2012 was the first year with a full roll-out, where all firms under the thresholds could forgo an audit. The figure makes clear that in most cases the binding constraint for eligibility is operating revenue. The number of firms who come under the operating revenue threshold but over the total assets threshold is as little as two firms (2012-2014) and at most four firms (2015). Thus, the effect of total assets as a binding constraint is negligible.55 5 The threshold for number of employees is more problematic. Figure 10 in the appendix shows a scatter plot of number of employees and operating revenue. Again, operating revenue is the binding constraint for the large majority of firms. But we also see that many firms that come under the operating revenue threshold but over 10 employees nonetheless have been able to choose not to get an audit. This is because the threshold is for 10 full-time equivalent employees, while the data in the sample is per head. Thus two 50% employees will count as 1 employee towards the maximum, but will appear as two employees in the data. Not surprisingly, many small firms in the sample rely on part-time employees. This makes using the number-of-employees threshold impossible in the regression discontinuity design. This is likely only a minor problem since only a small number of firms that come under the two other thresholds will be close to or above the 10 full-time-employee threshold.

A concern is that firms are intentionally adjusting their operating revenue to come just below the threshold. A recent literature finds evidence for such strategic manipulation of reported firm size to avoid disclosure or auditing Bernard et al. 2018. In our case, strategic size management may be particularly concerning since manipulating accounting data to come under the thresholds is contrary to conservative accounting practices and might introduce a bias in our estimation.
Identifying size management is straight forward. If such manipulation exists, then it should have the effect of creating a discontinuity at the threshold, as those just over the threshold have an incentive to manage their accounts downward. We focus on the operating revenue threshold, as it is binding for most observations. Figure 3 shows histograms of operating revenue before and after the implementation of the policy, with vertical black lines representing the threshold values. The limits of the x-axis are constrained to values close to the threshold. If firms were acting strategically in response to the exemption policy, we would expect to see “bunching” of frequencies just below the threshold after the implementation of the policy. No pattern of bunching is apparent.

4 Identifying the effect of an audit exception
We use a regression discontinuity approach to identify the effect of an audit exemption on dividends. The identifying assumption is that the threshold set for defining what firms are small enough to forgo an auditor is arbitrary within a narrow range of firm size.
We can first consider a theoretical scenario where an experimental randomization can be performed. In the case of random assignment to a control and treatment groups, unobserved variables that might otherwise bias the results satisfy the criteria of ignorability (Rubin 1974). Using the notation of Imbens and Rubin 2015, we let represents the potential outcome if the firm, i, is not audited, and represents the potential outcome if firm i is in the control group, which is audited. Treatment, in this case, is the introduction of the auditing exemption, represented by . Given randomization, the average treatment effect can be estimated as in equation 2. In other words, the claim is that the randomization gives the possibility to make an estimation from a counterfactual: The difference in the dividend pay-out of a given firm under both a scenario where they are, and are not, audited.
| (1) | ||||
| (2) |
A complication for our case is that it is not auditing itself that is randomized, but rather the option to be exempt from auditing. The quantity of interest then becomes the Average Treatment Effect for the Treated (ATT), as in equation 3. In words, this is the average difference in the dividend payout of a given firm who is not audited ( with the counterfactual of the same firm that obtains an audit (), given the introduction of an audit exemption ().
| (3) |
We have several reasons for being interested in the ATT versus the pure average treatment effect. The first is that a pure treatment effect is impossible to estimate if firms had a choice of whether to forgo an auditor. From a policy evaluation perspective, it is also the ATT effect that is relevant. The counterfactual scenario of all firms under the threshold forgoing an auditor is not of particular interest in evaluating a policy where firms are in fact given the choice of whether to obtain an auditor.
A problem with the ATT as written in equation 3 is that the counter-factual –the outcome for the treated observations if they did not receive the treatment–cannot be directly observed. The problem is that we do not observe which firms above the threshold would have forgone an auditor if given the choice (quadrants III and IV in figure 4). If the entire group above the threshold is used as a control, then this could confound the results. In particular, the estimation may pick up on a signal and screening effect. Since an exemption policy makes choosing to get audited observable, this can be used as a signal to stakeholders about the company’s financial situation. In a similar fashion, since audits are costly, choosing to get audited can have a screening effect, with high-quality firms willing to pay the auditing cost to demonstrate their financial robustness independent of the effect of the actual financial reports (Kausar et al. 2016).
In attempting to estimate the real financial reporting effects of an audit, we compare those firms that chose not to obtain an audit with a control group that was above the threshold and thus was required to obtain an audit. The firms that voluntarily chose to be audited are excluded. The key empirical challenge in this article is controlling for the factors that affect whether a firm above the threshold would choose to forgo an audit if they could.
Including control variables can help alleviate the potential bias that may be introduced by this self-selection but may not be sufficient to make the sample balanced between the treatment and control. Therefore, we also use propensity score matching to create a synthetic control group with improved balance.

By making use of the full panel of our data and a difference-in-difference identification strategy, we can also control for unobserved variables that may be correlated with treatment assignment. Instead of only comparing above and below the threshold after the introduction of the exemption policy, we compare changes in firms’ dividend between the years directly before and after the introduction of the policy and then compare average changes between firms in the treatment and control groups. In this way, unobserved variables that are correlated with the treatment but that are time-invariant are differenced out. The difference-in-difference strategy comes at the cost of reduced efficiency, as the differencing has the effect of discarding information from the data.
5 Regression discontinuity design
Changing to standard regression notation, the regression discontinuity design can be written as:
| (4) |
represents the dividends of firm in year . Here the treatment effect is represented by the coefficient on the indicator , whether firm i forgoes an audit in year t. represents the function of the firm size variables that determine the thresholds for the audit exemption. and represent vectors of observed and unobserved variables and corresponding vectors of coefficients. Examples of unobserved variables that might affect dividends include manager personality and risk appetite.
In this specification, is the discontinuity at the threshold value of the policy, conditional on the control variables. The estimate of , , is only unbiased if the selection into the treatment is not dependent on the unobserved covariates : .
Covariates are chosen so as not to control for post-treatment variables, which will tend to bias the estimated coefficients towards zero (Gelman and Hill 2006). Controlling for earnings and cash flow as well as other flow variables in the financial accounts could then partially control for the effect on dividends that we wish to estimate. On the other hand, variables like earnings and cash flow also have a straight-forward relationship to dividends as these are determinants of a firm’s ability to pay dividends in the first place. We include control variables for firm size: Operating revenue, total assets, and number of employees. Stock variables, like leverage, reflecting a history of the firm’s activities are also included. Flow variables, like cash-flow, that fully reflect year-to-year variation are not included. Instead, we include firm average and standard deviation of cash-flow over the years 2005-2015. We also include the one-year lag of operating income, though this variable does not materially alter the estimation of the coefficient on the noAudit indicator. Since the variable for within-firm average cash flow already controls for the general level of profitability of a firm (cash flow is defined as operating income plus depreciation), we omit the lagged operating income variable following the first set of discontinuity regressions.
5.1 Results from the regression discontinuity design
Table 4 shows results from the regression discontinuity estimation. Data is for the period 2011 through 2015, when the policy was in place. In the first column, only an intercept term, four year fixed effects and the treatment indicator are included. The treatment indicator is shown to be negative. This estimation is equivalent to a computation of the average difference in dividends between firms in the sample that were- and were not audited. But this is a biased estimate of the effect of auditing. Dividends and the noAudit indicator are likely correlated with omitted variables. In particular, the absence of measures of firm size, which are positively correlated with dividends, and which determine eligibility for the auditing exemption will negatively bias the estimate. Including control variables alleviates this bias. Operating revenue is important since this is the measure of firm size that is the binding determinant of eligibility for an auditing exemption for most firms. With the inclusion of covariates, we can interpret the noAudit coefficient as the jump, or discontinuity, at the eligibility threshold for firm size.
In the second column, we control for indicators of firm size, profitability, and risk. The treatment effect is now estimated to be positive and significant at the 10% level. The estimates in the second column include firms in the control group who were eligible to forgo an audit but chose to obtain an audit (quadrant II in figure 4). This is a departure from the goal of estimating the average treatment on the treated (ATT) effect.
In the third column we exclude observations who self-selected out of the treatment group. The estimated coefficient on the noAudit indicator increases to .15 standard deviations. This corresponds to approximately 60,000 NOK (€6,000). This provides insight into the bias that self-selection induces in the treatment. The direction of the coefficient change indicates that those firms who are under the threshold but still choose to be audited, tend to pay out a lower dividend than firms mandated to obtain an audit. If the same pattern holds for firms firms over the threshold (quadrants III and IV in Figure 4), then the regression results for the coefficient on the noAudit indicator would have an attenuation bias and could be considered a conservative estimate. On the other hand, a direct regression on all firms eligible to forgo an audit finds no significant relationship between dividends and choosing to be audited (see table 9 in Appendix B), indicating that that the bias from self-selection is modest.
In the fourth column, 94 sector fixed effects are included in the model. This appears to have little effect on the estimated coefficient on the noAudit indicator.
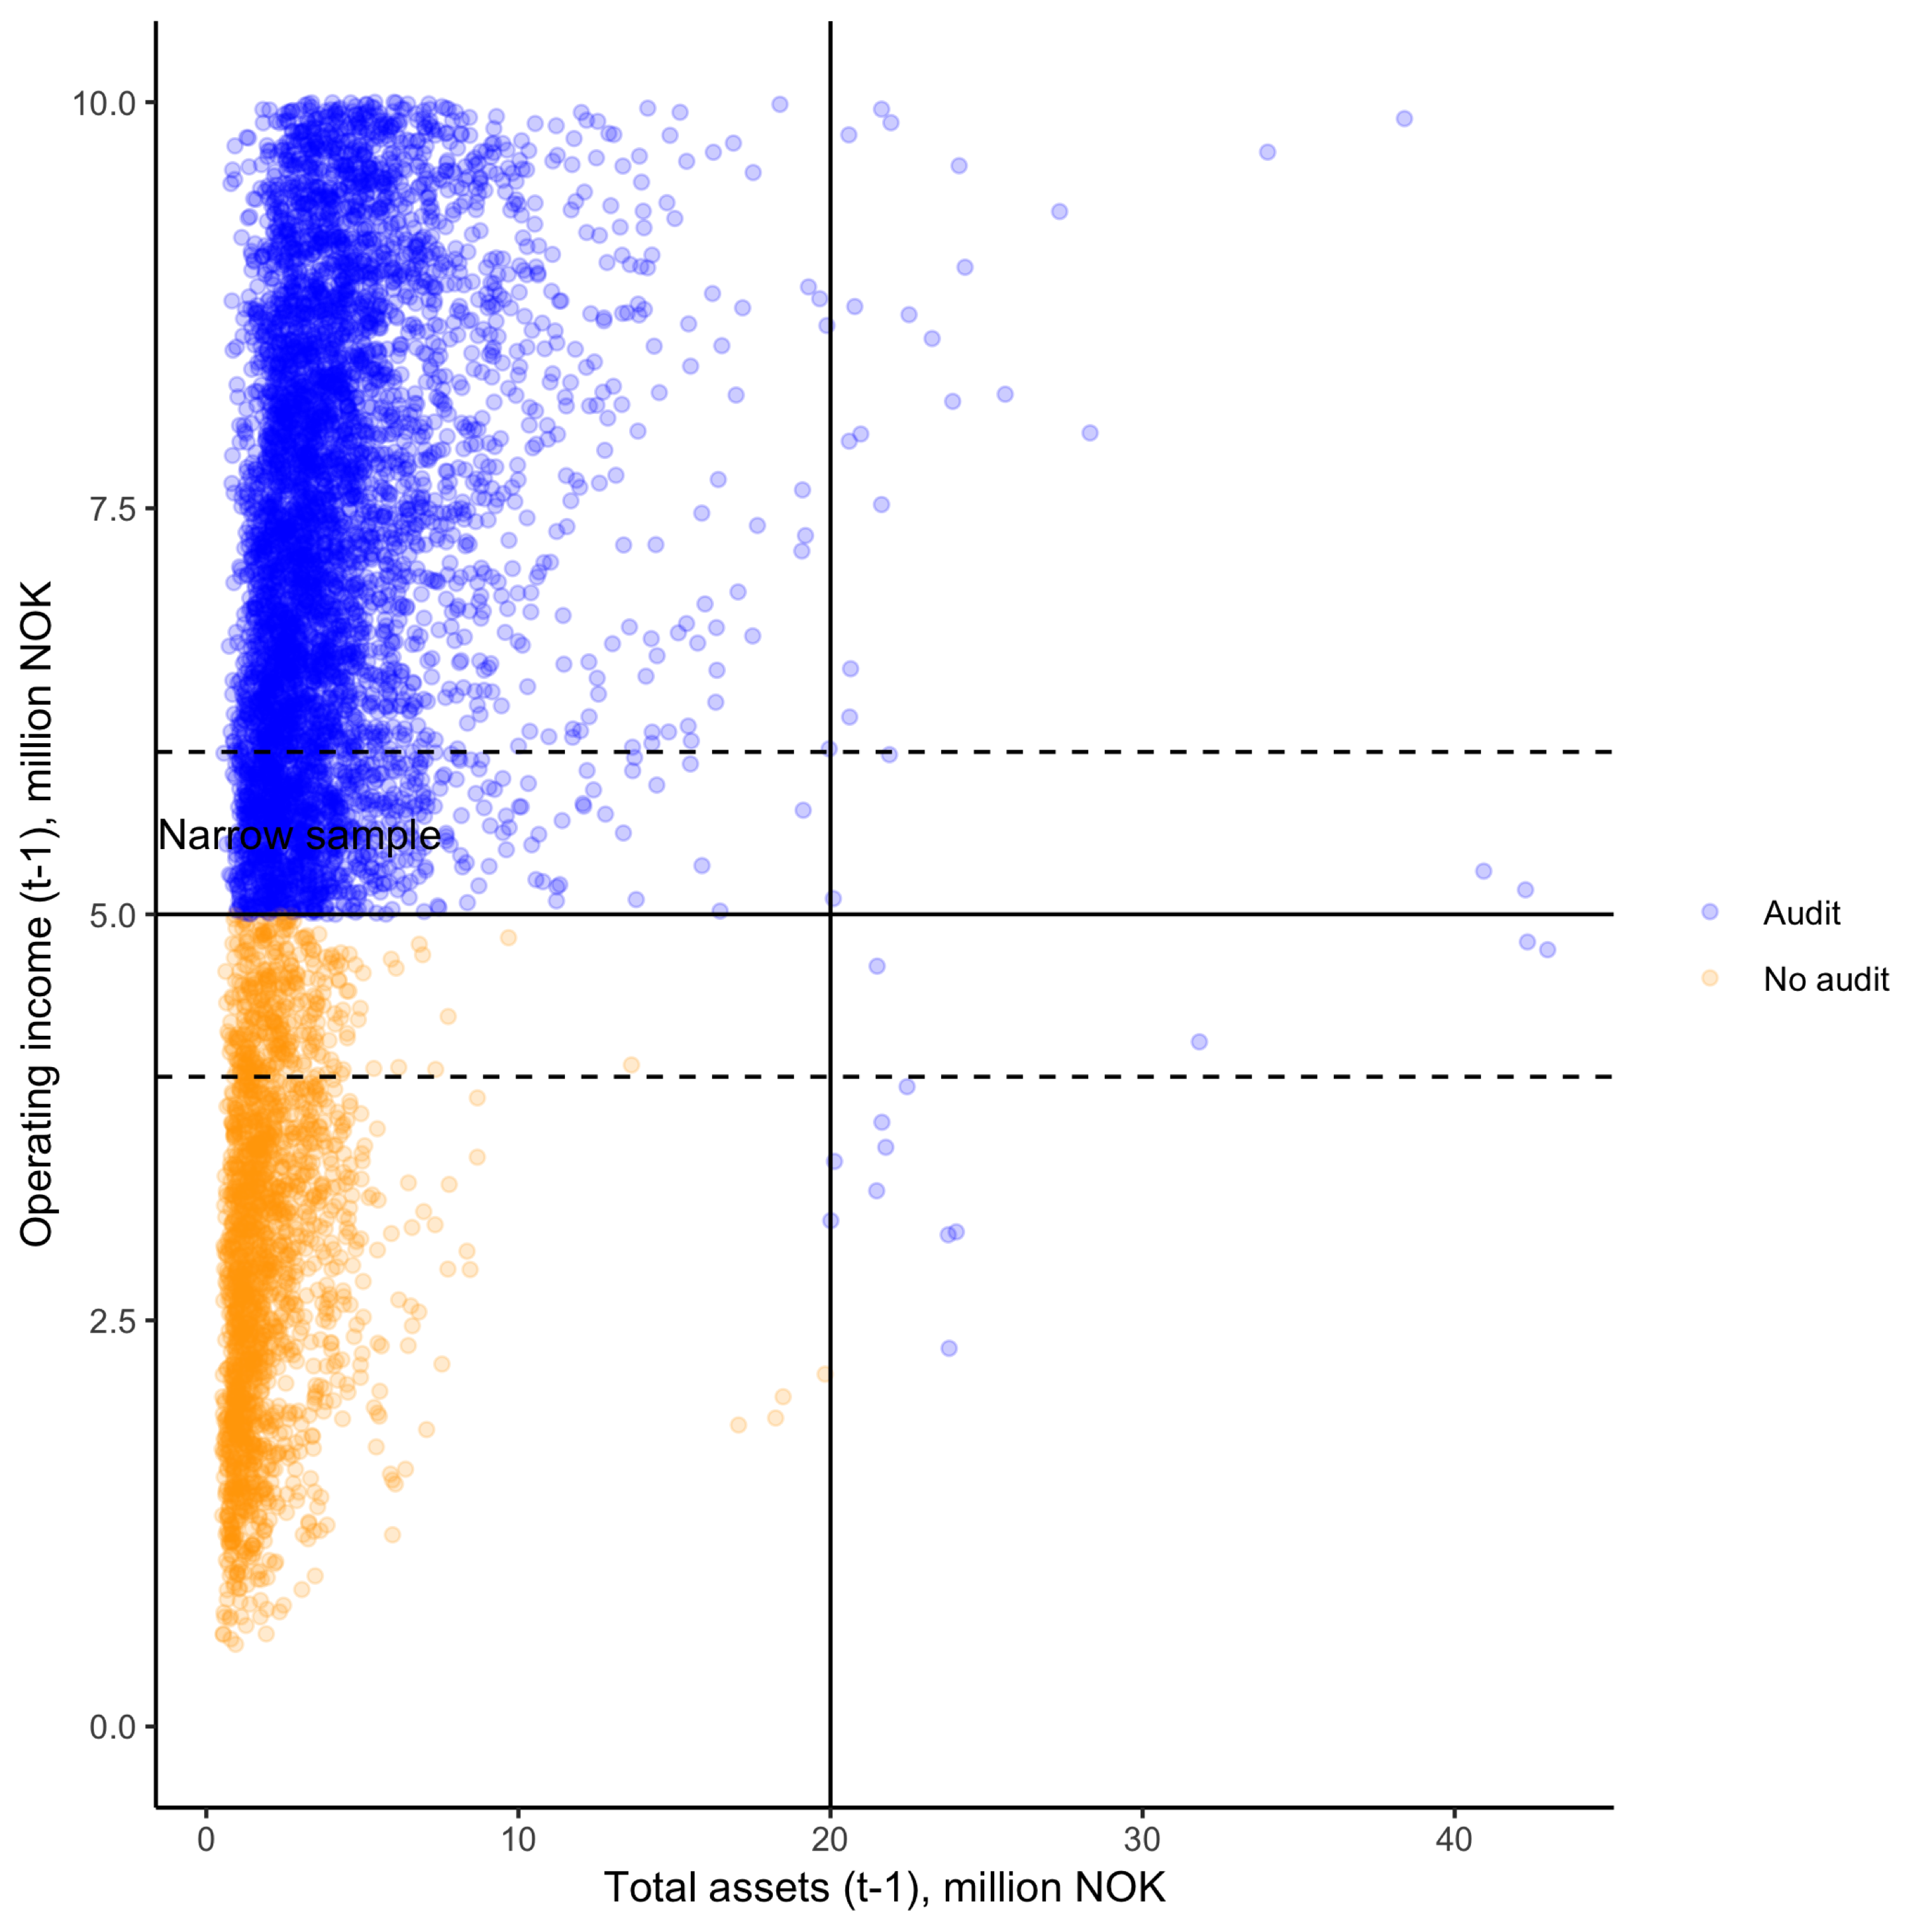
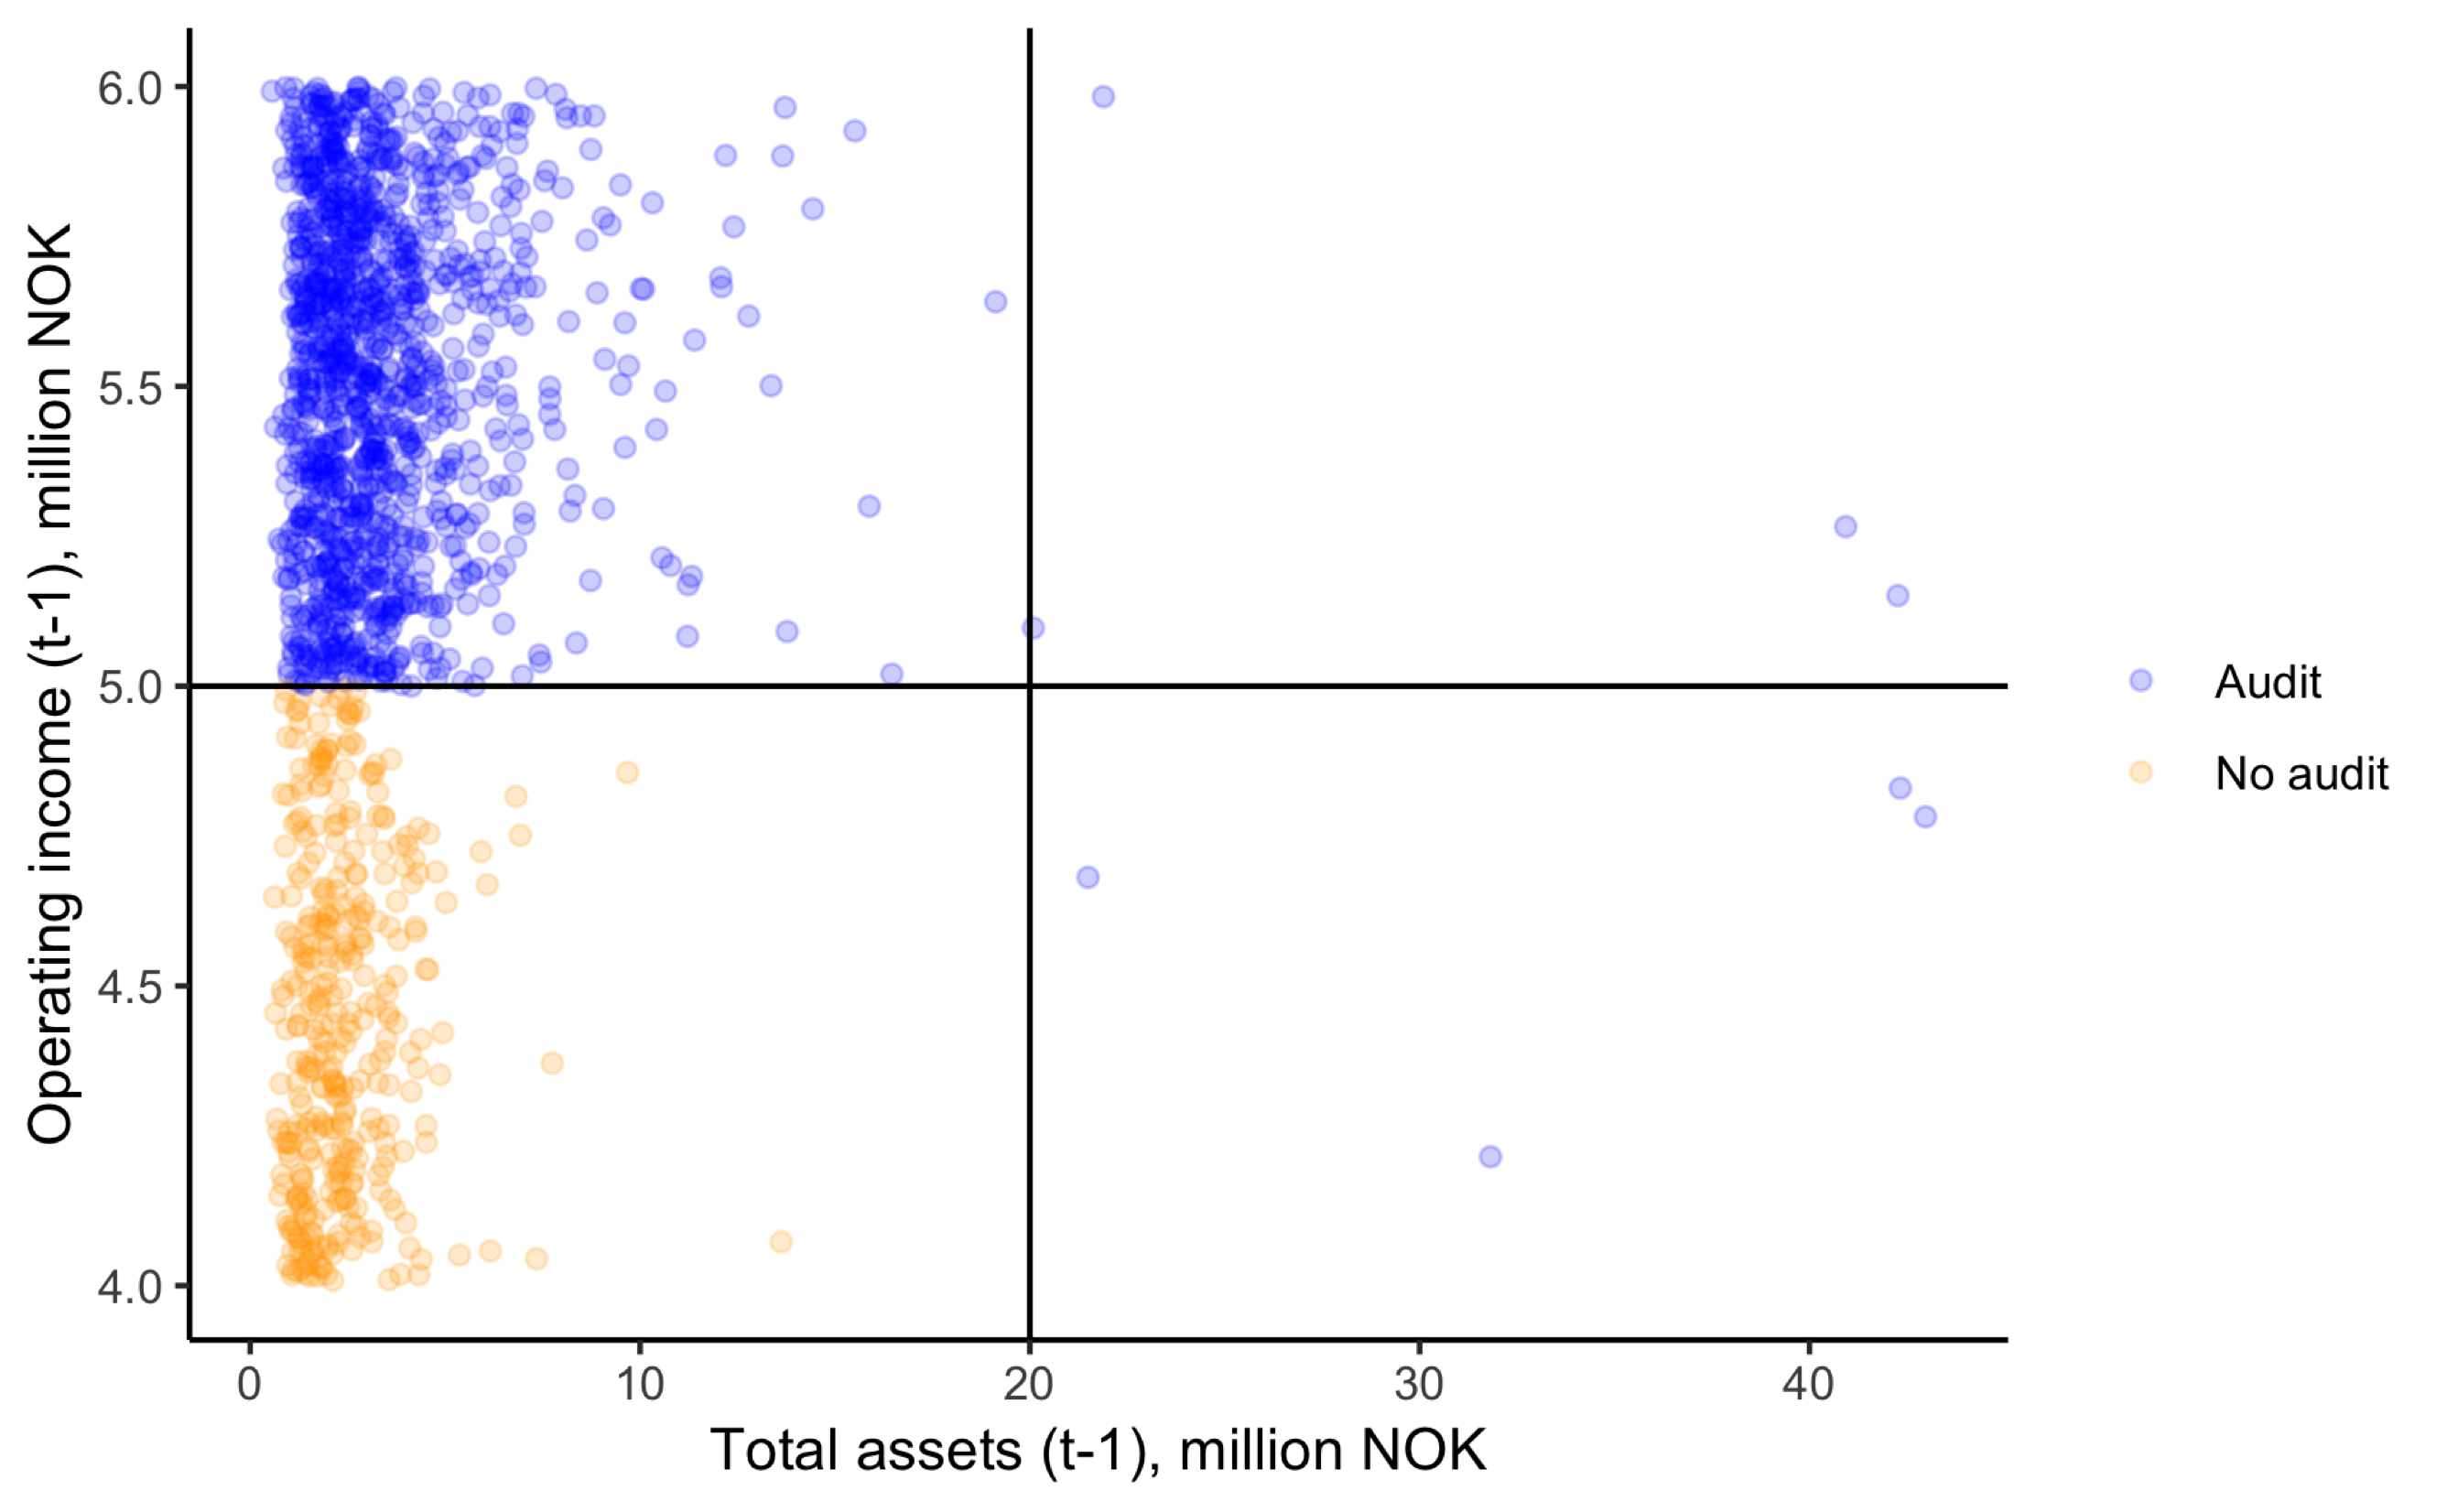
In the fifth column, results are shown where the sample is limited to firms with operating revenue of between NOK 4 and 6 million, where the threshold for eligibility was 5 million. Figure 5 shows a scatter plot of the full sample in the left panel and the narrow subset of data in the right panel, with operating revenue limited to be within plus or minus NOK 1 million of the threshold. By limiting the sample to firms closer to the threshold we are attempting to strengthen the ignorability assumption–that is, the assumption that assignment into either the control or treatment group is essentially random due to the arbitrariness of the threshold values. While the sample is reduced to a th of the original, the estimated treatment effect remains approximately the same and is significant at the 1% level.
| I | II | III | IV | V | |
| Dependent variable: | |||||
| Dividend | |||||
| Intercept | 0.020 | 0.046∗∗∗ | 0.135∗∗∗ | 0.358∗∗∗ | 0.471 |
| (0.019) | (0.016) | (0.024) | (0.108) | (0.324) | |
| noAudit | 0.275∗∗∗ | 0.044∗ | 0.152∗∗∗ | 0.140∗∗∗ | 0.161∗∗∗ |
| (0.025) | (0.023) | (0.030) | (0.030) | (0.047) | |
| operating revenue | 0.048∗∗∗ | 0.094∗∗∗ | 0.101∗∗∗ | 0.295∗∗∗ | |
| (0.009) | (0.013) | (0.013) | (0.110) | ||
| operating income (t-1) | 0.180∗∗∗ | 0.191∗∗∗ | 0.183∗∗∗ | 0.081∗∗∗ | |
| (0.011) | (0.012) | (0.013) | (0.026) | ||
| employees | 0.014∗ | 0.019∗∗ | 0.005 | 0.046∗ | |
| (0.008) | (0.009) | (0.010) | (0.027) | ||
| total assets | 0.021∗∗ | 0.038∗∗∗ | 0.043∗∗∗ | 0.078∗∗∗ | |
| (0.009) | (0.011) | (0.011) | (0.020) | ||
| risk (roa sd) | 0.043∗∗∗ | 0.075∗∗∗ | 0.071∗∗∗ | 0.00003 | |
| (0.009) | (0.013) | (0.013) | (0.024) | ||
| leverage | 0.107∗∗∗ | 0.147∗∗∗ | 0.150∗∗∗ | 0.035∗∗∗ | |
| (0.008) | (0.010) | (0.011) | (0.012) | ||
| cash flow (mean) | 0.395∗∗∗ | 0.405∗∗∗ | 0.415∗∗∗ | 0.353∗∗∗ | |
| (0.011) | (0.012) | (0.013) | (0.030) | ||
| cash (sd) | 0.054∗∗∗ | 0.065∗∗∗ | 0.052∗∗∗ | 0.018 | |
| (0.009) | (0.011) | (0.011) | (0.021) | ||
| Year FE | YES | YES | YES | YES | YES |
| Sector FE | NO | NO | NO | YES | YES |
| R2 | 0.325 | 0.341 | 0.351 | 0.218 | |
| Adjusted R2 | 0.325 | 0.340 | 0.347 | 0.192 | |
| Residual Std. Error | 0.822 | 0.882 | 0.877 | 0.641 | |
| N | 14330 | 14330 | 11110 | 11110 | 1837 |
| Standard errors are adjusted for clustering | |||||
| ∗p0.1; ∗∗p0.05; ∗∗∗p0.01 | |||||
A visualization of the main results from the specification from column five in table 4 can be seen in figure 6. The black lines represent the maximum likelihood estimate of the relationship between operating revenue and dividends, where the discontinuity at the 5 million NOK mark (red dotted line) represents the estimated effect of the auditing exemption policy. The grey lines represent uncertainty, in the form of sampling variance, of the intercept term, the coefficient on operating revenue, and the treatment effect. The uncertainty is in the form of draws from normal distributions with means and standard errors corresponding to the maximum likelihood estimations of the model. All other covariates are held fixed at their mean value.

A simple robustness check for the regression discontinuity design is to run regressions with thresholds that are immaterial. We run two such checks. First, we change the threshold from the actual 5 million NOK threshold for operating revenue to 7 million. In another check, we identify the firms that were just under the threshold and did not receive an audit but use data from 2010, before the implementation of the policy. In both cases we limited firms to those that were within 1 million NOK of the operating revenue threshold. In both cases, the threshold indicator is estimated to be close to zero and not significant. The results are shown in appendix A.
We hypothesize that auditing reduces dividends through conservative accounting practices constraining current earnings. We provide direct evidence of this mechanism by running a regression where earnings are the dependent variable. Table 5 shows the results. The first column shows results with both year and sector fixed effects. As in the results from columns three through five in table 4, firms who were eligible to forgo an auditor, but still chose to get audited are excluded. The coefficient on the noAudit indicator is positive and both statistically and economically significant .24 standard deviations. We can interpret this as firms that were able to forgo an audit increasing their reported earnings by approximately 160,000 NOK (€16,000).
| Dependent variable: | ||
| Earnings | ||
| (1) | (2) | |
| Intercept | 0.348∗∗∗ | 0.348∗∗∗ |
| (0.022) | (0.022) | |
| noAudit | 0.240∗∗∗ | 0.240∗∗∗ |
| (0.010) | (0.010) | |
| operating revenue | 0.204∗∗∗ | 0.204∗∗∗ |
| (0.009) | (0.009) | |
| operating income (t-1) | 0.018∗∗ | 0.018∗∗ |
| (0.007) | (0.007) | |
| employees | 0.087∗∗∗ | 0.087∗∗∗ |
| (0.008) | (0.008) | |
| total assets | 0.034∗∗∗ | 0.034∗∗∗ |
| (0.010) | (0.010) | |
| risk (roa sd) | 0.021∗∗∗ | 0.021∗∗∗ |
| (0.008) | (0.008) | |
| leverage | 0.531∗∗∗ | 0.531∗∗∗ |
| (0.009) | (0.009) | |
| cash flow (mean) | 0.008 | 0.008 |
| (0.008) | (0.008) | |
| cash (sd) | 0.039 | 0.039 |
| (0.079) | (0.079) | |
| Observations | 11,110 | 11,110 |
| R2 | 0.644 | 0.644 |
| Adjusted R2 | 0.642 | 0.642 |
| Residual Std. Error (df = 11040) | 0.642 | 0.642 |
| Note: | ∗p0.1; ∗∗p0.05; ∗∗∗p0.01 | |
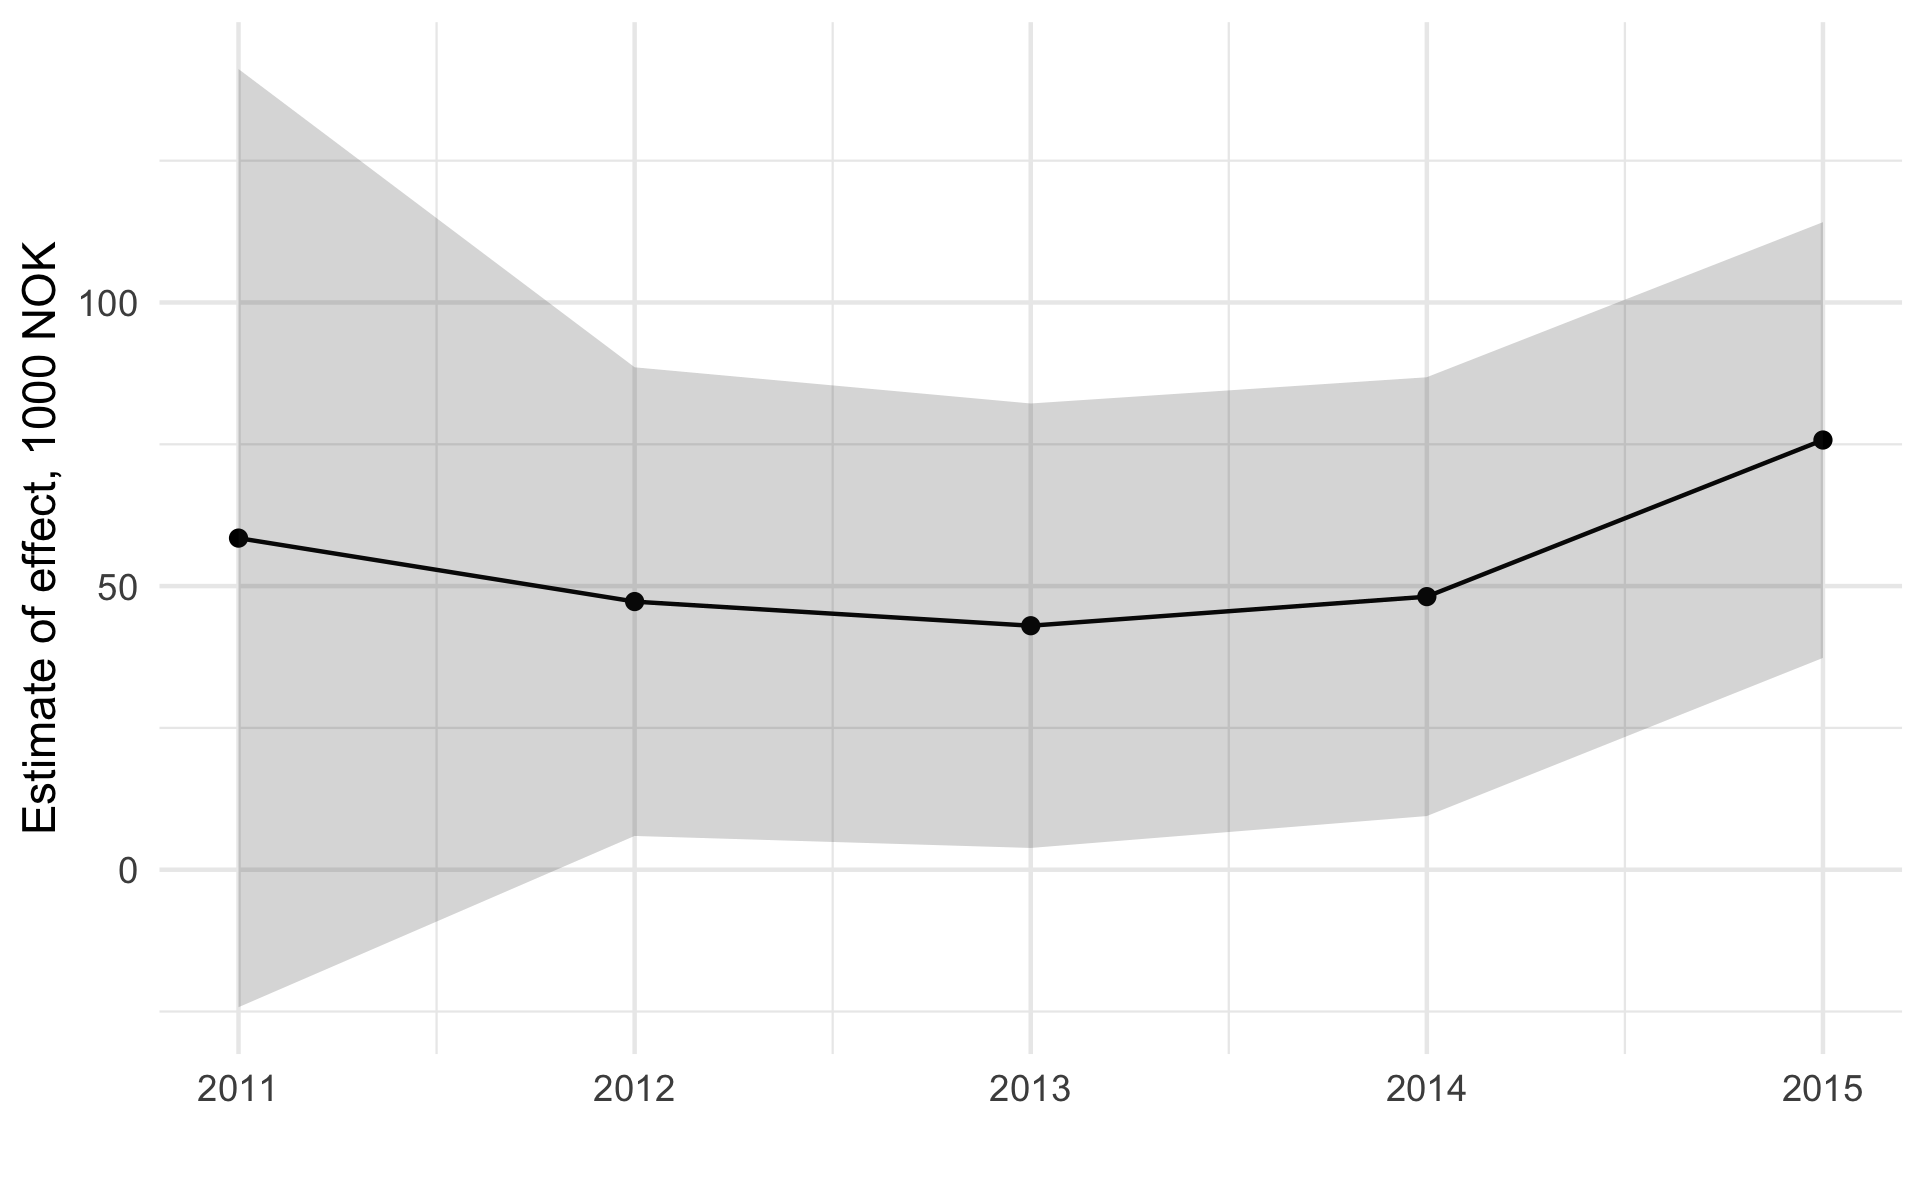
Plausibly, the effect of an audit could be short term. As firms adjust to the audit exemption, dividends may return to a normal level. We only have data through 2015–four years after the initial roll-out of the policy. But we can attempt to address this question by estimating separate effects for the policy for each of the five years 2011-2015. Results for these regressions are shown in table 6. The three columns show results from regressions where firms who were eligible to forgo an audit, but still chose to get audited were excluded. The second column shows results from a specification with sector fixed effects. The third column only includes firms with operating revenue between 4 and 6 million. The main results are presented in figure 7. The figure represents the point estimates and confidence intervals for coefficients on the audit exemption variable (noAudit) for each year 2011-2015, transformed back into the original units of 1000 NOK. The estimated effect remains roughly constant throughout the period.
| Dependent variable: | |||
| Dividend | |||
| I | II | III | |
| intercept | 0.147∗∗∗ | 0.339∗∗∗ | 0.436 |
| (0.024) | (0.109) | (0.325) | |
| noAudit:2011 | 0.167 | 0.150 | 0.015 |
| (0.106) | (0.106) | (0.180) | |
| noAudit:2012 | 0.141∗∗∗ | 0.121∗∗ | 0.137 |
| (0.053) | (0.053) | (0.086) | |
| noAudit:2013 | 0.127∗∗ | 0.110∗∗ | 0.151∗ |
| (0.050) | (0.050) | (0.082) | |
| noAudit:2014 | 0.135∗∗∗ | 0.123∗∗ | 0.159∗∗ |
| (0.050) | (0.050) | (0.080) | |
| noAudit:2015 | 0.208∗∗∗ | 0.194∗∗∗ | 0.210∗∗ |
| (0.049) | (0.049) | (0.083) | |
| operating revenue | 0.099∗∗∗ | 0.106∗∗∗ | 0.284∗∗ |
| (0.013) | (0.014) | (0.110) | |
| employees | 0.022∗∗ | 0.007 | 0.045∗ |
| (0.009) | (0.010) | (0.027) | |
| total assets | 0.014 | 0.021∗ | 0.084∗∗∗ |
| (0.011) | (0.011) | (0.020) | |
| risk (sd roa) | 0.083∗∗∗ | 0.078∗∗∗ | 0.010 |
| (0.013) | (0.014) | (0.024) | |
| leverage | 0.140∗∗∗ | 0.146∗∗∗ | 0.034∗∗∗ |
| (0.011) | (0.011) | (0.012) | |
| cash flow (mean) | 0.537∗∗∗ | 0.544∗∗∗ | 0.405∗∗∗ |
| (0.009) | (0.009) | (0.024) | |
| cash flow (sd) | 0.079∗∗∗ | 0.064∗∗∗ | 0.008 |
| (0.011) | (0.011) | (0.021) | |
| Sector FE | NO | YES | YES |
| N | 11,110 | 11,110 | 1,839 |
| R2 | 0.327 | 0.339 | 0.214 |
| Adjusted R2 | 0.326 | 0.334 | 0.186 |
| Note: | Standard errors are adjusted for clustering | ||
| ∗p0.1; ∗∗p0.05; ∗∗∗p0.01 | |||
A potential weakness of the above analysis is that the relationship between dividend payouts and firm size–as represented by operating revenue–is assumed to be linear. Plausibly, a non-linear relationship between dividend payout and firm size could lead to a biased estimate of the discontinuity term. A common solution is to model the continuous forcing variable, in our case operating revenue, as a polynomial. However, Gelman and Imbens 2017 warn that use of polynomials in the forcing variable can lead to noisy estimates and results that are sensitive to the order of the polynomial. They instead recommend the use of smoothed functions.
We therefor use a two-step regression strategy that first estimates separate smooth functions of operating revenue on dividends, over and under the policy cut-off. The smooth functions are estimated as penalized cubic regression splines where the smoothing parameter is chosen optimally through cross validation. For technical details see Hastie and Tibshirani 1990 and Wood 2006; Wood 2001. Figure 8 shows predictions from the first stage regression. The overall relationship between dividends and operating revenue is positive, as would be expected. The discontinuity at the policy cut-off point is also clear.
In the second stage, the residuals from the first stage regression are used as the dependent variable in a linear regression of the noAudit indicator and control variables.
Starting from equation 4, we can re-write the regression discontinuity as in equation 5, where and represent the separate smoothed functions of the size indicator, operating revenue, and represents the discontinuity estimate with the use of a smoothed function of the forcing variable. The vector of controlling covariates is again represented by .
| (5) |
Equation 6 shows the component equations of the two-stage regression.
| (6) | ||||
Results from the two-stage regression are presented in table 7. Standard errors and p-value indicators are adjusted to account for the full uncertainty in the two-stage regression. In the first column, the entire sample is included in the regression, including firms that voluntarily obtained an audit. The audit exemption variable becomes positive and statistically significant. In columns 2-4, firms that chose to receive an audit despite not being required to are excluded. The coefficient on the audit-exemption variable is estimated at a magnitude that is larger than in the model with a linear representation of operating revenue. When sector fixed effects are added (fourth column), the results are not materially changed. When the analysis is limited to firms with operating revenue between 4 and 6 million NOK (column 5) the estimated coefficient is reduced in magnitude but still significant and positive.
The point estimate of approximately 0.23 on the noAudit indicator in the 3rd and 4th columns can be interpreted as an audit exemption leading to a .23 standard deviation increase in a firm’s dividend. This corresponds to approximately 85,000 NOK (approximately €9,000), an economically significant amount for a small firm. Even the smaller estimate from the narrow estimation in column 5, with a coefficient of .08 corresponds to approximately 35,000 NOK (approximately €4,000). This range of estimates is roughly in line with the linear models presented earlier.

| Dependent variable | ||||
| Dividend | ||||
| (1) | (2) | (3) | (4) | |
| intercept | 0.019 | 0.120∗∗∗ | 0.285∗∗∗ | 0.252 |
| (0.016) | (0.021) | (0.109) | (0.324) | |
| noAudit | 0.151∗∗∗ | 0.257∗∗∗ | 0.225∗∗∗ | 0.083∗∗ |
| (0.022) | (0.025) | (0.026) | (0.040) | |
| employees | 0.036∗∗∗ | 0.011 | 0.031∗∗∗ | 0.041 |
| (0.007) | (0.008) | (0.010) | (0.027) | |
| risk (sd roa) | 0.021∗∗ | 0.062∗∗∗ | 0.060∗∗∗ | 0.011 |
| (0.009) | (0.013) | (0.014) | (0.024) | |
| leverage | 0.070∗∗∗ | 0.115∗∗∗ | 0.123∗∗∗ | 0.034∗∗∗ |
| (0.008) | (0.011) | (0.011) | (0.012) | |
| cash flow (mean) | 0.484∗∗∗ | 0.516∗∗∗ | 0.524∗∗∗ | 0.407∗∗∗ |
| (0.008) | (0.009) | (0.009) | (0.024) | |
| cash flow (sd) | 0.032∗∗∗ | 0.061∗∗∗ | 0.046∗∗∗ | 0.009 |
| (0.009) | (0.011) | (0.011) | (0.021) | |
| Year FE | YES | YES | YES | YES |
| Sector FE | NO | NO | YES | YES |
| N | 14,330 | 11,110 | 11,110 | 1,837 |
| R2 | 0.247 | 0.275 | 0.289 | 0.210 |
| Adjusted R2 | 0.246 | 0.275 | 0.284 | 0.185 |
| Note: | ∗p0.1; ∗∗p0.05; ∗∗∗p0.01 | |||
6 Regression discontinuity with matched control
The main empirical challenge in this article is that the correct control group–firms that were not eligible to forgo an auditor but would have forgone an auditor if they had the opportunity–is not observed. In the previous section, we have attempted to correct for this potential source of bias by including linear control variables in our estimation. We have also introduced a non-parametric representation of the forcing variable–operating revenue–to take account of the potential for a non-linear relationship with dividend policy. Still, such controls only partially correct for imbalance between treatment and control groups (Imbens and Rubin 2015).
In this section we attempt to directly improve the balance between the treatment and control groups using propensity score matching (Rubin 1979; Imbens and Rubin 2015). Intuitively, we are seeking to create an artificial control group that most resembles the treatment group.
We start by creating a logit regression model with all firms that were eligible to forgo an audit, where the dependent variable is whether they chose to forgo auditing (1) or not (0). This can be represented simply as in equation 7, where represents the matrix of predictor terms. The predicted log-odds from this model, , which we will refer to as , are the propensity scores.
| (7) |
In the matrix of predictors for the propensity score model, we include the continuous variables operating revenue, employees, total assets, leverage, return on assets and the mean and standard deviation of cash flow. we also include squared terms for all these variables as well as interaction effects between employees and operating revenue. We include fixed effects for years and industry sector. The model is complex, but the main purpose is not descriptive or interpretive, but rather to create the best possible balance between treatment and control.
From the logit model, we create the propensity scores for the treatment group, , consisting of the observations with firms under the threshold who chose to forgo auditing. A histogram of the treatment propensity scores is shown in the top panel of figure 9. We also create propensity scores for the sample of potential controls–firms not eligible to forgo auditing–that we can designate . A histogram of these propensity scores is shown in the middle panel of figure 9. The figure shows that the treatment and unmatched control groups are poorly balanced. We then use a nearest-neighbor matching algorithm so that for each treatment observation, a control observation with propensity score, is chosen such that the squared difference, , is minimized. A histogram of the matched control sample is shown in the bottom panel of figure 9. The balance between the treatment and control is now improved.

With a balanced control, we proceed with the regression analysis. The results are presented in table 8. In the first column, only the noAudit indicator and year fixed effects are included in the regression. This regression can be seen as a simple comparison of means in the treatment and control groups. The coefficient on the noAudit indicator is estimated to be positive and significant. In the second column, we add operating revenue as a control variable. We can now interpret the treatment indicator at the policy threshold for operating revenue, rather than just comparing means between groups. The estimated coefficient on the treatment indicator is now nearly doubled to 0.109 standard deviations. In the third column we also add the other continuous variables as controls and in the fourth column we add sector fixed effects. In the fifth column we limit the sample to firms with operating revenue within one million NOK of the threshold. The estimated coefficient on the treatment indicator, noAudit, remains in the range of 0.10 to 0.16 standard deviations. Converted back to the original units, this corresponds to between approximately 40,000 and 60,000 NOK (€4,000-6000).
| Dependent variable: | |||||
| Dividend | |||||
| I | II | III | IV | V | |
| Intercept | -0.300*** | -0.302*** | -0.190*** | -0.152*** | -0.123 |
| (0.030) | (0.029) | (0.030) | (0.040) | (0.627) | |
| noAudit | 0.056*** | 0.104*** | 0.130*** | 0.107*** | 0.160*** |
| (0.015) | (0.019) | (0.018) | (0.020) | (0.043) | |
| operating revenue | 0.074*** | 0.132*** | 0.106*** | 0.145* | |
| (0.013) | (0.019) | (0.023) | (0.087) | ||
| employees | -0.014*** | -0.012 | -0.000 | ||
| (0.003) | (0.008) | (0.016) | |||
| total assets | 0.095*** | 0.080* | 0.182 | ||
| (0.029) | (0.046) | (0.235) | |||
| risk (roa sd) | 0.013 | 0.006 | 0.080 | ||
| (0.019) | (0.021) | (0.110) | |||
| leverage | 0.029** | 0.031** | 0.026* | ||
| (0.013) | (0.014) | (0.015) | |||
| cash flow (mean) | 0.350*** | 0.405*** | 0.682*** | ||
| (0.041) | (0.047) | (0.112) | |||
| cash flow (sd) | -0.100*** | -0.095*** | -0.198 | ||
| (0.022) | (0.024) | (0.134) | |||
| Year FE | YES | YES | YES | YES | YES |
| Sector FE | NO | NO | YES | YES | YES |
| N | 3902 | 3902 | 3902 | 3902 | 1341 |
| R2 | 0.01 | 0.02 | 0.14 | 0.18 | 0.26 |
| Adjusted R2 | 0.01 | 0.02 | 0.14 | 0.16 | 0.23 |
| Note: | Standard errors are adjusted for clustering | ||||
| ∗p0.1; ∗∗p0.05; ∗∗∗p0.01 | |||||
7 Difference-in-difference estimators
The regression discontinuity design takes advantage of the arbitrariness of the policy thresholds on firm size. However, the design does not make full use of the panel of data to inform the estimates, as only data after the introduction of the policy is used.
As a robustness check, we make use of data prior to the introduction of the policy to do a difference-in-difference estimation. The basic intuition is that by comparing not just between treatment and control groups but also before and after the introduction of the policy, the effect of unobserved time-invariant covariates that affects selection into the treatment group can be controlled for.
The results from the difference-in-difference estimation are in line with the results from the regression discontinuity design. Coefficients on the noAudit indicator are estimated to be between .12 and .20, though these results are estimated with higher standard errors due to the inefficiency introduced due to differencing. Details of the difference-in-difference estimation and a full presentation of results can be found in Appendix C.
8 Conclusion
The level of dividends is a key decision that managers of small private firms make. Dividends reward owners for the capital they have invested. In the case of small firms where owners often serve as managers, dividends also reward the large expenditures of time and effort that owners often put into their firms. Yet managers and owners of small firms may lack financial and accounting sophistication and may not be fully aware of conservative accounting principles.
Auditing can have the effect of promoting the consistent application of conservative accounting principles and imposing a degree of financial discipline. All else equals, this will have the effect of reducing current earnings and in turn constraining dividends.
Our hypothesis is that forgoing an audit following the implementation of an audit exemption policy for small firms in Norway could lead to an increase in dividends, all else equal. Using a regression discontinuity design with both linear and non-parametric representations of the forcing variable, propensity score matching as well as difference-in-difference estimation, we consistently find statistically and economically significant effects of forgoing an audit. A representative firm on the eligibility threshold that could, and did forgo an audit, increased their average dividend by between 35-85,000 NOK (€4,000 - €9,000) compared to similar firms just above the threshold. This amount is greater than the average cost savings of forgoing an audit.
The results presented in this paper have limitations. For one, the regression discontinuity design requires that results be interpreted at the discontinuity threshold. Extrapolating the results both towards much smaller or much larger firms is not necessarily directly supported by the analysis. On the other hand, we have ex-ante no reason to believe that the results should hold only at the threshold. The theoretical underpinnings for our analysis are not contingent on a particular firm size. Neither is there anything in our empirical study that would indicate that the findings are limited to firms of a certain size.
The results should not be extrapolated to the extremes of either very small, owner-employee firms or large publicly listed firms. Yet even if the results pertain primarily to small and medium sized firms, the results are nonetheless important. Small and medium sized firms make up sizeable portions of employment and turnover in most developed economies yet receive relatively little attention by researchers compared to large publicly traded firms. The results also contribute to the understanding of auditor exemption policies. Our results indicate that the implementation of the exemption policy in Norway lead to a change in real economic behavior among small firms who did not obtain an audit. Our research does not support a normative interpretation of this change in behavior, however, and we consider a judgement of the optimality of the audit exemption policy or any level of dividends as outside the scope of this article. This article also provides evidence supporting the role of auditors in promoting accounting conservatism, and in turn how accounting conservatism can have real economic effects on the behavior of small firms.
9 Declaration of interest statement
The authors have no conflicts of interest to disclose.
References
- Allee and Yohn (2009) Allee, K. D. and T. L. Yohn (2009, January). The Demand for Financial Statements in an Unregulated Environment: An Examination of the Production and Use of Financial Statements by Privately Held Small Businesses. The Accounting Review 84(1), 1–25.
- Allen et al. (2012) Allen, L., A. Gottesman, A. Saunders, and Y. Tang (2012). The Role of Banks in Dividend Policy. Financial Management 41(3), 591–613.
- Andres et al. (2009) Andres, C., A. Betzer, M. Goergen, and L. Renneboog (2009, March). Dividend policy of German firms: A panel data analysis of partial adjustment models. Journal of Empirical Finance 16(2), 175–187.
- Angrist and Pischke (2009) Angrist, J. and J.-S. Pischke (2009, January). Mostly Harmless Econometrics: An Empiricist’s Companion (1 edition ed.). Princeton: Princeton University Press.
- Badolato et al. (2014) Badolato, P. G., D. C. Donelson, and M. Ege (2014, November). Audit committee financial expertise and earnings management: The role of status. Journal of Accounting and Economics 58(2), 208–230.
- Baker and Wurgler (2004) Baker, M. and J. Wurgler (2004, June). A Catering Theory of Dividends. The Journal of Finance 59(3), 1125–1165.
- Bauwhede et al. (2015) Bauwhede, H. V., M. D. Meyere, and P. V. Cauwenberge (2015). Financial reporting quality and the cost of debt of SMEs. Small Business Economics 45, 149–164.
- Bernard et al. (2018) Bernard, D., D. Burgstahler, and D. Kaya (2018, August). Size management by European private firms to minimize proprietary costs of disclosure. Journal of Accounting and Economics 66(1), 94–122.
- Blackwell et al. (1998) Blackwell, D. W., T. R. Noland, and D. B. Winters (1998). The Value of Auditor Assurance: Evidence from Loan Pricing. Journal of Accounting Research 36(1), 57–70.
- Bradford et al. (2017) Bradford, W., C. Chen, and S. Zhu (2017). Conservative Accounting, IFRS Convergence and Cash Dividend Payments: Evidence from China. European Financial Management 23(3), 376–414. _eprint: https://onlinelibrary.wiley.com/doi/pdf/10.1111/eufm.12114.
- Caskey and Hanlon (2013) Caskey, J. and M. Hanlon (2013). Dividend Policy at Firms Accused of Accounting Fraud. Contemporary Accounting Research 30(2), 818–850.
- Chow (1982) Chow, C. W. (1982). The Demand for External Auditing: Size, Debt and Ownership Influences. The Accounting Review 57(2), 272–291.
- Chy and Hope (2021) Chy, M. and O.-K. Hope (2021, June). Real effects of auditor conservatism. Review of Accounting Studies 26(2), 730–771.
- Clatworthy and Peel (2013) Clatworthy, M. A. and M. J. Peel (2013, May). The impact of voluntary audit and governance characteristics on accounting errors in private companies. Journal of Accounting and Public Policy 32(3), 1–25.
- Collis et al. (2004) Collis, J., R. Jarvis, and L. Skerratt (2004, June). The demand for the audit in small companies in the UK. Accounting and Business Research 34(2), 87–100.
- Downing and Langli (2019) Downing, J. and J. C. Langli (2019, January). Audit exemptions and compliance with tax and accounting regulations. Accounting and Business Research 49(1), 28–67.
- Easterbrook (1984) Easterbrook, F. H. (1984). Two Agency-Cost Explanations of Dividends. The American Economic Review 74(4), 650–659.
- Fama and French (2001) Fama, E. F. and K. R. French (2001, April). Disappearing dividends: changing firm characteristics or lower propensity to pay? Journal of Financial Economics 60(1), 3–43.
- Francis et al. (2005) Francis, J., R. LaFond, P. Olsson, and K. Schipper (2005, June). The market pricing of accruals quality. Journal of Accounting and Economics 39(2), 295–327.
- Gelman and Hill (2006) Gelman, A. and J. Hill (2006, December). Data Analysis Using Regression and Multilevel/Hierarchical Models (1 edition ed.). Cambridge ; New York: Cambridge University Press.
- Gelman and Imbens (2017) Gelman, A. and G. Imbens (2017, August). Why High-Order Polynomials Should Not Be Used in Regression Discontinuity Designs. Journal of Business & Economic Statistics, 1–10.
- Hastie and Tibshirani (1990) Hastie, T. J. and R. J. Tibshirani (1990, June). Generalized Additive Models (Chapman & Hall/CRC Monographs on Statistics & Applied Probability) (1 edition ed.). Chapman and Hall/CRC.
- Ho (2003) Ho, H. (2003, May). Dividend policies in Australia and Japan. International Advances in Economic Research 9(2), 91–100.
- Hope and Langli (2010) Hope, O. and J. C. Langli (2010, March). Auditor Independence in a Private Firm and Low Litigation Risk Setting. The Accounting Review 85(2), 573–605.
- Hribar and Jenkins (2004) Hribar, P. and N. T. Jenkins (2004, June). The Effect of Accounting Restatements on Earnings Revisions and the Estimated Cost of Capital. Review of Accounting Studies 9(2-3), 337–356.
- Imbens and Rubin (2015) Imbens, G. W. and D. B. Rubin (2015, April). Causal Inference for Statistics, Social, and Biomedical Sciences: An Introduction (1 edition ed.). New York: Cambridge University Press.
- Jensen (1986) Jensen, M. C. (1986). Agency Costs of Free Cash Flow, Corporate Finance, and Takeovers. The American Economic Review 76(2), 323–329.
- Kausar et al. (2016) Kausar, A., N. Shroff, and H. White (2016, August). Real effects of the audit choice. Journal of Accounting and Economics 62(1), 157–181.
- Kim et al. (2011) Kim, J.-B., D. A. Simunic, M. T. Stein, and C. H. Yi (2011, June). Voluntary Audits and the Cost of Debt Capital for Privately Held Firms: Korean Evidence*. Contemporary Accounting Research 28(2), 585–615.
- Koo et al. (2017) Koo, D. S., S. Ramalingegowda, and Y. Yu (2017, June). The effect of financial reporting quality on corporate dividend policy. Review of Accounting Studies 22(2), 753–790.
- Krishnan (2003) Krishnan, G. V. (2003, March). Audit Quality and the Pricing of Discretionary Accruals. AUDITING: A Journal of Practice & Theory 22(1), 109–126.
- Krishnan (2005) Krishnan, J. (2005, April). Audit Committee Quality and Internal Control: An Empirical Analysis. The Accounting Review 80(2), 649–675.
- Langli (2015) Langli, J. C. (2015, March). Evaluering av unntak for revisjonsplikt i små aksjeselskaper. Technical report.
- Lawson and Wang (2016) Lawson, B. P. and D. Wang (2016). The Earnings Quality Information Content of Dividend Policies and Audit Pricing. Contemporary Accounting Research 33(4), 1685–1719.
- Lennox and Pittman (2011) Lennox, C. S. and J. A. Pittman (2011, May). Voluntary Audits versus Mandatory Audits. The Accounting Review 86(5), 1655–1678.
- Leonard (2019) Leonard, C. (2019, August). Kochland: The Secret History of Koch Industries and Corporate Power in America. Simon & Schuster.
- Leuz (1998) Leuz, C. (1998, December). The role of accrual accounting in restricting dividends to shareholders. European Accounting Review 7(4), 579–604. Publisher: Routledge _eprint: https://doi.org/10.1080/096381898336204.
- Louis and Urcan (2015) Louis, H. and O. Urcan (2015). Agency Conflicts, Dividend Payout, and the Direct Benefits of Conservative Financial Reporting to Equity-Holders. Contemporary Accounting Research 32(2), 455–484. _eprint: https://onlinelibrary.wiley.com/doi/pdf/10.1111/1911-3846.12085.
- Manson et al. (2001) Manson, S., S. McCartney, and M. Sherer (2001, December). The Value of Management Letters to Unlisted Companies. The British Accounting Review 33(4), 549–568.
- Miller and Rock (1985) Miller, M. H. and K. Rock (1985, September). Dividend Policy under Asymmetric Information. The Journal of Finance 40(4), 1031–1051.
- Minnis (2011) Minnis, M. (2011, May). The Value of Financial Statement Verification in Debt Financing: Evidence from Private U.S. Firms. Journal of Accounting Research 49(2), 457–506.
- Rubin (1974) Rubin, D. B. (1974). Estimating causal effects of treatments in randomized and nonrandomized studies. Journal of Educational Psychology 66(5), 688–701.
- Rubin (1979) Rubin, D. B. (1979). Using Multivariate Matched Sampling and Regression Adjustment to Control Bias in Observational Studies. Journal of the American Statistical Association 74(366), 318–328.
- Sharma (2011) Sharma, V. (2011, September). Independent directors and the propensity to pay dividends. Journal of Corporate Finance 17(4), 1001–1015.
- Smith and Warner (1979) Smith, C. W. and J. B. Warner (1979, June). On financial contracting: An analysis of bond covenants. Journal of Financial Economics 7(2), 117–161.
- Smith and Watts (1992) Smith, C. W. and R. L. Watts (1992, December). The investment opportunity set and corporate financing, dividend, and compensation policies. Journal of Financial Economics 32(3), 263–292.
- Watts (2003) Watts, R. L. (2003, September). Conservatism in Accounting Part I: Explanations and Implications. Accounting Horizons 17(3), 207–221.
- Wood (2006) Wood, S. (2006, February). Generalized Additive Models: An Introduction with R (Chapman & Hall/CRC Texts in Statistical Science) (1 edition ed.). Chapman and Hall/CRC.
- Wood (2001) Wood, S. N. (2001, June). mgcv: GAMs and Generalized Ridge Regression for R. The R Journal 2001(2).
- Zhang et al. (2007) Zhang, Y., J. Zhou, and N. Zhou (2007, May). Audit committee quality, auditor independence, and internal control weaknesses. Journal of Accounting and Public Policy 26(3), 300–327.
Appendix A: Additional Descriptive Information
Figure 10 shows a scatter plot of 1-year lagged operating revenue and number of employees for firms in the sample. Here the red lines represent the thresholds for mandatory auditing. Similar to figure 2, we see that operating revenue is the binding constraint for most firms. It is also apparent that the threshold for employees, which is established in terms of full-time equivalent employees does not match well with the employee data in the data set, which is per head. Thus two employees with 50% positions would be counted as 2 employees in the data, but would count only as 1 employee relative to the threshold. The implications of this are that we can not reliably use the employee threshold as a discontinuity in our estimation. On the other hand, the threshold for employees is binding for even fewer firms than the figure initially indicates.

Appendix B: Robustness checks, regression discontinuity
| Dependent variable: | ||
| Dividends | ||
| normal | OLS | |
| (1) | (2) | |
| Intercept | 0.203∗∗∗ | 0.100 |
| (0.017) | (0.106) | |
| noAudit | 0.023 | 0.023 |
| (0.017) | (0.016) | |
| operating revenue | 0.084∗∗∗ | |
| (0.020) | ||
| employees | 0.026∗ | |
| (0.015) | ||
| total assets | 0.104∗∗∗ | |
| (0.014) | ||
| risk (ROA) | 0.002 | |
| (0.007) | ||
| leverage | 0.030∗∗∗ | |
| (0.006) | ||
| cash flow (mean) | 0.334∗∗∗ | |
| (0.015) | ||
| cash flow (sd) | 0.009 | |
| (0.014) | ||
| Year FE | YES | YES |
| Sector FE | NO | YES |
| R2 | 0.164 | |
| Adjusted R2 | 0.153 | |
| N | 5171 | 5171 |
| Residual Std. Error | 0.509 | |
| Note: | ∗p0.1; ∗∗p0.05; ∗∗∗p0.01 | |
| Dependent variable: | ||
| Dividend | ||
| I | II | |
| Intercept | -0.448*** | -0.416 |
| (0.141) | (0.971) | |
| noAudit | -0.036 | -0.017 |
| (0.058) | (0.084) | |
| operating revenue | 0.204 | 0.095 |
| (0.185) | (0.204) | |
| employees | -0.083*** | -0.016 |
| (0.018) | (0.066) | |
| total assets | 0.170*** | 0.059 |
| (0.034) | (0.094) | |
| risk (roa) | -0.037** | -0.014 |
| (0.018) | (0.052) | |
| leverage | 0.146*** | 0.090 |
| (0.026) | (0.057) | |
| cash flow (mu) | 0.4567*** | 0.286*** |
| (0.029) | (0.073) | |
| cash flow (sd) | 0.0393* | -0.015 |
| (0.023) | (0.064) | |
| Sector FE | Yes | YES |
| R2 | 0.12 | 0.28 |
| Adjusted R2 | 0.10 | 0.18 |
| N | 2861 | 398 |
| RMSE | 0.83 | 0.59 |
Appendix C: Difference-in-difference
The regression discontinuity design takes advantage of the arbitrariness of the policy thresholds on firm size. However, the design does not make full use of the panel of data to inform the estimates, as only data after the introduction of the policy is used.
In this section, we make use of data prior to the introduction of the policy in order to aid in estimating an unbiased treatment effect. The basic intuition is that by comparing not just between treatment and control groups but also before and after the introduction of the policy, the effect of unobserved time-invariant covariates that affects selection into the treatment group can be implicitly controlled for.
Following the notation of Angrist and Pischke 2009, consider the simple model:
| (8) |
Here represents the dividend for a firm i, in state s (receiving or not receiving an audit), at time t (2012, the first year with a full roll-out of the policy or 2010, the last year of the old regime).66 6 As can be seen visually in figure2, 2011 had a limited role-out of the policy represents the state effect on dividend payout, while represents the time period effect. is the indicator variable for the policy, where again represents the effect of the policy.
Taking the expectation and differencing across periods for both treatment and control groups gives:
| (9) | |||
| (10) |
The population difference-in-difference estimator can then be written:
| (11) | ||||
9.1 Results, difference-in-difference
We seek to improve the efficiency of the difference-in-difference estimator by controlling for continuous covariates that vary across the threshold. This includes the number of employees, operating revenue, total assets and a measure of risk (return on assets).
The regression equation can be written:
| (12) |
Here represents the first difference for firm dividends between years 2012 and 2010. we drop the t index, as the relevant treatment indicator and covariates are for 2012, the year when the policy was fully put in place. The treatment indicator can then be interpreted as the change in firm dividend between 2012 and 2010 in the treatment group, relative to the change in dividend in the control group and conditional on the observable covariates represented by the matrices and .
Table 11 shows results from the estimation. The first column shows results where only an intercept and the treatment effect are included. In the second column, covariates of firm size, risk and solidity are included. Mean and standard deviations of cash flow are also included. The point estimate moves from being negative in the first column to positive and significant at the 10% level in the second column. In the third and fourth columns, the data is limited to firms with operating revenue between 4 and 6 million NOK, where the fourth column also includes sector fixed effects. Limiting the sample to firms between 4 and 6 million leads to a higher point estimate of the treatment effect, though the inclusion of fixed effects reduces the point estimate and increases the standard error.
| I | II | III | IV | |
| Intercept | 0.017 | -0.082** | -0.170*** | -0.314 |
| (0.023) | (0.041) | (0.052) | (0.736) | |
| noAudit | -0.095* | 0.125* | 0.201* | 0.141 |
| (0.055) | (0.074) | (0.109) | (0.119) | |
| operating revenue | 0.072** | 0.508** | 0.418 | |
| (0.031) | (0.243) | (0.262) | ||
| employees | 0.006 | -0.061 | -0.108* | |
| (0.023) | (0.049) | (0.064) | ||
| total assets | 0.018 | 0.157*** | 0.168*** | |
| (0.026) | (0.048) | (0.051) | ||
| risk_roa | -0.028 | 0.104** | 0.121** | |
| (0.027) | (0.048) | (0.052) | ||
| cash_flow_mu | 0.152*** | 0.139** | 0.186*** | |
| (0.023) | (0.060) | (0.070) | ||
| cash_flow_sd | 0.008 | -0.239*** | -0.324*** | |
| (0.029) | (0.075) | (0.086) | ||
| Sector FE | NO | NO | NO | YES |
| N | 2231 | 2231 | 374 | 374 |
| R2 | 0.00 | 0.03 | 0.06 | 0.13 |
| Adjusted R2 | 0.00 | 0.03 | 0.05 | -0.00 |
The results from the difference-in-difference model were estimated with more uncertainty, which is to be expected given that the left-hand-side variable is now a differenced variable, and we only use data from two years. Nonetheless, the sign and magnitude of the point-estimates are in line with the results from the regression discontinuity design and adds to the evidence that allowing firms to forgo an auditor leads to on average higher dividend pay-out.