Design and Assessment of a Bimanual Haptic Epidural Needle Insertion Simulator
Thanks: This research was supported in part by the Israeli Science Foundation (grant 327/20) and by the Helmsley Charitable Trust through the Agricultural, Biological and Cognitive Robotics Initiative and by the Marcus Endowment Fund, both at Ben-Gurion University of the Negev.Thanks: Nitsan Davidor and Ilana Nisky are from the Department of Biomedical Engineering and the School of Brain Sciences and Cognition, Ben-Gurion University of the Negev, Beer Sheva, Israel.
nitsanti@post.bgu.ac.il,
nisky@bgu.ac.ilThanks: Tamar Hayuni and Yair Binyamin are from the Department of Anesthesiology, Soroka Medical Center, Ben-Gurion University of the Negev, Beer Sheva, Israel.
yairben1@gmail.com,
tamarhayuni@gmail.com
Abstract
The case experience of anesthesiologists is one of the leading causes of accidental dural punctures and failed epidurals - the most common complications of epidural analgesia used for pain relief during delivery. We designed a bimanual haptic simulator to train anesthesiologists and optimize epidural analgesia skill acquisition. We present an assessment study conducted with 22 anesthesiologists of different competency levels from several Israeli hospitals. Our simulator emulates the forces applied to the epidural (Touhy) needle, held by one hand, and those applied to the Loss of Resistance (LOR) syringe, held by the other one. The resistance is calculated based on a model of the epidural region layers parameterized by the weight of the patient. We measured the movements of both haptic devices and quantified the results’ rate (success, failed epidurals, and dural punctures), insertion strategies, and the participants’ answers to questionnaires about their perception of the simulation realism. We demonstrated good construct validity by showing that the simulator can distinguish between real-life novices and experts. Face and content validity were examined by studying users’ impressions regarding the simulator’s realism and fulfillment of purpose. We found differences in strategies between different level anesthesiologists, and suggest trainee-based instruction in advanced training stages.
I Introduction
Delivery is one of the most painful experiences in a woman’s life, and epidural analgesia is the most common option for pain relief during delivery with a rate of 60% in Israel [1] and 71% in the United States [2]. Epidural injections are also used to relieve pain in the chest, abdominal, and lower extremity surgeries and for chronic pain relief [3]. The two most common errors or complications of epidural analgesia are failed epidurals (FE), which are insertions of the needle to a superficial location (that will not produce analgesia and cause the need to perform a re-do), and dural punctures (DP), occurring in 0.4-6% of cases [4], leading to post-dural puncture headaches in 70-80% of the cases [5] and subsequently longer hospitalizations [6], higher chronic pain rates [7], and postpartum depression. The most prominent risk factor for both errors is the experience of the anesthesiologists [8] who attain competency within 1-90 attempts [9].

In the epidural anesthesia procedure, medication is inserted into the epidural space, allowing it to block pain signals from traveling from the spine to the brain, hence producing analgesia [10]. To arrive at the epidural space, the anesthesiologists use an epidural (Touhy) needle, i.e., a hollow needle with a curved tip [11, 12]. The needle is inserted into the patient’s skin in the back area. It proceeds through several tissues located between the skin and the epidural space (Fig. 1) while avoiding the spinous process. Once the Touhy needle is ultimately inserted into the epidural space, a catheter may be threaded through the Touhy needle and remain there after the needle has been removed. The anesthetic is then administered using said catheter. The task of stopping the needle immediately after passing the rigid Ligamentum Flavum (i.e., the final tissue preceding the epidural space) is mechanically challenging and requires extensive technical training [9]. The thickness of the epidural space in the lumbar region is 5-17 millimeters (depending on patient parameters) [13], which creates a very small margin for error, and continued movement with the needle will cause an Accidental Dural Puncture (ADP). This is exacerbated by patient variability [8] (e.g., due to obesity or age) affecting the dimensions and stiffness of the layers [13, 14, 15].
Since epidural needle insertion is a blind procedure, the ”loss of resistance” (LOR) technique helps identify the epidural space as the Touhy needle encounters the various ligaments of the lumbar vertebral column [16, 12] (Fig. 1). This technique is bimanual; the anesthesiologists insert the Touhy needle into the ligaments with one hand and attach a minimal-friction syringe filled with air or saline to the end of the needle with the other hand. Then, they push the needle to advance it and sense the stiffness by applying a force to the plunger with their thumb. The tougher and more fibrous Ligamentum Flavum applies a high resistive force on the needle and the fluid, but once the needle enters the epidural space, the resistance is lost (hence LOR) [17, 12]. This haptic feedback informs the operator of the needle location within the various tissue layers and loss of resistance from potential spaces [17]. Since the task is complex and relies on delicate haptic information, several systems assisting epidural needle insertions have been developed, including [18], which presented a novel controller, providing augmented force perception to the operator and newly emerging techniques that assist by guiding the needle to the epidural space, or by helping the operator correctly identify the loss of resistance [12].
Due to the challenges of the task, the procedure is considered the most difficult technique among anesthetic manual tasks to be learned by residents [19, 9]. However, even in state-of-the-art training curricula for anesthesiology residents, they do not acquire knowledge and skills in a controlled and safe environment under close supervision. Instead, the training is performed as part of their clinical practice, which is limited by the residents’ restricted working hours and, more importantly, jeopardizes patient safety [20, 21].
Medical simulation may solve the trade-off between allowing for high-quality skill acquisition and unharmed patient care. Integrating simulations into resident training programs allows for certain skills to be acquired before meeting the first patient in a clinical setting [21]. Furthermore, practicing a range of manual skills in a virtual environment can be standardized and adjusted to create the desired settings. Residents can repeatedly train at any time until mastering the task [22] while maintaining patient safety [20]. Simulation-based training is beneficial as an addition to traditional training methods in simulated hypoxemia and hypotension scenarios [23] and in simulated central venous catheter (CVC) insertions [22]. In the latter, the effects were shown to diminish over time, and, thus, training was suggested to be maintained by repetitive simulation practice. Medical simulation was also shown to be effective in simulating needle insertions and lumbar punctures – commercially available haptic devices have been successfully utilized for needle insertion simulators in the past [24, 25]. Another application of medical simulation is the assessment of trainee level [20], which may potentially eliminate the effect of subjectivity in resident-level assessment in many manual tasks.
In the development of any type of simulator, it is essential to thoroughly investigate its validity. A simulator is considered valid if it accurately reflects the task it is designed to simulate with regard to the specific learning goals and the target population [26]. There are three primary types of validity to consider in simulation design: face validity, content validity, and construct validity. Face validity is the subjective view users have of how realistic a simulation is, and it can be evaluated using subjective reports, e.g., questionnaires about the resemblance level of each part of the simulator to the real-life environment [26, 27, 28, 15]. When examining face validity, it is important to take into consideration the users’ ability to respond to questionnaires and rely more on responses given by users with rich experience in the real-life task [26, 29, 30]. Content validity, another subjective assessment of simulators, examines the usefulness of a simulation in its original purpose [31], e.g., as a training or an assessment tool, as viewed by expert users [31, 32].
Construct validity is a more objective assessment of simulators, compared to face and content validity; it determines whether the simulator can differentiate between real-life experts and novices. As such, it is considered one of the most important aspects of simulation evaluation [28]. Construct validity testifies to the simulator’s ability to provide an accurate representation of the real task; a simulation with good construct validity should be able to accurately reflect the differences in performance among individuals, such as between real-life novices and experts, and also within individuals as they develop over time. This would show that the simulation is consistent with the real-world principles [26, 15]. Testing construct validity can be performed through expert versus novice comparisons [26, 33, 34, 27, 28, 15]. Its assessment is more objective than face and content validity as it can be tested in a more neutral and impersonal manner.
Several epidural simulators have been designed since the early 1980s, and they consist of two types: manikins [14, 35, 36] and robotic [15, 37, 27, 38, 13]. Manikin simulators allow the palpation of the vertebral column, which assists the anesthesiologists in identifying the correct initial needle insertion site [35, 36]. However, they do not support any patient variability nor allow modification of the training difficulty, geometry, or mechanical resistance of the tissue with trainee progress [14].
Robotic simulators use haptic devices to render resistive forces [14] that emulate the forces applied to the Touhy needle when encountering the different tissues in the epidural region [37]. Such simulators enable representation of various body types [14, 15, 27]. Additionally, kinematic data, such as injection trajectories and velocities, can be recorded to provide information on the trainees’ progress and improvement with practice. Examples of previous haptic epidural simulators include an electrical haptic interface coupled with a pneumatic cylinder [37] and a motor with a pulley-cable mechanism for transmitting forces in the needle insertion direction [27]. In another simulator [38], the force data was obtained in a needle insertion trial on a porcine cadaver and used to recreate the feeling of epidural insertion.
Robotic epidural simulators are effective and promising [14], but there is still much room for further development. Previous simulators were uni-manual, although this task is performed bimanually in real-life. They simulated only the forces applied to the Touhy needle without considering those applied to the LOR syringe, an important tool for perceiving the environment stiffness [16, 17]. Additionally, using the kinematic data acquired by both haptic devices – and, more specifically, the data regarding probing movements performed using the LOR syringe – allows for a deeper analysis of strategies, which can assist in the understanding of better training approaches [39]. This cannot be done in a uni-manual configuration. Furthermore, a smart training program based on sensorimotor learning principles [40, 41] has never been introduced into these robotic simulators. Although robotic simulators today can facilitate patient-based variability, a training program incorporating variability and other motor learning principles has never been designed and implemented.
Some robotic simulators, such as the Mediseus [15], provide, in addition to the haptic feedback, visual feedback as to the needle’s location within the patient’s body during the procedure. This may be especially beneficial at the beginning of the training to build a mental map between the experienced forces and the penetration into the different layers. However, even though it may assist the user, visual feedback does not exist in the real procedure and, therefore, may be unnecessary and impede transfer to real procedures. Therefore, in the current study, we chose to develop and assess our robotic simulator without the addition of such visual feedback.
We developed a novel simulator that incorporates the haptic feedback, which is received in both hands, using two haptic devices. By doing so, we provide the user with haptic information not only to emulate the forces applied to the Touhy needle but also to the LOR syringe. Additionally, we implemented the simulation with patient weight variability. This was done to account for the different patient body types that affect the task in the real-life procedure and to set the ground for testing the added value of motor variability and its ability to enhance learning in this task in the future. We present the simulator design and the results of an assessment study. To test face and content validity, we collected the answers to visual analog scale (VAS) questionnaires testing the simulator’s resemblance to the real-life task and its suitability as a training or assessment tool. To test construct validity, we compared the success rates of anesthesiologists with different competency levels. We also examined error rates and sizes across participant levels. Further, we studied the movement control strategies that participants employed by measuring their velocities in the different layers of the epidural region and utilization of the probing tool – the number of probing movements participants performed with the LOR syringe, their depth, and rate.
II Methods
II-A Simulator Design
We designed a bimanual simulator using two ’Phantom Omni’ haptic devices (Fig. 2a). One haptic device is mounted by a Touhy needle (Fig. 2b), and the other is connected to an LOR syringe (Fig. 2c). Both the Touhy needle and the LOR syringe were connected to the haptic devices using 3D-printed custom-made adapters using an ’Ultimaker S5’ printer.

To render resistive forces, we used the ’Chai-3D’ C++ simulation framework (the code will be released upon publication). We used Visual Studio 2013, on a ’Dell Inspiron 13’ laptop. The use of a laptop, in addition to the two haptic devices (which are light-weighted), allowed for transporting the simulator to different hospitals or medical conferences to reach anesthesiologist participants population.
| Tissue | Stage | a0 [N] | a1 [N/mm] | a2 [N/mm2] | a3 [N/mm3] | d range [mm] |
| Skin | BP | 0.0075 | 0.0037 | 0.0015 | 0.0008 | |
| Fat | AP | 1.9212 | 0.1437 | 0.1682 | 0 | |
| Supraspinous Ligament | BP | 0.628 | 0.2637 | 0.0343 | 0 | |
| AP | 1.3855 | 0.7174 | 0.0923 | 0 | ||
| Interspinous Ligament | BP | 1.4021 | 0.3054 | 0 | 0 | |
| AP | 2.3761 | 0 | 0 | 0 | ||
| Ligamentum Flavum | BP | 2.3761 | 0.4783 | 0.0186 | 0 | |
| AP | 3.861 | 0.0539 | 0.0375 | 0 | ||
| Epidural Space | – | 0 | 0 | 0 | 0 |
We relied on the model proposed in [13] to render resistive forces as the trainees cross the different layers in the epidural region (Fig. 3). According to this model, each tissue can be emulated by creating a different non-linear spring – polynomials with different orders and parameters mapping the instantaneous penetration depth of the needle into the tissue layer to a force applied by the haptic devices according to:
| (1) |
where represents the needle penetration depth into the tissue layer (in mm), and and are constants that differ between the different tissue layers and regions within each layer, and their values are presented in Table I.
This model considers each tissue in the epidural region and subdivides the needle insertion forces in most tissue layers into two regions: before and after the puncture of the tissue layer (BP and AP, respectively). The forces applied before the puncture (BP) result from the stiffness forces that are affected by the tissue elasticity before its perforation. The forces applied after the puncture (AP) can be modeled as a sum of the cutting force, which is the force required to cut through the tissue, and the frictional force, caused by the needle shaft’s contact within the tissue [13]. Because the Subcutaneous Fat is encountered right after the puncturing of the skin, the skin layer includes only the BP stage, and the fat comprises only the AP stage. The epidural space is not a layer that can be punctured, but rather a space to be entered into, and hence does not have BP and AP regions and generally has zero resistance. Note that although the skin is commonly regarded as a tissue that requires a very high cutting force, the Ligamentum Flavum has been shown in several force models (including [13] and [25, 42]) to require an even higher cutting force.

II-A1 Empirical adjustment of the model
To account for the limitations of our haptic devices (3DSystems Touch), such as high friction and a limited force range, we implemented some adjustments to the force model proposed in [13]. The purpose of these adjustments was to amend the model such that the forces would be as realistic as possible by verifying it with an expert user. We iteratively changed the parameters with the help of an expert anesthesiologist (author YB) until he found the model appropriate. As a result of this process, the parameters in Table I are adjusted compared to those proposed in [13], such that the parameters in [13] for the haptic device connected to the Touhy needle, and for a patient of an average body mass of 71 kg, are multiplied by a scaling factor of 0.3. Additionally, we set the epidural space’s force to zero (unlike the value of 2.5 N, proposed in [13]) to intensify the sense of loss of resistance. To render the forces applied by the second haptic device, which is connected to the LOR syringe, we used a scaling factor of 2 (). We opted not to incorporate the deflection model proposed in [13] for simplicity and since this is the first prototype of the simulator.
II-A2 Introducing patient weight variability
To add patient weight-related variability, we adopted an adjustment to the model of the epidural regions of female patients with variable body masses proposed in [13]. We added variability in layer thickness and stiffness according to:
| (2) |
where is the tissue thickness, is the average tissue thickness (according to ranges in Table I). is the average female waist area, is the average female waist radius, is the relevant body mass in kg, and is the average body mass for a female patient aged between 20-29 years; all according to [13]. We used the average patient weight of 71 kg in some of the trials and three different body masses of 55, 85, and 115 kg when we wanted to add patient weight variability (see details in the ’experimental procedures’ section). These figures were inserted into Eq. 2, with the different values of affecting the tissue thickness.
To account for the patient weight effect on tissue stiffness, we divided by . This scaling yielded changes in the stiffness and thickness of each layer according to the patient body mass. However, the value of the rendered force in the layer was unchanged, as depicted in Fig. 3b, where two patients of different body masses (55 kg in gray in 115 kg in black) are shown. In this example, the challenge is highlighted – the epidural space of the patient with the lower body mass is more superficial than that of the patient with the higher body mass and is at a depth equal to that of the higher body mass patient’s Subcutaneous Fat.
II-B Experimental Procedures
The experiment included two sessions of data collection: the first () took place in Soroka Medical Center. The second session () was conducted during the 2021 Israel Society of Anesthesiologists annual conference (Tel Aviv, Nov 2021). We set up a booth at the conference and invited the attendees to participate. In total, 22 anesthesiologists from several hospitals in Israel, with different levels of experience, participated in our experiment. The participants were volunteers and had no previous connection with the authors. They all signed an informed consent form, as stipulated by the human participants’ research committee approval, and were not compensated for their participation. To assess their skill level, we asked participants to fill out questionnaires in which we inquired about their years of experience, an estimated number of epidural injections they had performed thus far, and whether they were residents or attendings.
|
|
|
Position | |||||||
|---|---|---|---|---|---|---|---|---|---|---|
| 1 | 0 to 1 | 0 to 50 | Resident | |||||||
| 2 | 1+ to 3 | 50+ to 300 | ||||||||
| 3 | Over 3 | Over 300 | Attending |
Participants sat next to a table on which the two haptic devices were placed. They were instructed to hold the Touhy needle (connected to one haptic device) with their non-dominant hand and the LOR syringe (connected to the second haptic device) with their dominant hand, similar to the technique used in real procedures. During the experiment, the participants wore headphones with active noise cancelling effect (Bose QC35) to eliminate auditory cues, including noises produced by the haptic devices, and more specifically, a noise produced when arriving at the epidural space and losing resistance. Such noises are not present in the real-life procedure and might affect performance, and hence should be eliminated. The participants received no auditory or visual information, as this simulator version provides solely haptic feedback.
During the first data collection session, the experiment consisted of 12 test trials. Since this protocol lacked a period of acclimatization to the simulator, we decided to add three familiarization trials at the beginning, such that in the second data collection session, the experiment consisted of 15 trials: three familiarization trials followed by 12 test trials. In each trial, the participants were instructed to perform a virtual needle insertion using the simulator and verbally indicate when they reached the selected injection site (i.e., where they perceived the epidural space was, and where they would insert the epidural catheter). Participants were told the patient’s body mass at the beginning of each trial, as such information is available in the real-life procedure. During the familiarization trials, participants were allowed to familiarize themselves with the virtual environment and were provided feedback on the trial result. A ‘success’ would be identifying the epidural space correctly. For a patient with an average body mass, as shown in Table I, a trial would be considered successful if the participant identified the epidural space in the range of mm (where is the final needle penetration depth, where the participant chooses to halt and provide a verbal cue). A ‘failed epidural’ would be an undershoot ( mm), which in real-life would result in the need to perform a re-do, and a ‘dural puncture’ would be an overshoot ( mm). During the test trials, participants received no feedback as to the trial result.
The forces exerted by the haptic devices in the familiarization trials were designed to emulate the epidural region of a female patient with an average weight of 71 kg (Table I). In the test trials, the exerted forces emulated three different patient body masses; 55, 85, and 115 kg. Each weight appeared four times, and the order of the trials was mixed into four blocks of the three patient weights.
II-C Data Analysis
II-C1 Data recording
We recorded the kinematic data (insertion trajectory, velocity, and final injection site) of both haptic devices (each of them separately) at approximately 1 kHz. This allowed online error feedback (which was provided to participants in the familiarization trials, see more in the ’experimental procedures’ section) and offline data analysis for trainee evaluation and progress monitoring. Since the data was recorded from both haptic devices, we were able to examine the kinematics of the Touhy needle and the LOR syringe separately (Fig. 4, 5). Therefore, we could observe not only the proceeding through the different tissues in the epidural region (which is performed using the Touhy needle) but also examine the probing movements performed with the LOR syringe, which are used to perceive the environment stiffness. We did not use the familiarization trials for the data analyses but rather the test trials only. To eliminate differences in familiarization between the two data collection sessions, we used only the final nine trials of the data collected during the first session.
Anesthesiologists’ levels (novices N=6, intermediates N=9, and experts N=7) were determined according to a tailored level assignment system (Table II), which took into consideration the anesthesiologists’ years of experience, an estimated number of epidural injections they had performed prior to participating in the study, and whether they were residents or attendings. For each of the three categories, we determined the categorical level per participant (the level could be assigned as either one, two, or three). Next, to achieve the overall level of the anesthesiologist, we averaged and rounded the levels.
II-C2 Performance and validity analysis
To study the performance in the task, i.e., to quantify the rate of the three result types: failed epidural, success, and dural puncture, we recorded the final injection site chosen by the participant in each trial. Then, we examined the result for each trial and the rate of each result per participant throughout the test trials. We compared the failed epidural, success, and dural puncture rates of participants in the three different levels. The success rate allows for assessing the trainee’s level of competency when performing the procedure in the virtual environment. When examining the trainee’s errors, we can learn more about their strategies. For instance, a higher rate of failed epidurals could imply excessive caution, as opposed to a higher rate of dural punctures, which could indicate recklessness.
To assess the simulator’s construct validity, we aimed to test users’ performances in the simulated environment. The reasoning behind that was that demonstrating that real-life experts perform better with the simulator compared to novices will show good construct validity. To do so, we examined the success rates (the metric best suited to assess performance level) of participants in different experience levels. In addition, we used the final injection sites to calculate the error size in millimeters in each trial. This was defined as the distance of the chosen injection site from the correct epidural space location. A successful trial would yield an error of 0 mm, a failed epidural would yield a negative error, and a dural puncture – a positive one. We took the absolute value of the error, so as not to allow failed epidurals and dural punctures to cancel out one another. We compared errors in absolute value and anesthesiologist levels.
To evaluate the simulator’s face and content validity, we asked participants to respond to questionnaires regarding the level of resemblance of each layer to the tissue in real-life. There were three additional questions regarding the compatibility of the simulator as a training and assessment tool, and the participants’ overall impression of the simulator. To collect the responses, we used the 100 mm visual analog scale (VAS). The VAS is a continuous scale, 100 mm long, which allows participants to mark an estimated response to a question upon it [43]. When using this scale for estimating realism (compared to the real-life environment), ’0’ represents ’completely unrealistic’ and ’100’ represents ’completely realistic’. When using it for testing the simulator’s suitability as a training or assessment tool, ’0’ represents ’completely unsuitable’ and ’100’ represents ’completely suitable’.
Four of the participants in this study did not fill out the questionnaires, as they had so little experience with the real-life environment, they did not feel confident to compare between the real-life environment and the virtual one (hence the smaller sample size compared to the number of participants in the study). We divided the remaining 18 participants in our analysis into two groups: anesthesiologists who had performed less than 500 epidurals prior to participating in this experiment (’Inexperienced’, N=11), and anesthesiologists who had performed 500 or more epidurals prior to this experiment (’Experienced’, N=7). We chose this method for dividing the participants since we aimed to examine the degree to which participants perceive the virtual environment as similar to the real-life one. Therefore, it was crucial to separate between the responses of individuals that have a rich experience with the real-life environment and those who do not. Note that among the participants in the inexperienced group, some had performed only a few epidurals (under 20). For each question and group, we calculated the mean scores and their 95% confidence intervals.

II-C3 Probing kinematics analysis
We quantified how the participants used the LOR syringe. To do so, we recorded kinematic data from both haptic devices separately. We used only the data recorded in the part that emulated the patient back – starting from the point where the penetration depth of the device connected to the Touhy needle () was zero. Then, to obtain the probing movements with the LOR syringe, we subtracted the location of the device connected to the Touhy needle from the location of the device connected to the LOR syringe (eq. 3). This allowed us to separate between the probing movements and the Touhy needle proceeding through the layers in the epidural region. Due to the LOR syringe length (10.5-15 cm, depending on how deep inside the syringe the plunger is), there is an inherent distance between the two haptic devices. To allow for calibrated ’zero’ points, we subtracted this length from the trajectory of the LOR syringe as well. To obtain the exact length per trial, we took the location of the haptic device connected to the LOR syringe where .
| (3) |
where is the adjusted trajectory, is the location of the haptic device connected to the LOR syringe (after the ’zero’ point calibration), and is the location of the haptic device connected to the Touhy needle; all units are provided in millimeters.
The main purpose of this adjustment was to separate the peaks that occurred due to LOR probing movements from those stemming from sudden movements with the Touhy needle. To find the number of probing movements, we used the ’findpeaks’ function in Matlab on the adjusted trajectory; to assess the penetration depth of each probing movement, we measured each peak’s height in millimeters. To attain the probing movement rate, we measured the time difference between each pair of consecutive peaks, and used its inverse. To assess the number of probing movements and the mean penetration depth in each trial, we used the number of probing movements enumerated in each trial, and for each probing movement, its depth. Then, we calculated the mean penetration depth across all probing movements in the trial. To obtain the probing movement rate per trial, we calculated the mean of the inverse time differences throughout the entire trial. Subsequently, to test them against anesthesiologist level or trial result, we calculated the mean number of probing movements, mean penetration depth, and mean rate across all relevant trials (according to the factor we wanted to test it against).
Additionally, we examined the location of each probing movement within the different layers of the epidural region. We normalized the number of probing movements in each layer by dividing it by the thickness of the layer in millimeters. We chose this normalization of the number of probing movements since the presence inside a tissue for a larger distance would provide more opportunities to probe. Thus, probing more in a thicker tissue would not necessarily imply that there was uncertainty in this tissue.
We also calculated the mean velocity of the haptic device connected to the Touhy needle in each layer in the epidural region for each participant.

II-C4 Statistical Analysis
In our statistical analysis, we compared several contrasts: result rates, error size, probing movement enumeration, probing movement penetration depth, and probing movement rate. None of the metrics were distributed normally, and hence, we chose non-parametric statistical methods. For each metric, we calculated the mean and the non-parametric bootstrap 95% confidence intervals. We used the Kruskal-Wallis test to determine whether there were statistically significant differences between the success rates (Fig. 6b), error sizes (Fig. 6d), number of probing movements, probing movement penetration depths, and probing movement rates (Fig. 8a-c) of the different anesthesiologist levels. In these models, the three categorical independent variables were the anesthesiologist levels (novices, intermediate, and experts), and the dependent variables were the success rates each participant achieved, the absolute value errors calculated for each participant, the mean number of probing movements per trial, the average probing movement depth, and the probing movement rate. When we found a significant effect of expertise level, we performed post-hoc pairwise comparisons with the Wilcoxon rank-sum test and used the Bonferroni correction for multiple comparisons.
The analysis of probing movement numbers, their penetration depth, and their rate against the trial result (Fig. 8d-f) would ideally be analyzed with a repeated-measures model. However, since the metrics were not normally distributed, and there were many missing data points (only 6 of the 22 participants had all three data points), we could not fit models that accounted for the repeated measures, and chose instead to analyze these results using the Kruskal-Wallis test.
To analyze the differences in error rates within participant levels, we used the Wilcoxon signed-rank test and compared failed epidural rates and dural puncture rates in each of the three anesthesiologist levels separately (Fig. 6c).
III Results
To help explain how we calculated the metrics introduced in this section, we first present a visual demonstration of the kinematic data we recorded to provide an intuition about needle insertion trajectories of successful and unsuccessful trials, along with different LOR probing strategies performed by participants with different levels of experience.
In Fig. 5, we display several examples of trajectories performed by the hand holding the Touhy needle alongside probing movements with the LOR syringe. Fig. 5a depicts the trajectories and probing movements of two participants, a novice and an expert, in a trial that was successful for both participants. The LOR probing trajectories demonstrate that the participants had different strategies; The expert participant (red) probed more often and more superficially than the novice (blue). This result is aligned with a trend we observed for most of the participants. An example of a trial that resulted in a failed epidural performed by a novice participant is shown in Fig. 5b. The needle insertion is halted within the green area, representing the Ligamentum Flavum, which indicates that the participant did not arrive at the epidural space. An example of a trial that resulted in a dural puncture performed by an intermediate-level participant is shown in Fig. 5c, where the Touhy needle crossed through the epidural space (gray area) and arrived at the Dura Mater (orange area).
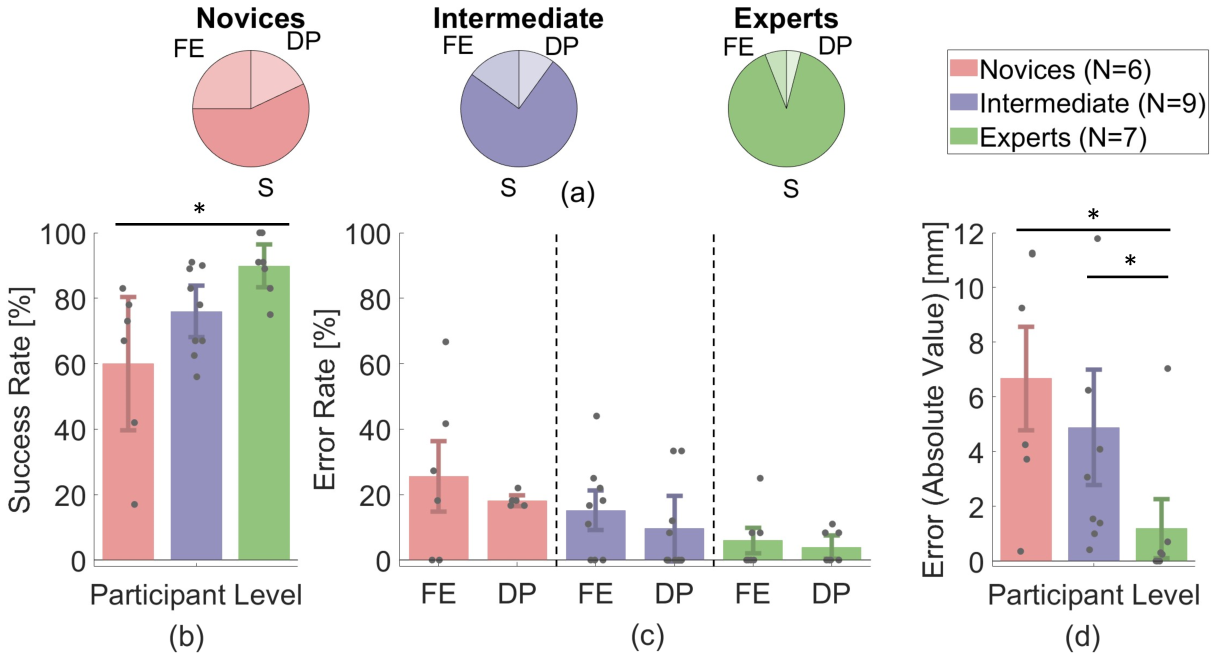
To assess the construct validity of our simulator, we examined the effect of anesthesiologist level on success rate in the virtual task. In Fig. 6a, the distribution of the different result types in all the trials of novice, intermediate, and expert participants are depicted, highlighting that novices make the most errors, followed by intermediate and, finally, the expert participants. Fig. 6b depicts that the success rate indeed depends on the participant’s level of expertise, supported by a statistically significant effect of expertise (Kruskal-Wallis yielded , , ). Post-hoc analysis revealed a significant difference between novices (level 1) and experts (level 3), (, , ).
We also studied the rates of the two error types (failed epidural and dural puncture) separately for the three anesthesiologist levels (Fig. 6c). We observed the same trends in all participant levels; the failed epidural rate appears to be higher than the dural puncture rate. However, these results were not statistically significant (Wilcoxon signed-rank tests yielded , , ), which prevents us from drawing concrete conclusions.
To further analyze errors, we assessed the effect of the anesthesiologist level on error size (measured as the absolute distance value of the chosen injection site from the correct epidural space location). The results depicted in Fig. 6d demonstrate an inverse relationship between participant level and error; Novices’ errors appeared to be larger in size than those of intermediate-level anesthesiologists and experts. This result was supported by statistical significance (Kruskal-Wallis yielded , , ). Post-hoc analysis revealed a significant difference between novices (level 1) and experts (level 3), and between intermediate-level anesthesiologists (level 2) and experts (level 3) (, , ).
To assess face and content validity, participants’ responses to VAS questionnaires were evaluated (Fig. 7) and presented separately for two groups (’Inexperienced’ and ’Experienced’). The responses’ means were calculated for each question (for each tissue layer and for three questions evaluating the simulator) and for each group of participants. In most layers of the epidural region (all layers but the Ligamentum Flavum, Fig. 7a), the responses of the experienced group were higher than or equal to those of the inexperienced group. This was also the case for the evaluation of the overall simulator impression and its suitability as a training tool (Fig. 7b). The overall impression mean score of the experienced group, as well as this group’s mean score for the loss of resistance and suitability as a training tool, were relatively high (82.22 14 mm, 81.24 22.2 mm, and 80.82 12.4 mm, respectively).


To study probing strategies, we assessed the effect of anesthesiologist level on the number of probing movements and their penetration depths and rate (Fig. 8a-c). It appeared that experts and intermediate-level anesthesiologists used a larger number of probing movements compared to novices, and these movements were more superficial and fast, although all three results were not significant (Kruskal-Wallis tests () yielded , , , , ).
Additionally, we assessed the effect of each trial’s result on the number of probing movements in the trial. Fig. 8d demonstrates that utilizing a small number of probing movements led to a higher chance of causing a dural puncture (Kruskal-Wallis yielded , , ). Post-hoc analysis revealed a significant difference between the number of probing movements in trials that resulted in dural punctures and trials that resulted in both failed epidurals and successful trials (, ). No difference was found between the mean number of probing movements in trials that led to failed epidurals and successful trials (). Examining the probing movements’ depths and rate (Fig. 8e-f) indicated that the movements used in successful trials and trials that resulted in failed epidurals were often more superficial and fast than the probing movements in trials that resulted in dural punctures, although this result was not significant (Kruskal-Wallis () yielded , , , ).
We also conducted an exploratory analysis of the normalized number of probing movements performed (Fig. 9a) and the mean velocity (Fig. 9b) in each of the layers in the epidural region. Accordingly, we present the analysis results without any statistical analysis. We did not have predictions about the probing strategies for the different layers, and the current study is under powered due to the large number of layers combined with the small number of data points at each anesthesiologist level. Nevertheless, we present these results to be used as a pilot for future studies.
Studying the layer in the epidural region in which probing movements were performed (Fig. 9a) indicated that all participants probed the greatest number of probing movements in the three layers preceding the epidural space: the Supraspinous Ligament, Interspinous Ligament, and Ligamentum Flavum. There is a relationship between participant level and probing movements’ number in most layers (4 out of 6 layers); it appeared that experts and intermediate-level anesthesiologists probed more than novices in these layers.
We also examined the mean velocity of the Touhy needle in the different layers of the epidural region; the results depicted in Fig. 9b demonstrate that participants decreased their velocity in the Interspinous Ligament (and continued with a decreased velocity afterward).

IV Discussion
In this study, we designed and assessed a novel bimanual simulator for epidural analgesia, using two haptic devices and custom-made adapters to the instruments used in the real-life procedure (a Touhy needle and an LOR syringe). The simulator is novel in the sense that it is bimanual, allowing for the emulation of the forces applied not only to the Touhy needle, as was done thus far, but to the LOR syringe as well. We used a force model based on the one proposed in [13], and scaled it following an iterative process of adjustment to the experience of an expert anesthesiologist, which allowed us to render resistive forces, considering the haptic devices’ limitations and striving for maximum realism. We modeled multiple patient body weights that allowed for motor variability which has the potential to enhance motor learning [41]. We conducted a study with 22 anesthesiologists of different experience levels. Our relatively small sample size primarily results from the specialized nature of the participant population (anesthesiologists), which limited the feasibility of obtaining a more extensive sample. We found that the simulator was able to distinguish between real-life novices and experts, demonstrating good construct validity. Face and content validity, as assessed by the VAS questionnaire responses, varied between the different questions. In some, the more experienced users’ satisfaction level was low, and we suggest some interpretations for this result in this section. In others, the mean scores provided by experienced users were relatively high, suggesting good face and content validity, though validating the simulator accordingly remained difficult, due to several limitations presented in this section. Analysis of the kinematic data demonstrated differences in strategies between anesthesiologists of different experience levels, and implied a relationship between strategies and outcomes in the virtual task.
The relation between anesthesiologist level and their success rate in the virtual environment validates the simulator’s construct validity according to [26], as it demonstrates that the simulator is able to distinguish between real-life novices and experts. The statistically significant difference between novices and experts supports this claim. Testing construct validity in this manner has been adopted in the past by several groups [26, 33, 34, 44], including [33], who compared the performance of novice and expert golfers in a golf VR simulation, and [34], who compared experts and novice surgeons in minimally invasive surgical simulations. Bright et al. [44] observed significant differences between experts and novices in a surgical simulator. Additional to differences in performance level, they also revealed differences in control strategies, which provided a novel method of assessing construct validity in medical simulators. In this section, we also address differences in strategies observed between novices and experts and suggest methods of utilizing these characteristics to enhance training with our simulator.
In the evaluation of the VAS questionnaire responses, we chose to put more emphasis on the experienced group, as these are more experienced users we can rely on to compare the virtual and real-life environments. Further, evaluating face and content validity using expert opinions is commonly used in the medical simulator field and beyond [26, 29, 31]. In most layers and in the overall impression (Fig. 7a), the experienced group’s mean scores were relatively high, and the ’Loss of Resistance’, which is the most important haptic aspect required to succeed in the task (as it informs the anesthesiologist of reaching the epidural space), received the highest score in the layer category.
These results suggest good face validity; however, due to several reasons, we are still limited in our ability to validate the simulator. First, it is difficult to interpret the subjective ratings without comparison to other systems (e.g., a uni-manual epidural simulator). If the literature would propose an official threshold for what is a ’good’ VAS score to determine face validity, we could compare to such threshold. However, such gold standard does not exist, and the absolute scores are difficult to interpret and be used to determine the validity of the simulator. Further investigation and comparison to other simulators will be necessary to validate the simulator in the future.
Additionally, there are several limitations in the simulator design, that we would expect to be better reflected in participant reports: these limitations include insights that we received from several expert anesthesiologists (including the author YB), that the Ligamentum Flavum has a unique texture, which is not well-emulated in this simulator. Other limitations include the lack of the deflection model proposed in [13], and the absence of visual information, which highly affects face validity [26]. We aim to address all these issues in future versions of the simulator. The fact that these limitations did not affect the VAS scores as much as we would expect testifies to the weakness of these subjective evaluations.
In this version of the simulator, we chose not to incorporate visual information because we posit that the haptic aspect of the task is the most important. This is because the needle insertion task is a blind procedure (the needle is inserted into the patient’s skin, and the anesthesiologist does not receive any visual information as to its location). We believe that this choice has contributed to the construct validity of our simulator, but adding visual information might improve user satisfaction and affect face validity. Hence, in future versions of the simulator, we will consider adding visual information that aims to emulate the real-life environment by simulating a delivery suite in which a patient is sitting on a hospital bed. Such visual information should not include any feedback regarding the needle location within the epidural region since this visual information is not provided to the anesthesiologist in the real-life procedure.
The simulator was perceived by experienced users as a better tool for training than assessment (Fig. 7b). We designed this simulator for training, and hence, this result implies good content validity. However, it is possible that in their answers, the participants did not consider all relevant factors. For example, if they would consider cost and training time, they might lower the scores of the suitability of the simulator as a training tool. Such perspective was demonstrated in [45] and [46], where inserting the needle into a banana was preferred over other simulators that were rated more realistic because of its cost efficiency. In addition, our analysis of the performance and strategies revealed differences between different experience levels of anesthesiologists. This means that in contrast to the answers of participants, the simulator can be used as an objective assessment tool. Both aspects highlight the challenges of validating the simulator based on subjective participant reports.
Error rates allow us to study strategies in terms of caution versus recklessness. It appears that all participants erred on the side of safety. This result can imply a level of insecurity; some participants (especially novices) are more likely to fear an over-shoot, thus resulting in mistakenly halting the needle insertion too superficially. For others, this result demonstrates the comprehension of how potentially harmful accidental dural punctures are, explaining why they made such efforts to avoid them, occasionally risking a result of failed epidural. Another possible interpretation for this result is the fact that participants knew their actions were being examined, and hence deployed a higher level of caution.
Measurement of error sizes allows us to examine how far the chosen injection site was from the correct epidural space. The result shown in Fig. 6d reinforces the result shown in Fig. 6a-c, as it demonstrates that not only were novices’ errors more prevalent than those of intermediate-level anesthesiologists and experts, they were also more prominent.
Probing movement enumeration, depth, and rate evaluation showed that using less probing movements can lead to a higher risk for dural punctures, and that experts probed more than novices. The use of less probing movements was often accompanied by a larger depth and slower rate; however, this was not supported by our statistical analysis. We argue that experts and intermediate-level anesthesiologists (that were shown to be more successful and perform fewer dural punctures according to Fig. 6) probe more than novices since they know that utilizing the probing tool can assist in perceiving the environment stiffness and help prevent dural punctures (as shown in Fig. 8d). Hence, they choose to use it more often. However, additional studies are needed to ascertain these preliminary observations.
Probing movement location analysis was evaluated in an exploratory manner without statistical analysis. Accordingly, we discuss the results cautiously. Fig. 9a indicated that all participants probed the most in the three layers preceding the epidural space. This does not align entirely with our original hypothesis, which would suggest that participants probe the most in the Ligamentum Flavum preceding the epidural space. Instead, it appears that participants began their extensive probing (indicating higher awareness of proximity to the epidural space) earlier. In most layers, experts probed more than novices, which coincides with the result implying that experts utilize the probing tool more than novices. The only exceptions were the Skin and Subcutaneous Fat layers, where experts used the tool less than novices. This supports the previous result, as it demonstrates that the only layers in which experts probed less were those where they were certain they hadn’t reached the epidural space yet (due to the fact that the needle insertion had just begun) and hence did not need to make efforts to perceive the environment stiffness.
Velocity analysis was also evaluated in an exploratory manner, and Fig. 9b depicted that all participants had decreased their velocity in the Interspinous Ligament. This result partially coincides with the large number of probing movements presented in the three layers preceding the epidural space in Fig. 9a. It appears that although participants had started to probe the environment stiffness in the Supraspinous Ligament (showing a higher level of awareness and preparation towards encountering the epidural space), they still began decreasing their velocity only in the Interspinous Ligament, which is the second of the three mentioned layers.
The differences in strategies between different level anesthesiologists shown in this section lead us to suggest trainee-specific feedback and instructions in advanced training stages (e.g., for intermediate-level anesthesiologist training). We argue that our simulator is necessary to allow novices to train in a virtual environment before performing their first real-life epidural analgesia procedure, but also that anesthesiologists should continue training with it throughout their residency to maintain skill acquisition level [22]. In advanced training stages, we suggest that trainees be presented with a summary of the strategies they had performed (e.g., how many probing movements they performed, the location in the epidural region in which these probing movements took place, how they adjusted their velocity, etc., with respect to the trial result), and that trainees be instructed with methods to improve, based on expert strategies harvested in this study. This teaching method, which incorporates repeated practice and refined instruction, has been shown as a key step in technical skill acquisition for surgical residents [47, 48]. Furthermore, the trainee-specific approach proposed here is one of the principles that can enhance adult learning [47].
V Conclusions
In this work, we presented the design and assessment of a bimanual simulator for optimizing skill acquisition in epidural analgesia. The simulator we designed comprises two haptic devices connected to the real-life task instruments and emulates the structure and resistance of the epidural region, while allowing for patient weight variability and data acquisition for both online and offline data analysis. We used the simulator to examine the performance of 22 anesthesiologists of different competency levels and demonstrated that it can distinguish between real-life novices and experts, suggesting good construct validity. Experienced users’ VAS questionnaire responses were examined to assess face and content validity, and we discussed the limitations in interpretation of the results and challenges in validation of the simulator. Our strategy analysis suggests that experts utilize probing with the LOR syringe (which is a tool for perceiving the environment’s resistance) more than novices and that insufficient utilization of said tool yields a higher dural puncture rate. We argue that the simulator could be used as a tool for training novice anesthesiologists before encountering their first real-life case, and consequently increase patient safety, and that practice with it should be maintained and refined to be trainee-specific over time. Integrating the simulator into the training curricula can improve the training paradigm, compared to the ’see one, do one, teach one’ approach implemented today.
References
- [1] D. Shatalin, C. Weiniger, I. Buchman, Y. Ginosar, S. Orbach-Zinger, and A. Ioscovich, “A 10-year update: national survey questionnaire of obstetric anesthesia units in israel,” International Journal of Obstetric Anesthesia, vol. 38, 11 2018.
- [2] A. J. Butwick, C. A. Wong, and N. Guo, “Maternal Body Mass Index and Use of Labor Neuraxial Analgesia,” Anesthesiology, vol. 129, no. 3, pp. 448–458, Sep. 2018.
- [3] R. M. Buenaventura, S. Datta, S. Abdi, and H. S. Smith, “Systematic review of therapeutic lumbar transforaminal epidural steroid injections,” Pain Physician, vol. 12, no. 1, pp. 233–51, 2009.
- [4] C. W. Berger, E. T. Crosby, and W. Grodecki, “North American survey of the management of dural puncture occurring during labour epidural analgesia,” Can J Anaesth, vol. 45, no. 2, pp. 110–114, Feb. 1998.
- [5] M. Lewis, J. Lafferty, M. Sacks, V. Pallares, and M. TerRiet, “How much work is required to puncture dura with tuohy needles?” British Journal of Anaesthesia, vol. 85, no. 2, pp. 238–241, 2000.
- [6] K.-H. Kwak, “Postdural puncture headache,” Korean J Anesthesiol, vol. 70, no. 2, pp. 136–143, Apr. 2017.
- [7] Y. Binyamin, P. Heesen, S. Orbach-Zinger, Y. Gozal, D. Halimi, A. Frenkel, and A. Ioscovich, “Chronic pain in parturients with an accidental dural puncture: A case-controlled prospective observational study,” Acta Anaesthesiologica Scandinavica, vol. 65, no. 7, pp. 959–966, 2021.
- [8] J. H. Kim, S. Y. Song, and B. J. Kim, “Predicting the difficulty in performing a neuraxial blockade,” Korean Journal of Anesthesiology, vol. 61, no. 5, pp. 377–381, 2011.
- [9] C. Konrad, G. Schüpfer, M. Wietlisbach, and H. Gerber, “Learning manual skills in anesthesiology: Is there a recommended number of cases for anesthetic procedures?” Anesth Analg, vol. 86, no. 3, pp. 635–639, Mar. 1998.
- [10] K. E. Torske and D. H. Dyson, “Epidural analgesia and anesthesia,” Veterinary Clinics of North America: Small Animal Practice, vol. 30, no. 4, pp. 859–874, 2000.
- [11] Frölich, M. A., Caton, and Donald, “Pioneers in epidural needle design,” Anesthesia & Analgesia, vol. 93, no. 1, pp. 215–220, 2001.
- [12] G. Capogna, Epidural Technique In Obstetric Anesthesia. Springer International Publishing, 2020, pp. 55–76.
- [13] A. L. Brazil, A. Conci, E. Clua, L. K. Bittencourt, L. B. Baruque, and N. d. Silva Conci, “Haptic forces and gamification on epidural anesthesia skill gain,” Entertainment Computing, vol. 25, pp. 1–13, Mar. 2018.
- [14] N. Vaughan, V. N. Dubey, M. Y. K. Wee, and R. Isaacs, “A review of epidural simulators: Where are we today?” Medical Engineering & Physics, vol. 35, no. 9, pp. 1235–1250, Sep. 2013.
- [15] v. K. J. Lee RA, van Zundert TCRV, “Evaluation of the Mediseus® Epidural Simulator - ProQuest,” Anaesthesia and Intensive Care, no. 2, pp. 311–318, Mar 2012.
- [16] A. M. P. Dogliotti, “Research and Clinical Observations on Spinal Anesthesia: With Special Reference to the Peridural Technique.” Anesthesia & Analgesia, vol. 12, no. 2, pp. 59–65, Apr. 1933.
- [17] C. Wang, P. Calle, J. C. Reynolds, S. Ton, F. Yan, A. M. Donaldson, A. D. Ladymon, P. R. Roberts, A. J. de Armendi, K.-m. Fung, S. S. Shettar, C. Pan, and Q. Tang, “Epidural anesthesia needle guidance by forward-view endoscopic optical coherence tomography and deep learning,” Scientific Reports, vol. 12, no. 1, 2022.
- [18] H. Li, X. Nie, D. Duan, Y. Li, J. Zhang, M. Zhou, and E. Magid, “An admittance-controlled amplified force tracking scheme for collaborative lumbar puncture surgical robot system,” The International Journal of Medical Robotics and Computer Assisted Surgery, vol. 18, no. 5, p. e2428, 2022.
- [19] S. Rajagopalan, K. Shah, D. Guffey, C. Tran, M. Suresh, and A. Wali, “Predictors of difficult epidural placement in pregnant women: A trainees’ perspective,” Journal of Anaesthesiology Clinical Pharmacology, vol. 35, no. 4, pp. 548–552, 2019.
- [20] K. W. Houben, C. L. M. van den Hombergh, R. E. Stalmeijer, A. J. Scherpbier, and M. A. E. Marcus, “New training strategies for anaesthesia residents,” Current opinion in anaesthesiology, vol. 24, no. 6, pp. 682–686, 2011.
- [21] J. M. Rodriguez-Paz, M. Kennedy, E. Salas, A. W. Wu, J. B. Sexton, E. A. Hunt, and P. J. Pronovost, “Beyond “see one, do one, teach one”: toward a different training paradigm,” Postgraduate medical journal, vol. 18, no. 1, pp. 63–249, 2009.
- [22] C. Smith, G. C. Huang, L. R. Newman, P. F. Clardy, D. Feller-Kopman, M. Cho, T. Ennacheril, and R. M. Schwartzstein, “Simulation training and its effect on long-term resident performance in central venous catheterization,” Simulation in Healthcare: The Journal of the Society for Simulation in Healthcare, vol. 5, no. 3, pp. 146–151, 2010.
- [23] C. S. Park, L. R. Rochlen, E. Yaghmour, N. Higgins, J. R. Bauchat, K. G. Wojciechowski, J. T. Sulliva, and R. J. Mccarthy, “Acquisition of critical intraoperative event management skills in novice anesthesiology residents by using high-fidelity simulation-based training,” Anesthesiology (Philadelphia), vol. 112, no. 1, pp. 202–211, 2010.
- [24] T. R. Coles and N. W. John, “The effectiveness of commercial haptic devices for use in virtual needle insertion training simulations,” in 2010 Third International Conference on Advances in Computer-Human Interactions. IEEE, 2010, pp. 148–153.
- [25] Y. Li, J. Zhang, D. Gui, and H. Li, “Enhanced epidural tissue perception for pediatric patients by an interactive lumbar puncture simulator,” in 2021 IEEE International Conference on Robotics and Biomimetics (ROBIO). IEEE, 2021, pp. 1767–1772.
- [26] D. J. Harris, J. M. Bird, P. A. Smart, M. R. Wilson, and S. J. Vine, “A Framework for the Testing and Validation of Simulated Environments in Experimentation and Training,” Front Psychol, vol. 11, p. 605, Mar. 2020.
- [27] V. Manoharan, D. Van Gerwen, J. J. Van Den Dobbelsteen, and J. Dankelman, “Design and validation of an epidural needle insertion simulator with haptic feedback for training resident anaesthesiologists,” in 2012 IEEE Haptics Symposium. IEEE, 2012, pp. 341–348.
- [28] A. Gavazzi, A. N. Bahsoun, W. Van Haute, K. Ahmed, O. Elhage, P. Jaye, M. S. Khan, and P. Dasgupta, “Face, content and construct validity of a virtual reality simulator for robotic surgery (sep robot),” The Annals of The Royal College of Surgeons of England, vol. 93, no. 2, pp. 152–156, 2011.
- [29] G. Sankaranarayanan, B. Li, K. Manser, S. B. Jones, D. B. Jones, S. Schwaitzberg, C. G. Cao, and S. De, “Face and construct validation of a next generation virtual reality (gen2-vr©) surgical simulator,” Surgical endoscopy, vol. 30, no. 3, pp. 979–985, 2016.
- [30] N. A. Stanton and S. V. Stevenage, “Learning to predict human error: issues of acceptability, reliability and validity,” Ergonomics, vol. 41, no. 11, pp. 1737–1756, 1998.
- [31] F. Yaghmaie, “Content validity and its estimation,” Journal of medical education, vol. 3, no. 1, 2003.
- [32] A. J. Hung, P. Zehnder, M. B. Patil, J. Cai, C. K. Ng, M. Aron, I. S. Gill, and M. M. Desai, “Face, content and construct validity of a novel robotic surgery simulator,” The Journal of urology, vol. 186, no. 3, pp. 1019–1025, 2011.
- [33] D. J. Harris, G. Buckingham, M. R. Wilson, J. Brookes, F. Mushtaq, M. Mon-Williams, and S. J. Vine, “Exploring sensorimotor performance and user experience within a virtual reality golf putting simulator,” Virtual Reality, vol. 25, no. 3, pp. 647–654, Sep. 2021.
- [34] E. Bright, S. Vine, M. R. Wilson, R. S. W. Masters, and J. S. McGrath, “Face validity, construct validity and training benefits of a virtual reality turp simulator,” International Journal of Surgery, vol. 10, no. 3, pp. 163–166, Jan. 2012.
- [35] M. A. Broom, G. Milne, and E. M. McGrady, “Evaluation of the Genesis Epidural-Spinal Injection Simulator,” International Journal of Obstetric Anesthesia, vol. 33, pp. 90–92, Feb. 2018.
- [36] G. Capogna, A. Coccoluto, E. Capogna, and A. Del Vecchio, “Objective evaluation of a new epidural simulator by the compuflo® epidural instrument,” Anesthesiology Research and Practice, vol. 2018, 2018.
- [37] A. Lelevé, R. Moreau, L. Krahenbuhl, F. Sigwalt, C. Bauert, Q. Rouby et al., “Designing an accurate and customizable epidural anesthesia haptic simulator,” in 2019 International Conference on Robotics and Automation (ICRA). IEEE, 2019, pp. 8353–8359.
- [38] N. Vaughan, V. N. Dubey, M. Y. Wee, and R. Isaacs, “Haptic interface on measured data for epidural simulation,” in International Design Engineering Technical Conferences and Computers and Information in Engineering Conference, vol. 45011. American Society of Mechanical Engineers, 2012, pp. 13–17.
- [39] N. Davidor, Y. Binyamin, T. Hayuni, and I. Nisky, “Using lor syringe probes as a method to reduce errors in epidural analgesia – a robotic simulation study,” 2023.
- [40] D. J. Herzfeld and R. Shadmehr, “Motor variability is not noise, but grist for the learning mill,” Nature Neuroscience, vol. 17, no. 2, pp. 149–150, Feb. 2014, number: 2 Publisher: Nature Publishing Group.
- [41] A. K. Dhawale, M. A. Smith, and B. P. Ölveczky, “The Role of Variability in Motor Learning,” Annu Rev Neurosci, vol. 40, pp. 479–498, Jul. 2017.
- [42] B. Esterer, S. Gabauer, R. Pichler, D. Wirthl, M. Drack, M. Hollensteiner, G. Kettlgruber, M. Kaltenbrunner, S. Bauer, D. Fürst et al., “A hybrid, low-cost tissue-like epidural needle insertion simulator,” in 2017 39th Annual International Conference of the IEEE Engineering in Medicine and Biology Society (EMBC). IEEE, 2017, pp. 42–45.
- [43] N. Crichton, “Visual analogue scale (vas),” J Clin Nurs, vol. 10, no. 5, pp. 706–6, 2001.
- [44] E. Bright, S. J. Vine, T. Dutton, M. R. Wilson, and J. S. McGrath, “Visual control strategies of surgeons: a novel method of establishing the construct validity of a transurethral resection of the prostate surgical simulator,” Journal of Surgical Education, vol. 71, no. 3, pp. 434–439, 2014.
- [45] T. H. Pedersen, J. Meuli, E. J. Plazikowski, M. Buttenberg, M. Kleine-Brüggeney, C. A. Seidl, L. Theiler, and R. Greif, “Loss of resistance: A randomised controlled trial assessing four low-fidelity epidural puncture simulators.” European journal of anaesthesiology, vol. 34, no. 9, pp. 602–608, 2017.
- [46] D. Raj, R. M. Williamson, D. Young, and D. Russell, “A simple epidural simulator: a blinded study assessing the ’feel’ of loss of resistance in four fruits,” Eur J Anaesthesiol, vol. 30, no. 7, pp. 405–408, Jul. 2013.
- [47] R. K. Reznick, “Teaching and testing technical skills,” The American journal of surgery, vol. 165, no. 3, pp. 358–361, 1993.
- [48] J. A. Kopta, “An approach to the evaluation of operative skills.” Surgery, vol. 70, no. 2, pp. 297–303, 1971.