SOLIS XVII: Jet candidate unveiled in OMC-2 and
its possible link to the enhanced cosmic-ray ionisation rateThanks: Based on observations carried out with the IRAM NOEMA interferometer. IRAM is supported by INSU/CNRS (France), MPG (Germany), and IGN (Spain).
Abstract
Context. The study of the early phases of star and planet formation is important to understand the physical and chemical history of stellar systems such as our own. In particular, protostars born in rich clusters are prototypes of the young Solar System.
Aims. In the framework of the Seeds Of Life In Space (SOLIS) large observational project, the aim of the present work is to investigate the origin of the previously inferred high flux of energetic particles in the protocluster FIR4 of the Orion Molecular Cloud 2 (OMC-2), which appears asymmetric within the protocluster itself.
Methods. Interferometric observations carried out with the IRAM NOEMA interferometer were used to map the silicon monoxide (SiO) emission around the FIR4 protocluster. Complementary archival data from the ALMA interferometer were also employed to help constrain excitation conditions. A physical-chemical model was implemented to characterise the particle acceleration along the protostellar jet candidate, along with a non-LTE analysis of the SiO emission along the jet.
Results. The emission morphology of the SiO rotational transitions hints for the first time at the presence of a collimated jet originating very close to the brightest protostar in the cluster, HOPS-108.
Conclusions. The NOEMA observations unveiled a possible jet in the OMC-2 FIR4 protocluster propagating towards a previously measured enhanced cosmic-ray ionisation rate. This suggests that energetic particle acceleration by the jet shock close to the protostar might be at the origin of the enhanced cosmic-ray ionisation rate, as confirmed by modelling the protostellar jet.
Key Words.
ISM: molecules — ISM: jets and outflows — line: identification — molecular data — molecular processes — radio lines: ISM1 Introduction
The early phases of star formation are known to be highly dynamic, with accretion of material from the surrounding envelope to the protostar and, at the same time, energetic outflows that contribute to the dispersal of the mother cloud. This phase is also associated with a very rich chemical and physical complexity, which has been reported extensively in observational works (Cazaux et al. 2003; Jørgensen et al. 2005, e.g.). Many studies conducted in the past few decades propose that stars generally do not form in isolation. Adams 2010 showed that our Solar System is likely to have formed in a moderately large cluster environment. Moreover, analysis of the short-lived radionuclides within meteoritic material indicates that during its early evolutionary phases, our Sun experienced a high flux of energetic (10 MeV) particles (Gounelle et al. 2013).
The region of the Orion Molecular Cloud north of the Orion Nebula, and known as OMC-2 FIR4, is the closest prototype of an intermediate-to-high-mass protocluster. The short distance to the Solar System (Kounkel et al. 2017, 3885 pc,) allows for a detailed view of its structure through high spatial resolution observations. Several studies focused on the structure and chemistry of this source identified at least six compact continuum sources in the millimetre and submillimetre. Observations carried out with the Herschel space telescope recorded the first indirect evidence of an enhancement of energetic particles in the protocluster FIR4 (Ceccarelli et al. 2014). More recently, Fontani et al. 2017 mapped the different distribution of HC5N and HC3N towards FIR4. The spatial differentiation between the two cyanopolyynes indicates a higher cosmic-ray (CR) ionisation rate (3 orders of magnitude larger than the average interstellar value, s-1) in the eastern part of the region, where HC5N peaks. These findings were confirmed by Favre et al. 2018, who mapped the excitation temperature across the FIR4 region using observations of c-C3H2. With the aid of chemical modelling including photodissociation, the observational data can be reproduced only assuming a high CR ionisation rate ( 410-14 s-1), very similar to the one constrained by the Ceccarelli et al. 2014 analysis. OMC-2 FIR4 is thus considered one of the best analogues of our Solar System progenitor (Favre et al. 2018; Fontani et al. 2017). Nevertheless, although it is now clear from the previous analyses that FIR4 is permeated by a flux of highly energetic CR-like ionising particles, less is known about their origin, which has to be internal (Ceccarelli et al. 2014).
The findings of an enhanced ionisation rate has also generated great interest from a theoretical point of view, as models have been showing that thermally charged particles can be accelerated in shock fronts along jets driven by young stellar objects, according to the first-order Fermi acceleration mechanism (Padovani et al. 2015; Padovani et al. 2016; Gaches & Offner 2018; Padovani et al. 2021). These energetic particles can thus explain the high CR ionisation rate estimated by observations. However, the origin of the increased ionisation rate towards the east side of the region has not yet being identified.
Due to the interest of the source and its vicinity, many other studies investigated the complexity of the OMC-2 region. González-García et al. 2016 showed, using Herschel/PACS observations, a [O I] jet originating from FIR3 and connecting FIR3 to FIR4. Multi-wavelength and multi-epoch VLA observations from Osorio et al. 2017 resolved a collimated synchrotron emission following a similar morphology to the jet observed by González-García et al. 2016. The interaction of this non-thermal jet emitting from HOPS-370 (i.e. FIR3) and the surrounding material in FIR4 is proposed by the authors as the formation mechanism of HOPS-108, as previously suggested by Shimajiri et al. 2008.
Being a prototype of the young Solar nebula, OMC-2 FIR4 is one of the targets in the Seeds Of Life In Space (Ceccarelli et al. 2017, SOLIS;) large programme. Through interferometric observations carried out with the IRAM NOrthern Extended Millimeter Array (NOEMA) at different frequencies and antenna configurations, the goal of the SOLIS project is to understand how molecular complexity grows in Solar-type star forming regions. The aim of the present work is to show initial evidence of a jet source within the protocluster and associated with the brightest protostar in FIR4, HOPS-108, a hot corino with a luminosity of (Furlan et al. 2014; Tobin et al. 2019; Chahine et al. 2022a). The emission of the = 2-1 rotational transition of silicon monoxide, SiO, a well-known shock tracer within star forming regions, is used as a kinematic tracer. The same transition was observed by Shimajiri et al. 2008 with the Nobeyama Millimeter Array, although only the emission from the brightest compact region in the eastern part of FIR4 was mapped due to the sensitivity of the observations. To complement our analysis, we used SiO = 5-4 archival data from the ALMA telescope (project 2017.1.01353.S, PI: S. Takahashi), which include observations with both the main (12-m antennas) and the compact (7-m antennas) array. A full detailed analysis of the ALMA observations was described recently in Sato et al. 2022.
The observational setup is presented in the following section. In Sect. 3, a description of the analysis and the obtained results is provided. The model for the particle acceleration is also presented therein before the discussion (Sect. 4). The main outcomes of the work are described in the last section.
2 Observations
2.1 NOEMA
The interferometric observations were carried out in several runs in 2016 and 2017. The IRAM NOEMA array was used in C configuration as part of the SOLIS large programme (Ceccarelli et al. 2017). All data reported here were obtained with the WideX band correlator, which provides 1843 channels over 3.6 GHz of bandwidth with a channel width of 1.95 MHz ( 6.5 km s-1 at 86 GHz). The phase centre of the observations was RA(J2000) = , DEC(J2000) = , and the local standard of rest velocity was set to 11.4 km s-1, and the systemic velocity was OMC-2 FIR4 (Shimajiri et al. 2015; Favre et al. 2018). The primary beam is 54′′ at 86 GHz, and the system temperature during the observations ranged from 60–100 K ( 200 K in summer) with an amount of precipitable water of 5 mm (10–15 mm in summer). The maximum recoverable scale is 20 arcsec. The absolute flux scale was calibrated by observing the quasars LKHA101 and MWC349, while 3C454.3 and 3C84 were used as a calibrator for the bandpass shape. For gain (phase and amplitude) calibration, 0414-189, 2200+420, 0524+034, and 0539-057 were used.
Calibration and imaging were performed using the CLIC and MAPPING software of the GILDAS package11
1
http://www.iram.fr/IRAMFR/GILDAS/, respectively. The continuum was imaged by averaging the line-free channels of the WideX backend. The continuum image was self-calibrated and the solutions were applied to the spectral lines. A natural weight was used in the visibilities, and all the cleaning of the detected spectral features was performed using the Högbom method (Högbom 1974). All the maps presented in this work are primary beam corrected, and the final synthesised beam is 3114 (P.A.= 161) at 86 GHz (see Tables 1 and 2).
2.2 ALMA
Additional SiO emission data from OMC-2 FIR4 were obtained from Atacama Large Millimeter/‘submillimeter Array (ALMA) observations in the frame of the 2017.1.01353.S project (PI: S. Takahashi), with an observing run in April 2018 for a total time on source of 30 minutes. A total of 44 antennas were used for the observations in Band 6 (1.3 mm); flux and bandpass calibration were obtained through observations of J0522-3627, while the quasar J0541-0541 was used for phase and amplitude gain calibration. The shortest and longest projected baselines are 15 m and 500 m, respectively, with a maximum recoverable scale of 11 arcsec. The data were processed and primary beam corrected using standard ALMA calibration scripts of the Common Astronomy Software Applications (CASA22 2 CASA is developed by an international consortium of scientists based at the National Radio Astronomical Observatory (NRAO), the European Southern Observatory (ESO), the National Astronomical Observatory of Japan (NAOJ), the Academia Sinica Institute of Astronomy and Astrophysics (ASIAA), the CSIRO division for Astronomy and Space Science (CASS), and the Netherlands Institute for Radio Astronomy (ASTRON) under the guidance of NRAO., version 5.4.0) package. The final synthesised beam of the SiO = 5-4 map is 1207 (P.A.= -68) at 217 GHz (see Table 1).
| Setup | Freq. range | Chan. width | Synth. Beam | P.A. |
|---|---|---|---|---|
| [GHz] | [MHz] | [′′] | [] | |
| NOEMA | 83.680 – 87.280 | 1.95 | 3.1 1.4 | |
| ALMA | 216.598 – 217.598 | 0.24 | 1.2 0.7 |
| Transition | Frequency | Eup/kb | Aul | |
|---|---|---|---|---|
| [MHz] | [K] | [s-1] | ||
| = 2–1 | 86846. | 985 | 6.3 | 2.93 10-5 |
| = 5–4 | 217104. | 919 | 31.3 | 5.20 10-4 |
3 Results
3.1 Morphology of the SiO emission
Figure 1 shows the integrated intensity of the SiO = 2–1 emission. A 5 intensity cut, with 1 at 6.710-4 Jy/beam measured before primary beam correction, was adopted to select the channels with significant emission for the integration ( km s-1).

The morphology of the SiO 2-1 emission can be described as two main blocks with quite different morphologies. The west component is compact and extends in a north-south direction, with the brightest region in the northern part, a few thousand AU west of the HOPS-64 protostar, which was previously detected in near- and mid-infrared bands by Herschel (Adams et al. 2012; Furlan et al. 2014). A second peak of the emission can be seen at a similar distance north-west of the radio source VLA15 (Osorio et al. 2017). In contrast, the emission on the eastern side of FIR4 is clumpy and filamentary, tending towards a north-west south-east direction. The brightest clump is located very close ( 1000 AU) to the HOPS-108 protostar.
The connection of this filamentary emission and the nearby protostar HOPS-108 is the focus of the present work and is described in more detail in the following. The brightest emission on the western part of the source, which was also observed in SiO emission by Shimajiri et al. 2008, is not the subject of our present analysis. As recently shown by Chahine et al. 2022b, this part of FIR4 requires angular and spectral resolution analyses to disentangle the several jets propagating from the members of the protocluster system.
Sample spectra were extracted along the collimated emission for a deeper analysis. The spectra are shown in Fig. 2 and were extracted from the NOEMA and ALMA maps from three regions44
4
The negative lobes in the ALMA spectra, especially in R1 and R3, are likely due to the filtering of larger scale SiO emission of the ALMA interferometer. These effects are present both the in the 12m array and in the compact array data, and both configurations have a maximum recovery scale smaller than the NOEMA array, whose data do not show this effect. If somehow this effect impacts the line width of the derived spectra, and in part its absolute brightness peak, this information is not the focus of the present work; only the latter quantities were used, with substantial uncertainties, in the non-LTE analysis. The purpose of the displayed spectra here is to show the kinematics of the SiO peaks at the different locations, i.e. the three regions along the jet emission.: the bright spot (6 level) map close to the HOPS-108 protostar and two regions encompassing emission knots chosen along the jet (yellow ellipses in Fig. 1). The region close to the protostar was labelled R1 (in Fig. 1 and Fig. 2) and the farthest R3, with the R2 being halfway between those two. For consistency, the ALMA maps around the SiO 5-4 emission line, exhibiting the same morphology of the SiO 2-1 emission, were convolved with a 2D Gaussian beam to match NOEMA angular resolution and regridded to the same pixel size. The velocity resolution of the ALMA data was also binned to match the NOEMA one ( km s-1). Despite the low velocity resolution, it is clear from Fig. 2 that the R1 emission is at a higher velocity with respect to the systemic velocity of the envelope (11.4 km s-1) and to the HOPS-108 protostar (Tobin et al. 2019, 13 km s-1,).
Further considerations on the kinematics can be drawn by studying the emission distribution for different channels. Fig. 4 shows that the SiO emission is detected through velocity channels from to km s-1. The emission at velocities higher than the HOPS-108 systemic velocity, 13 km s-1 (Tobin et al. 2019), remains very close to the protostar itself and coincides with the R1 location. Going from HOPS-108 to R3, the SiO emission defines a mild S-shape jet moving from the protostar towards the edge of the FIR4 cloud. In this picture, the SiO ‘blue’ outflow looks projected in the plane of the sky, while the red lobe is probably mixed with the complexity of the western region of FIR4 where HOPS-64 and VLA15 are also present. In this case, the high-velocity blob near the HOPS-108 protostar might be a product of the synchrotron emission of FIR3 impacting the region in FIR4, or, more likely, this could be due to the mixing of the various jets driven by the YSOs within the protocluster. Recent 100-au scale analysis by Chahine et al. 2022b showed a complex, filamentary structure of the western region of FIR4 at high resolution. In particular, SiO emission unveiled the presence of multiple bow-shock features with sizes between 500 and 2700 au likely caused by a precessing jet from FIR3 that goes from east to west.
These new observations suggest the presence of monopolar outflows in FIR4, which could be more common than previously thought. Chahine et al. 2022b showed a highly collimated ( 1∘) monopolar SiO jet outflow originating from VLA15 in the south-west part of FIR4 (see Fig.1). Monopolar outflows are also found in low-mass objects (Codella et al. 2014, e.g.) and among high-mass, star forming regions (Fernández-López et al. 2013; Nony et al. 2020, e.g.). From a theoretical point of view, Zhao et al. 2018 recently revealed that asymmetric outflows can be more common than symmetric ones, due to the complexity of 3D structures during the process of protoplanetary disc formation and the fact that material infall (as well as the magnetic field geometry) is strongly asymmetric.
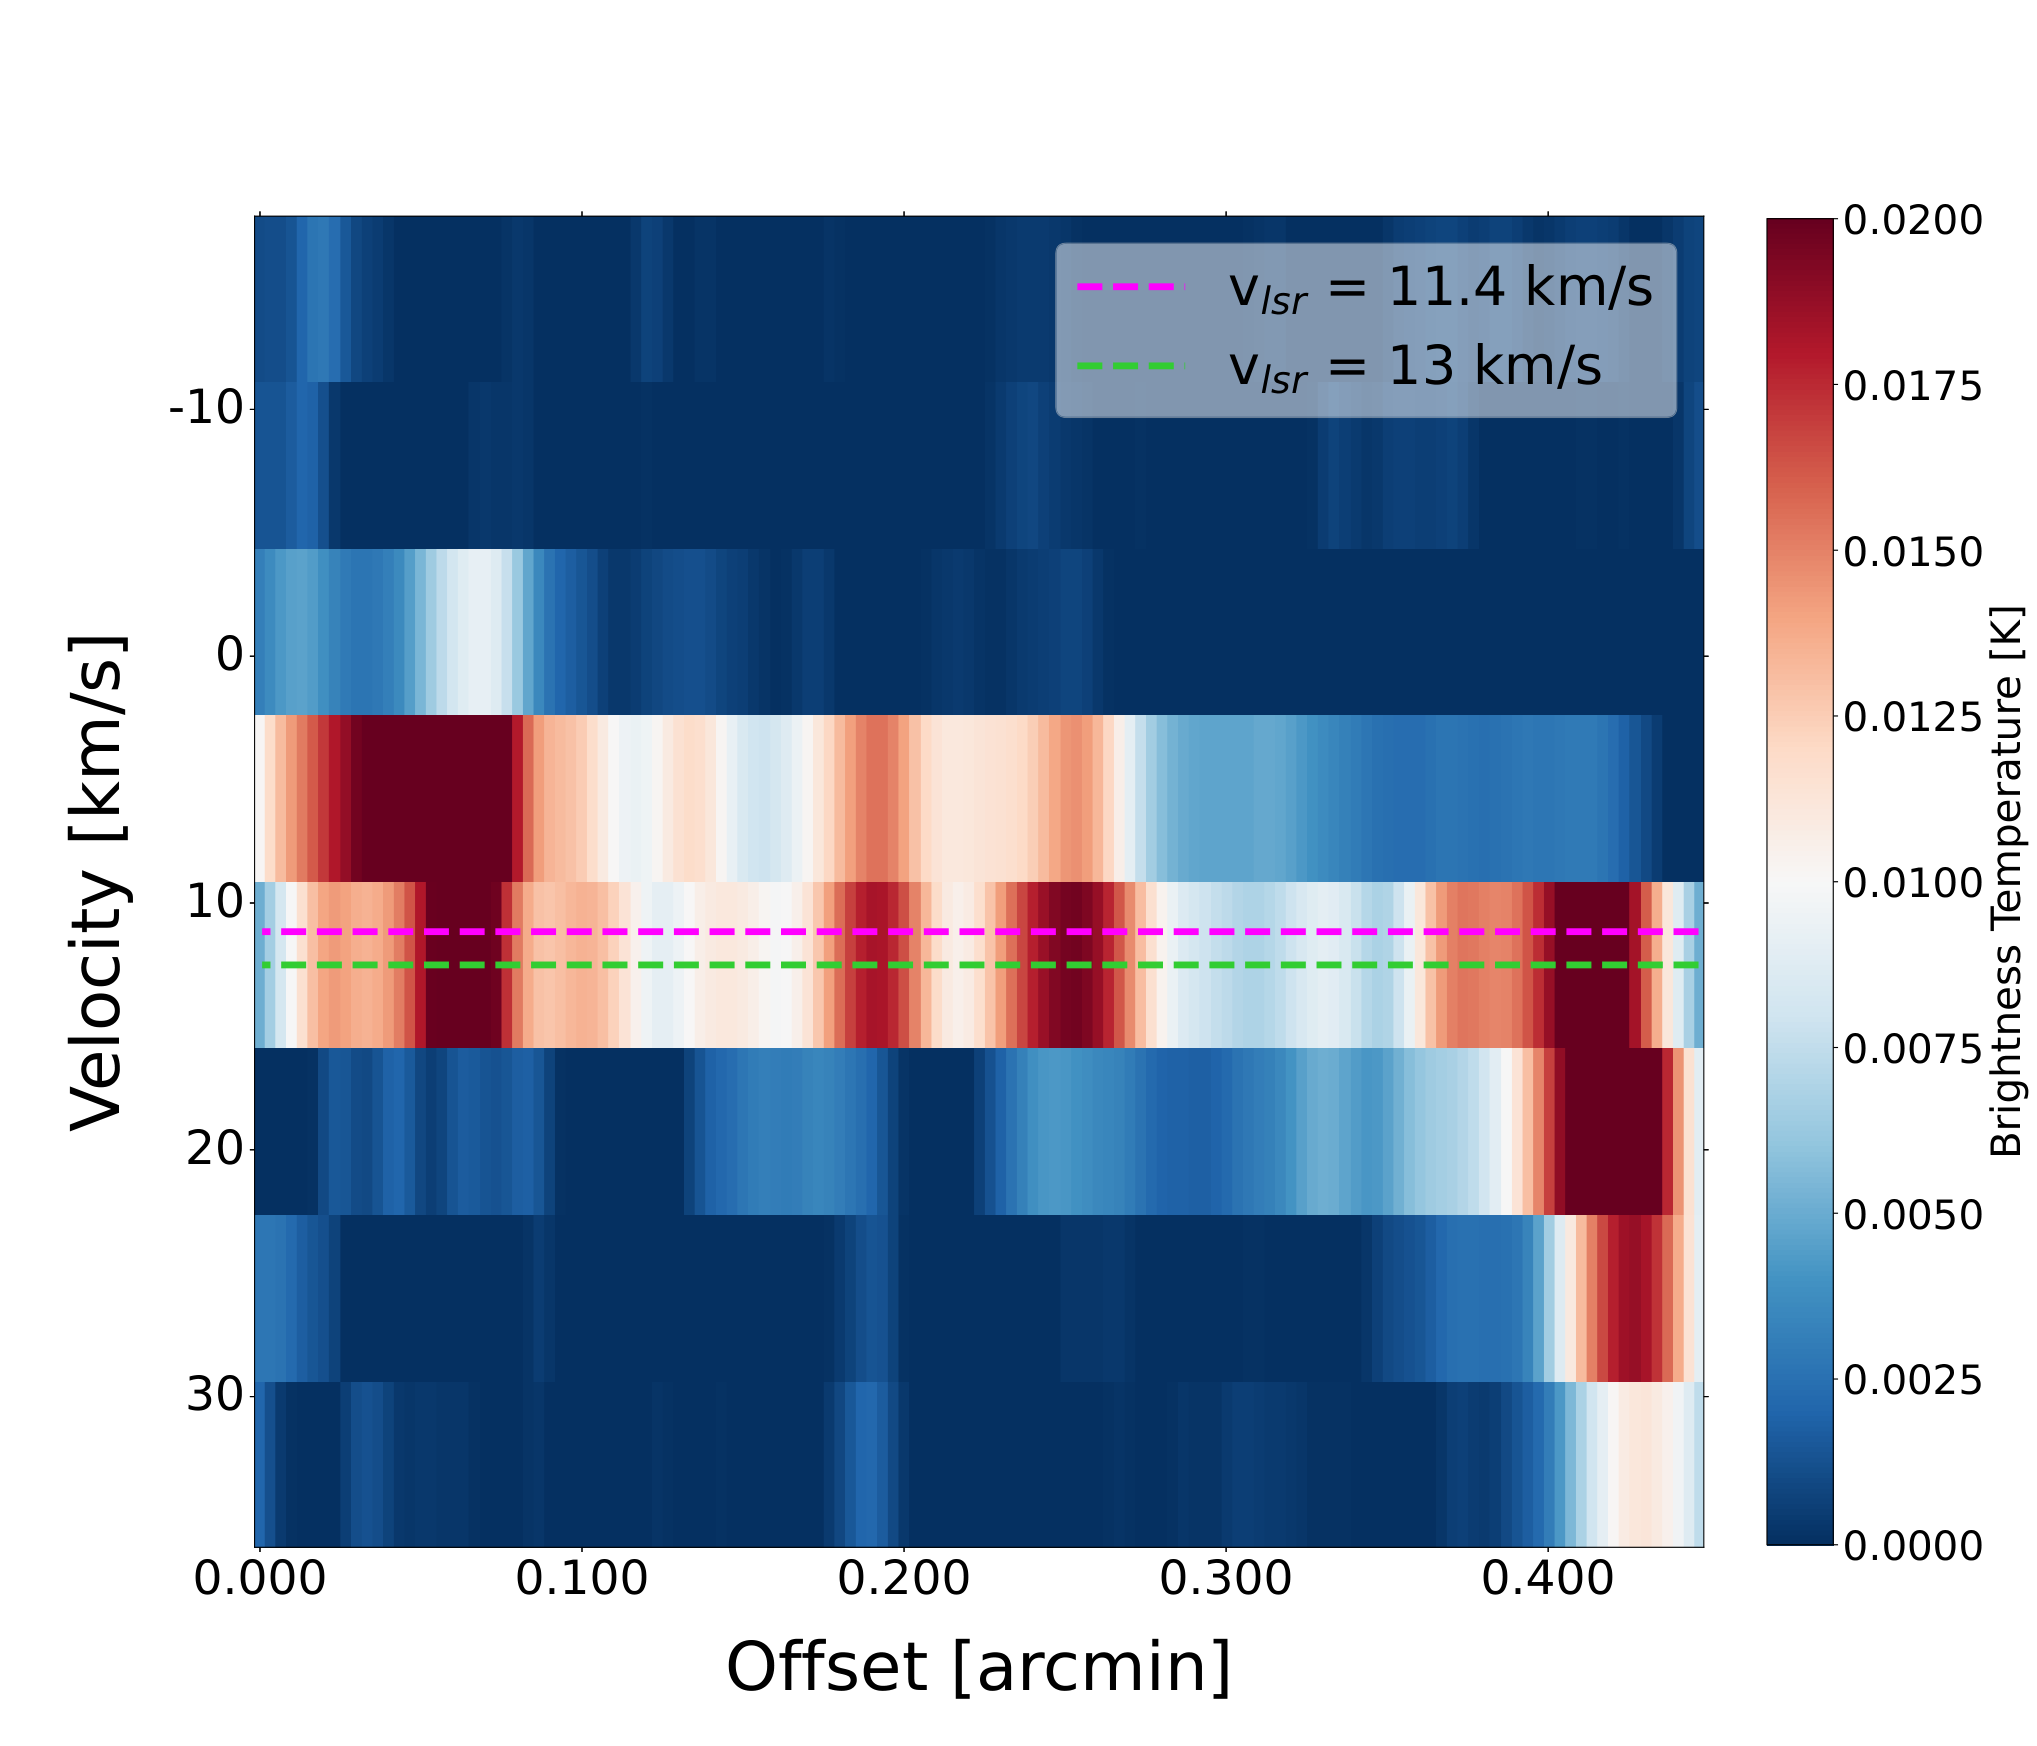
Figure 3 shows a position-velocity diagram obtained along a cut encompassing the SiO-collimated emission in the eastern part of FIR4 (see Fig. 1). Despite the channel resolution of our data, the red emission (i.e. at higher offset in Fig. 3, and hence closer to the HOPS-108 protostar) seems to be more spatially confined and reaches higher velocities than the blue emission. Similarly, in the channel maps displayed in Fig. 4 the velocity components larger than 19 km/s are very compact, while the blue emission ( ¡ 13 km/s), being projected in the plane-of-sky (more extended), has lower (line-of-sight) velocity components.
The moment 1 map in Fig. 5 shows the eastern region close to HOPS-108 embedded in a high-velocity ( 16 km s-1) emission blob, its western counterpart with a lower and more homogeneous velocity distribution, and the protostar in between this two regimes. The increase in SiO (blue-shifted) velocities is followed by an increase in distance between the SiO emission and the protostar, which is evidence that the material is being accelerated by entrainment mechanisms (Arce et al. 2007, e.g. jet-bow shock processes or decreasing cloud density gradient, see).


3.2 Non-LTE modelling
A series of non-LTE RADEX55
5
http://www.strw.leidenuniv.nl/~moldata/radex.html
(van der Tak et al. 2007) models were run to estimate the kinetic temperature and molecular hydrogen density from the observed ratios of the two SiO rotational transitions (Fig. 6). The input quantities for RADEX, namely the SiO column density (assuming optically thin emission) and the line width of the spectral lines, were estimated from Gaussian line fitting of the spectra performed with CASSIS66
6
http://cassis.irap.omp.eu/ for each region. The average values were then used in the non-LTE analysis (cm-2 for the column density). Also, a kinetic temperature in the 10-80 K range and a H2 volume density in the range 104-108 cm-3 were used as boundary conditions for the model; these ranges were constrained by previous observations of the source and shock models. The ratio of the peak brightness temperatures of the two SiO lines ( = 2-1 and 5-4), obtained from the three locations selected in the map, are shown by coloured dashed lines in Fig. 6, along with the different curves as a function of volume density and kinetic temperature.
3.3 Modelling particle acceleration
The origin of the high ionisation rate towards OMC-2 FIR4, revealed by Ceccarelli et al. 2014 and confirmed by the subsequent studies of Fontani et al. 2017 and Favre et al. 2018, has also been a subject of great interest from a theoretical perspective. Padovani et al. 2015; Padovani et al. 2016 and Gaches & Offner 2018 pointed out that, in the shocks located along a protostellar jet or on the surface of a protostar, local acceleration of charged particles may take place according to the first-order Fermi acceleration mechanism. According to this process, thermal particles are accelerated to energies high enough to explain extreme high values of the ionisation rate as well as the synchrotron emission observed in jet knots that cannot be justified by only taking into account the average Galactic CR flux.
Based on recent continuum observations at millimetre and centimetre wavelengths (Osorio et al. 2017; Tobin et al. 2019), which established that FIR4 could fall in the path of the jet that originated in the HOPS-370 protostar (belonging to the FIR3 protostellar cluster), Padovani et al. 2021 showed that an ionisation rate of s-1 can be reasonably expected if local particle acceleration occurs in the three knots of the HOPS-370 jet described in Osorio et al. 2017.
The discovery of a possible jet originating from the HOPS-108 protostar offers a distinct and appealing scenario for the local acceleration process, as the jet direction coincides with the side of the OMC-2 FIR4 protocluster where the high CR ionisation rate has been measured and spatially constrained. In addition, the central position of R1 with respect to the high-ionisation region (see Fig. 1) and its proximity to the HOPS-108 protostar allows us to relax the model assumptions, namely the interaction between the FIR4 region and the HOPS-370 jet, which is still a matther of debate (Favre et al. 2018). We applied the model described in Sect. 2 of Padovani et al. 2021 to R1 assuming a temperature of K (Frank et al. 2014) and a fully ionised medium at the shock front (Araudo et al. 2007). These are typical assumptions in the case of intermediate- and high-mass protostellar jets. From the new observations, we obtained information on two key parameters for the acceleration process: the projected distance of R1 from the protostar (also known as shock radius, AU) and the transverse size of the shock ( AU). The other parameters of the model, which are unknown, are the jet velocity in the shock reference frame (), the volume density (), the fraction of ram pressure transferred to thermal particles (), and the magnetic field strength ().
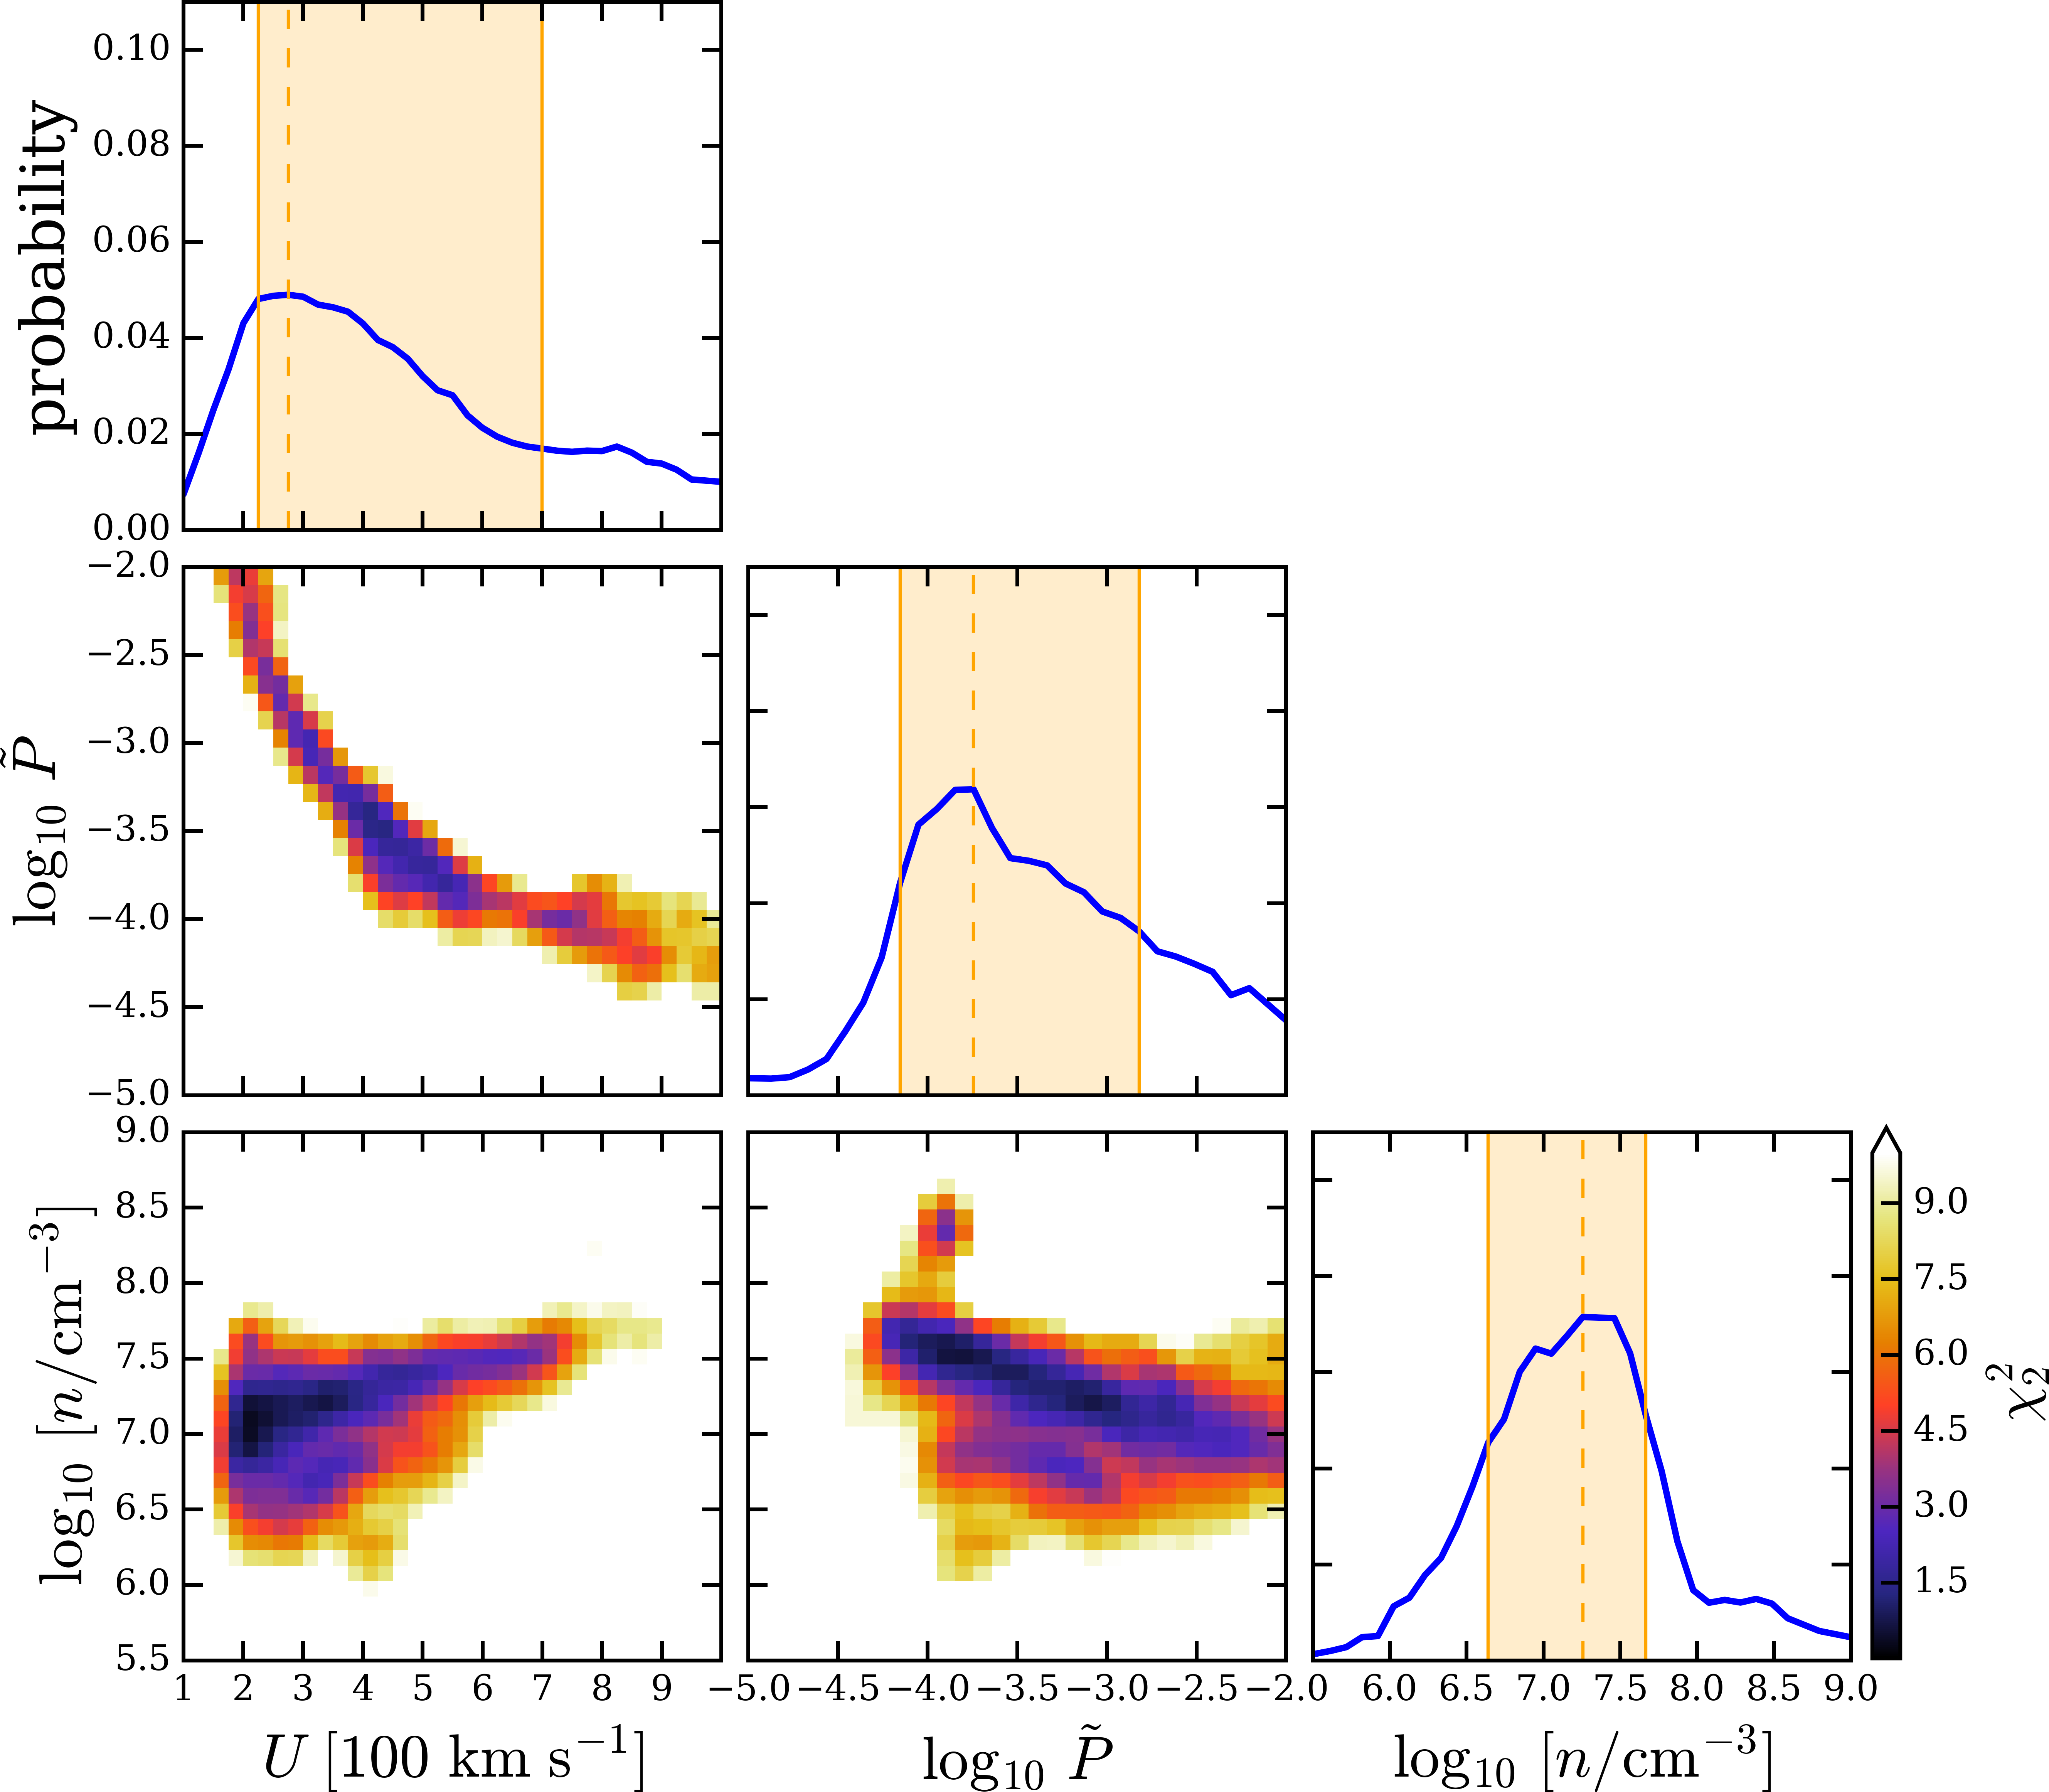
Following Padovani et al. 2021, we adopted a Bayesian method to infer the best-fit model, taking into account a set of values for each of the above parameters. In particular, we examined the following intervals: , , . We note that we considered the case of a parallel shock77 7 A shock is parallel when the shock normal is parallel to the ambient magnetic field., which represents the simplest approach. In this case, the particle acceleration timescale turns out to be independent of the magnetic field strength88 8 See Eqs. (13) in Padovani et al. 2021., so we would need synchrotron multi-frequency observations as in the case presented by Padovani et al. 2021 to constrain .
For each combination of the parameters, we calculated the flux of accelerated protons99 9 The proton flux is defined as the number of protons per unit of energy, time, area, and solid angle. at the shock surface of R1, . Then, we computed the propagation of the proton flux in each shell of radius from AU to AU, which is the average radius of the region where Fontani et al. 2017 found s-1 (see Fig. 1). Accounting for the attenuation of the flux according to the continuous slowing-down approximation, the proton flux in each shell is given by
| (1) |
where is the proton energy-loss function (Padovani et al. 2009), and is the energy of a proton with initial energy after passing through a column density . The parameter models the propagation of the protons and their relative energy loss depending on the environmental conditions; the two limiting cases are of pure free-streaming (i.e. geometrical dilution, ) and when the propagation is attenuated because of diffusion (Aharonian 2004, ;). Finally, we computed the mean proton flux averaging over the volume of the spherical shell,
| (2) |
The corresponding ionisation rate is
| (3) |
where is the ionisation cross-section for protons colliding with molecular hydrogen (Rudd et al. 1992, see e.g.). We then proceeded as follows: for each set of (), we computed the expected ionisation rate in the case of diffusion and geometrical dilution ( and , respectively). In the case that the ionisation rate estimated from the observations, , falls in the interval of , we assumed that the data were characterised by Gaussian uncertainties, so the likelihood of a given model is proportional to , with , where we assumed .
Since the best-fit parameter values computed in the diffusion and the geometrical dilution cases vary by less than 15%, we only discuss the results for the pure geometrical dilution case (). Fig. 7 shows the corner plot of the best fit: the quantities , , and show clear correlations and their probability distributions all show a rather pronounced peak (errors are estimated using the first and third quartiles). The best-fit ranges are , , and . Clearly, the errors are rather large, and this is due to the fact that we only have two observational constraints (the projected distance of R1 from HOPS-108 and the transversal size of the shock). However, the central values are consistent with those expected in this type of region (Padovani et al. 2021; Araudo et al. 2021).
4 Discussion
In the last ten years, several works focused on OMC-2 FIR4 to try to shed some light on the complexity of this protocluster region. Through analysis of the interaction between FIR3 and FIR4 via the [O I] jet originating from the former, González-García et al. 2016 also pointed out that the peak of the [O I] emission, along with all the other high-excitation molecular cooling lines observed in the far-IR (H2O, CO, and OH) with Herschel/PACS, has its emission peak at the location of FIR4 (Furlan et al. 2014). The lack of a jet outflow from FIR4 led the authors to the conclusion that the bright line [O I] emission seen towards FIR4 is the terminal shock (Mach disc) of the FIR3 jet. On the other hand, they also stated that FIR4 may simply lie along the line of sight and may not even be physically associated with the shocked emitting region. Similar conclusions concerning the interaction of FIR3 and FIR4 were proposed by Osorio et al. 2017, although the large proper motion velocity of HOPS-108 was inconsistent with the triggered scenario. The authors suggested that, alternatively, an apparent proper motion could result because of a change in the position of the centroid of the source due to a one-sided eject of ionised plasma, rather than by the actual motion of the protostar itself.
Previous SOLIS observations of this source revealed spatial variation among distinct carbon-chains towards FIR4. In Fontani et al. 2017, the whole FIR4 source was divided into two sub-regions, following the ratio of HC3N/HC5N emission (Fontani et al. 2017, see Fig. 1 of ). While in the western part this ratio is high (10-30), the eastern region of FIR4, identified by the green contour in Fig. 1, is rich in HC5N, making the HC3N/HC5N ratio in the 4-12 range. The authors interpreted this variation as the result of an enhancement of 1000 in the CR ionisation rate (with respect to the value deduced in molecular clouds) towards the eastern side of FIR4. In particular, the eastern half was proposed to be strongly irradiated, while the western region partially shielded. The SiO maps presented in this work are in agreement with this hypothesis. The emission morphology of SiO across the FIR4 region clearly shows a collimated stream towards the south-east, and a more compact blob in the western region. The jet candidate could in fact produce the acceleration of energetic particles as modelled by Padovani et al. 2016. This finding is also consistent with the detection of bright free-free emission partially overlapping with the FIR4-HC5N region observed in Fontani et al. 2017 and extending outside the eastern border of FIR4 (Reipurth et al. 1999). In Fig. 1, the SiO jet emission coincides with the FIR4-HC5N emission reported by Fontani et al. 2017. From this comparison, it is clear how HC5N and the SiO-jet trace the same, eastern part of FIR4.
Tobin et al. 2019 reported highly compact methanol emission originating from 100 AU scale coincident with this source. Although thermal evaporation of ices due to the thermal dust heating produced by the nearby HOPS-108 was proposed by the authors as the simplest explanation for the observed methanol emission, they also stated that shock heating might explain the chemical richness in molecular lines observed towards HOPS-108. This also suggests that a jet driven by HOPS-108 may be present. A possible scenario would be that a protostellar jet and the highly energetic ionised plasma accelerated by the protostar impacts the material nearby, producing shocked gas traced by the SiO.
Using this assumption, the model implemented in this work shows that the conditions of the shock regions traced by SiO, in particular close to the protostar HOPS-108 (i.e. R1), are favourable for the acceleration of thermal particles, boosting their energies high enough to explain the ionisation rate inferred by previous studies. Previous theoretical works had already shown that the high ionisation rate observed in the FIR4 region can be explained by the presence of cosmic rays locally accelerated on the protostellar surface (Padovani et al. 2016), in a protostellar cluster (Gaches & Offner 2018; Gaches et al. 2019), or in jet shocks (Padovani et al. 2021). Thanks to the new high angular-resolution observations presented in this article, we have been able to identify the local CR source much more precisely. With all the limitations due to the current dataset, the model indeed derives physical-chemical parameters in accordance with those obtained by previous works. In particular, the H2 volume density is in good agreement with the values obtained using different techniques (Ceccarelli et al. 2014; López-Sepulcre et al. 2013, e.g.). Similar considerations apply to the results of the non-LTE analysis of the SiO emission spectra extracted from the regions along the jet itself. The values of the kinetic temperature and density obtained by modelling the ratio of the observed transitions are consistent with those obtained by previous studies (20 K ¡ Tkin¡ 50 K for densities cm-3).
5 Conclusions
New NOEMA observations allowed us to shed some light on the protocluster FIR4 in the OMC-2 region, and to propose a new scenario to explain its puzzling high ionisation rate. The main outcomes of the present study are as follows:
- 1.
The detection of a jet candidate originating from within the FIR4 cloud for the first time, which was seen in the SiO (2-1) line.
- 2.
The jet candidate is extending towards the east side of OMC-2 FIR4, in the same region where a high ionisation rate was previously measured.
- 3.
Our observations suggest that the protostellar HOPS-108 might be the driving source candidate of the SiO jet.
- 4.
Modelling the acceleration of particles along the collimated emission, we show that the high ionisation can indeed be produced by the newly discovered jet driven by HOPS-108.
This acceleration allows the particle to gain enough energy to explain the ionisation rate inferred in the region by previous studies. Future analyses on this collimated emission, performed with higher angular and spectral resolution, might help to further elucidate the complex kinematics of this system.
Acknowledgements.
This project has received funding within the European Union’s Horizon 2020 research and innovation programme from the European Research Council (ERC) for the project “The Dawn of Organic Chemistry” (DOC), grant agreement No 741002, and from the Marie Sklodowska-Curie for the project ”Astro-Chemical Origins” (ACO), grant agreement No 811312. This paper makes use of the following ALMA data: ADS/JAO.ALMA#2017.1.01353.S. ALMA is a partnership of ESO (representing its member states), NSF (USA) and NINS (Japan), together with NRC (Canada), MOST and ASIAA (Tai- wan), and KASI (Republic of Korea), in cooperation with the Republic of Chile. The Joint ALMA Observatory is operated by ESO, AUI/NRAO and NAOJ. V.L., F.O.A., and P.C. acknowledge financial support from the Max Planck Society. We thank Alexei Ivlev and Jaime E. Pineda for useful discussions.References
- Adams (2010) Adams, F. C. 2010, ARA&A, 48, 47
- Adams et al. (2012) Adams, J. D., Herter, T. L., Osorio, M., et al. 2012, ApJ, 749, L24
- Aharonian (2004) Aharonian, F. A. 2004, Very high energy cosmic gamma radiation: a crucial window on the extreme Universe
- Araudo et al. (2021) Araudo, A. T., Padovani, M., & Marcowith, A. 2021, MNRAS, 504, 2405
- Araudo et al. (2007) Araudo, A. T., Romero, G. E., Bosch-Ramon, V., & Paredes, J. M. 2007, A&A, 476, 1289
- Arce et al. (2007) Arce, H. G., Shepherd, D., Gueth, F., et al. 2007, in Protostars and Planets V, ed. B. Reipurth, D. Jewitt, & K. Keil, 245
- Cazaux et al. (2003) Cazaux, S., Tielens, A. G. G. M., Ceccarelli, C., et al. 2003, ApJ, 593, L51
- Ceccarelli et al. (2017) Ceccarelli, C., Caselli, P., Fontani, F., et al. 2017, ApJ, 850, 176
- Ceccarelli et al. (2014) Ceccarelli, C., Dominik, C., López-Sepulcre, A., et al. 2014, ApJ, 790, L1
- Chahine et al. (2022a) Chahine, L., López-Sepulcre, A., Neri, R., et al. 2022a, A&A, 657, A78
- Chahine et al. (2022b) Chahine, L., López-Sepulcre, A., Podio, L., et al. 2022b, A&A, 667, A6
- Codella et al. (2014) Codella, C., Maury, A. J., Gueth, F., et al. 2014, A&A, 563, L3
- Endres et al. (2016) Endres, C. P., Schlemmer, S., Schilke, P., Stutzki, J., & Müller, H. S. P. 2016, Journal of Molecular Spectroscopy, 327, 95
- Favre et al. (2018) Favre, C., Ceccarelli, C., López-Sepulcre, A., et al. 2018, ApJ, 859, 136
- Fernández-López et al. (2013) Fernández-López, M., Girart, J. M., Curiel, S., et al. 2013, ApJ, 778, 72
- Fontani et al. (2017) Fontani, F., Ceccarelli, C., Favre, C., et al. 2017, A&A, 605, A57
- Frank et al. (2014) Frank, A., Ray, T. P., Cabrit, S., et al. 2014, in Protostars and Planets VI, ed. H. Beuther, R. S. Klessen, C. P. Dullemond, & T. Henning, 451
- Furlan et al. (2014) Furlan, E., Megeath, S. T., Osorio, M., et al. 2014, ApJ, 786, 26
- Gaches & Offner (2018) Gaches, B. A. L. & Offner, S. S. R. 2018, ApJ, 861, 87
- Gaches et al. (2019) Gaches, B. A. L., Offner, S. S. R., & Bisbas, T. G. 2019, ApJ, 878, 105
- González-García et al. (2016) González-García, B., Manoj, P., Watson, D. M., et al. 2016, A&A, 596, A26
- Gounelle et al. (2013) Gounelle, M., Chaussidon, M., & Rollion-Bard, C. 2013, ApJ, 763, L33
- Högbom (1974) Högbom, J. A. 1974, A&AS, 15, 417
- Jørgensen et al. (2005) Jørgensen, J. K., Bourke, T. L., Myers, P. C., et al. 2005, ApJ, 632, 973
- Kounkel et al. (2017) Kounkel, M., Hartmann, L., Loinard, L., et al. 2017, ApJ, 834, 142
- López-Sepulcre et al. (2013) López-Sepulcre, A., Taquet, V., Sánchez-Monge, Á., et al. 2013, A&A, 556, A62
- Müller et al. (2013) Müller, H. S. P., Spezzano, S., Bizzocchi, L., et al. 2013, Journal of Physical Chemistry A, 117, 13843
- Nony et al. (2020) Nony, T., Motte, F., Louvet, F., et al. 2020, A&A, 636, A38
- Osorio et al. (2017) Osorio, M., Díaz-Rodríguez, A. K., Anglada, G., et al. 2017, ApJ, 840, 36
- Padovani et al. (2009) Padovani, M., Galli, D., & Glassgold, A. E. 2009, A&A, 501, 619
- Padovani et al. (2015) Padovani, M., Hennebelle, P., Marcowith, A., & Ferrière, K. 2015, A&A, 582, L13
- Padovani et al. (2021) Padovani, M., Marcowith, A., Galli, D., Hunt, L. K., & Fontani, F. 2021, A&A, 649, A149
- Padovani et al. (2016) Padovani, M., Marcowith, A., Hennebelle, P., & Ferrière, K. 2016, A&A, 590, A8
- Reipurth et al. (1999) Reipurth, B., Rodríguez, L. F., & Chini, R. 1999, AJ, 118, 983
- Rudd et al. (1992) Rudd, M. E., Kim, Y. K., Madison, D. H., & Gay, T. J. 1992, Reviews of Modern Physics, 64, 441
- Sato et al. (2022) Sato, A., Takahashi, S., Ishii, S., et al. 2022, arXiv e-prints, arXiv:2211.12140
- Shimajiri et al. (2015) Shimajiri, Y., Sakai, T., Kitamura, Y., et al. 2015, ApJS, 221, 31
- Shimajiri et al. (2008) Shimajiri, Y., Takahashi, S., Takakuwa, S., Saito, M., & Kawabe, R. 2008, ApJ, 683, 255
- Tobin et al. (2019) Tobin, J. J., Megeath, S. T., van’t Hoff, M., et al. 2019, ApJ, 886, 6
- van der Tak et al. (2007) van der Tak, F. F. S., Black, J. H., Schöier, F. L., Jansen, D. J., & van Dishoeck, E. F. 2007, A&A, 468, 627
- Zhao et al. (2018) Zhao, B., Caselli, P., Li, Z.-Y., & Krasnopolsky, R. 2018, MNRAS, 473, 4868