Biosignature Line Ratios of [P II] in Exoplanetary and Nebular EnvironmentsBiosignature Line Ratios of [P II] in Exoplanetary and Nebular Environments–Data Availability2022
Abstract
Being the backbone element of DNA, phosphorus is a key component in the search for life in the Universe. To aid in its detection, we present line emissivity ratios for the five lowest-lying forbidden [P II] transitions, namely those among the levels . The wavelengths range between 0.44-70 m , and several lie within the spectroscopic domain observable with the James Webb Space Telescope (JWST). These line ratios have been calculated using a new collisional-radiative-recombination (CRR) model combining calculated collision strengths and level-specific recombination rate coefficients; with both datasets computed using the accurate Breit-Pauli R-Matrix method. The CRR model includes a new scheme for (e + ion) recombination to emission line formation. We compare its effect to models incorporating only electron impact excitation and spontaneous radiative decay. We find that (e + ion) recombination has a significant impact on all line ratios, and represents a major improvement in physical accuracy of emission line models.
Keywords:
ISM: atoms ¡ Interstellar Medium (ISM), Nebulae, ISM: supernova remnants, Physical Data and Processes, atomic processes, astrobiology, infrared: general, exoplanets1 Introduction
Phosphorus could be of key importance in the search for life in the Universe. As the backbone element of DNA, it could be a fundamental prerequisite for the formation of life. It is thus of keen interest to perform theoretical calculations that can provide a basis of comparison for real observations of exoplanets. In order to determine if phosphorus is present in an observed exoplanet, we must first understand the elements spectral signature. To that end, it is necessary to build an accurate model of as many physical processes that influence the emission spectrum of phosphorus as possible.
Previous studies on phosphorus abundance have been confined to ionized sources such as nebulae (Pottsch et al. 2008, Pottasch and Bernard-Salas 2008, Otsuka et al. 2011), and FGK dwarf stars (Maas et al. 2017). The former are associated with star-forming regions, and the latter are potential sources for Earth-like extra-solar planets. Nucleosynthesis leading to phosphorus (Z=15) production can occur in AGB stars, but mainly in supernovae by neutron capture with silicon (Z=14). Koo et al. (2013) analyzed the P/Fe abundance ratio in the supernova remnant Cassiopia A using forbidden P ii 1.189 m line and Fe ii 1.257 m lines to deduce about 100 times the average ratio in the Milky Way. Otherwise, phosphorus abundances are generally low in solar system by number relative to hydrogen (Asplund et al. 2009). Also, its gas phase abundance is difficult to determine due to dust and grain formation since phosphorus is very reactive.
Of all biosignature elements H, C, N, O, P and S, atomic data for P-ions is the least available, except a limited number of energies from the National Institute for Standards and Technology (NIST), theoretial photoionization and (e + ion) recombination data (Nahar 2016, 2017), experimental measurements and comparison with theory for P ii (Hernandez et al. 2015, Nahar et al. 2017), and collision strengths for P iii (Naghma et al. 2018). With the aim of more comprehensive analysis of observational data, we compute the relevant atomic parameters and line intensity ratios for P ii . In particular, we study lines that might be detectable with JWST in the NIR range 0.6-28 m . The primary focus of this work is the description of a major improvement to modelling emission lines by the inclusion of detailed and accurate (e + ion) recombination contribution to forbidden lines from recombination-cascades via high-lying levels up to , and its application to the modelling of P ii emission. Generally, we consider collisional-radiative models wherein electron impact excitation is the primary means of populating low-lying excited levels which produce forbidden emission lines. In this work, we generalize the model to a collisional-radiative-cascade (CRR) model in which (e + ion) recombination followed by myriad radiative pathways significantly populate upper levels. This additional contribution yields considerable change in level populations and line emissivities, demonstrating the importance of utilizing models with (e + ion) recombination and radiative cascades. The treatment described is generally applicable to modeling atomic spectra.
2 Theory & Computational Method
A theoretical description of key atomic parameters is outlined here.
2.1 Energy Levels & Einstein A Coefficients
In order to calculate the necessary energy levels and Einstein A-coefficients for spontaneous radiative decays, we have employed the atomic structure code SUPERSTRUCTURE (Eissner et al. 1974). The code operates using the Breit-Pauli approximation, and produces fine structure level energies and associated radiative transition rates. Figure 1 presents the Grotrian energy level diagram for the 5 lowest fine structure levels of P ii . All levels presented are within the ground configuration . The energy difference between the ground state and the highest level is about 0.2 Ryd or 2.72 eV. All levels are of even parity, thus all transitions between them and discussed in this work are forbidden due to electric quadrupole E2 and magnetic dipole M1 second order relativistic interactions.

2.2 Electron Impact Excitation
When considering the effects of of Electron Impact Excitation there are two quantities to consider. First, the collision strengths which are related to the probability and cross section as function of energy of an incident electron at a given energy E causing an excitation from a given initial level to a final level . For astrophysical plasma sources we generally assume a Maxwellian distribution of electron energies correspnding to a given electron kinetic temperature . Therefore, for calculating line emissivity ratios, we compute and employ Maxwellian averaged effective collision strength at a range of characteristic of the source, and that is related to the rate at which a given transition is collisionally excited,
| (1) |
Here, is the collision strength for the transition ; is the Boltzman constant. Fig. 2 shows a sample of computed collision strengths and effective collision strengths. As seen, collision strengths demonstrate extensive resonance structures which make them highly dependent on electron energy, while effective collision strengths are slowly varying with , also implying that slight errors in temperature have a less significant impact on any derived result.
Effective collision strengths have been calculated for the 67 lowest lying P ii levels. We also compare the computed line ratios from the present CRR model using previously calculated P ii collision strengths (Tayal 2004). We have employed level-specific recombination rate coefficients (Nahar 2017a, 2017b) for 243 levels. For levels not included in the models the effective collision strengths are set to zero. The inclusion of many more levels for (e + ion) recombination-cascades should offset the insignficant loss of accuracy from omitting the electron impact excitation to higher levels.
2.3 Electron-ion recombination
The contribution of recombination is contained in two key parameters, recombination rate coefficients and cascade coefficients. Level-specific recombination rates refer to electron recombining with an ion, in this case P iii to form P ii in an excited state. They are defined by Eq. 2, where gj is the statistical weight factor of the final state of the ion being recombined, gs is the statistical weight of the initial state of the recombining ion, k is the Boltzmann constant, T is the temperature of the plasma, m is the mass of the electron, c is the speed of light, is the energy of the incident electron, and ) is the photoionization cross section a given electron energy. The Milne relation gives the level-specific rate coefficient into level as:
| (2) | |||||
The cascade coefficients Cji are calculated from BPRM A-values and used to obtain the fractional contribution due to (e + ion) recombination into an upper level to a lower level . The Cji take into account all spontaneous radiative decays via dipole E1 transtions through intermediate levels such that as follows,
| (3) |
The A-values are the only necessary quantities for calculating cascade coefficients; C are subsets of intermediate cascade coefficients, and combining these we obtain the total effective recombination contribution to a given level population.
2.4 Line Emissivities & Ratios
Combining the results above we obtain line emissivity ratios from CRR models. The theoretical line emissivity is the amount of energy per unit time per unit volume for a given transition. For a given P ii transition it may be expressed as,
| (4) |
refers to the population of the upper state. Summation over refers to the total population of all levels included in the calculation, and n(P ii )/n(P) is the density ratio relative to phosphorus abundance P/H. In order to obtain line emissivities form Eq. 4 one needs ionization fractions P ii /P in the plasma source at the appropriate temperature and density, which are generally unknown a priori and are model dependent. We compute line ratios in a temperature-density range of exoplanetary ionospheres as
| (5) |
for any two transitions and . The ratio in Eq. 5 eliminates the number density factors and instead leaves only the relative population factor, Einstein A values, and energies of the two transitions being considered. The key quantities here are relative populations of upper levels computed by our CRR models.
2.5 Code SPECTRA
These results have been produced by a new version of the code SPECTRA, employed in many past calculations of line ratios. Previously, the code considered electron impact excitation and photoexcitation for populating excited levels. The updated version accounts for (e + ion) recombination as described. Moreover, the new code is written in C++ rather than Fortran which increases its utitliy, efficiency, and portability.
The computational work was performed in two distinct stages. First, there was a direct unaltered translation from Fortran to C++. During this stage, the primary goal was to produce matching results with identical input data to many significant figures. The second stage included the recombination-cascade formalism described herein. As there are no previous results to compare with, extensive testing was performed and checked several different ways (including manually) to ensure accuracy and reliability for modelling emission lines with recombination contributions in general.
3 Results and discussion
The main results presented are the newly calculated collision strengths, Maxwellian-averaged effective collision strengths, and line emissivity ratios. The former two have been computed for all transitions among the first 67 P ii levels, with a small sample of select results presented in table 1, and shown in Fig. 2 for two transitions and at wavelengths 8751 and 4413, respectively. The emissivity ratios are presented in Figures 3 & 4.
3.1 Effective Collision Strengths
The collision strengths and effective collision strengths for two select transitions can be seen in Figure 2. The strong resonant structures in the former are clearly visible, as is the signature smoothing of the effective collision strengths.

The temperature dependence of effective collision strengths due to autoionizing resonances is quite pronounced, and is different from that of (e + ion) recombination. The competition between the two processes populating upper levels and leads to very different line emissivity ratios.
3.2 Line Emissivity Ratios
Line ratios for select transitions among the first 5 P ii levels can be seen in Figure 3. The key features to note are the differences among the three independent curves in each plot with inclusion of (e + ion) recombination and without. We find a large increase with (e + ion) recombination-cascades in the CRR model (red curves), and much lower emissivity ratios without (blue and black curves) using our newly calculated collision strengths and earlier work by Tayal (2004), respectively. Although the two sets of collision strengths data yield practically the same values at low densities cm-3, the differences increase at higher densities. That is owng to collisional coupling among the 5 levels which becomes more prominent and manifested in line ratios. Tayal’s collision strengths are higher than present ones for excitation of upper levels considered and yield higher line ratios at cm-3; those would be even higher if (e + ion) recombination is included. This illustrates not only a significant improvement in accuracy using the CRR model, but also that (e + ion) recombination using detailed and precise level-specific recombination rates should be used as basis of comparison with observed emission-line spectra.
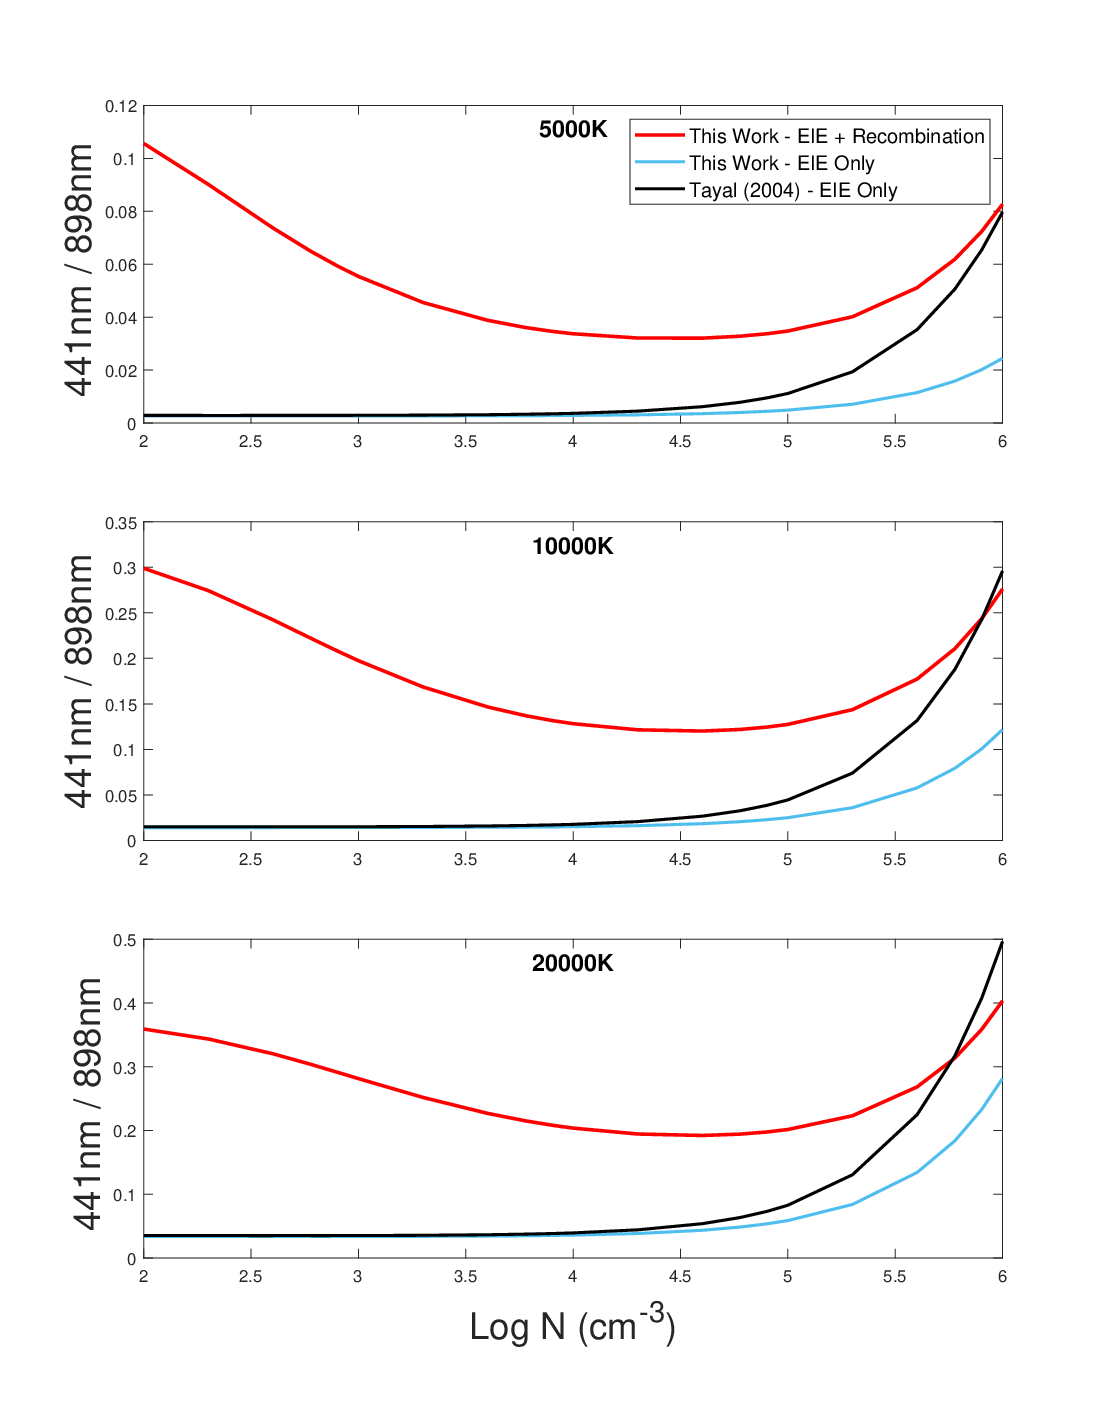
Figure 4 includes line ratios for select transitions whose wavelengths are within JWST spectrographic instrumental range 0.6-28m at the three different temperatures. However, in this case the upper level is the same for all ratios and therefore line emissivities depend only on the respective A-values, and to a smaller extent on the energy differences. The A-values for the three transitions are: sec-1, respectively. Therefore, the proportion of line ratios 0.898m/0.890m and 0.875m/0.890m due to / and / remains approximately constant 3:1 (modulo the small energy differences). Again, we find large differences upon inclusion of recombination-cascade contributions to emission lines owing to upper levels being populated predominantly by (e + ion) recombination rather than excitation due to electron impact.
As the electron density increases above cm, recombination-cascades are relatively less important compared to electron collisions and the two curves are eventually seen to converge at high densities, though the proporation remains the same as it should owing to origin of line emissivity from a single upper level. We note in passing that there are several transitions orginating from the same level where the line ratios show similar behavior and are constant across temperatures and densities since only the upper level’s population is sensitive to either and present in both numerator and denominator. As such line ratios depend only on ratios of A-values and energy differences, and provide a an accuracy check on input data.

Line emissivities for [P ii ] transitions within the ground configuration are computed using two sets of collision strengths of data, computed as part of the present work as as previously reported in literature (Tayal 2004). Although the line ratios are in good agreement, they differ significantly; the new values should be more accurate. The CRR models can be further improved by the consideration of fluorescent excitation due to an external source of radiation, namely the planet’s host star. SPECTRA maintains the ability to account for that process and can incorporate that mechanism, though it is likely to be much smaller than electron excitation and (e + ion) recombination-cascade processes for forbidden line formation.
| ) | ) | ||||||||
| J-J’ | 0-2 | 1-2 | 2-2 | 2-0 | J-J’ | 0-2 | 1-2 | 2-2 | 2-0 |
| 8862.6 | 4441.7 | 2916.7 | 1571.2 | 8862.6 | 4441.7 | 2916.7 | 1571.2 | ||
| 2.0 | 5.04(-1) | 1.40(-1) | 2.97(-3) | 2.01(-56) | 3.6 | 6.11(-1) | 1.693 | 2.552 | 2.91(-2) |
| 2.1 | 5.07(-1) | 2.23(-1) | 1.20(-2) | 5.29(-45) | 3.7 | 6.19(-1) | 1.740 | 2.683 | 5.77(-2) |
| 2.2 | 5.10(-1) | 3.39(-1) | 3.62(-2) | 6.23(-36) | 3.8 | 6.27(-1) | 1.781 | 2.798 | 1.01(-1) |
| 2.3 | 5.12(-1) | 4.63(-1) | 8.73(-2) | 1.00(-28) | 3.9 | 6.34(-1) | 1.822 | 2.902 | 1.59(-1) |
| 2.4 | 5.14(-1) | 5.94(-1) | 1.76(-1) | 5.29(-23) | 4.0 | 6.45(-1) | 1.866 | 3.005 | 2.32(-1) |
| 2.5 | 5.16(-1) | 7.23(-1) | 3.06(-1) | 1.86(-18) | 4.1 | 6.57(-1) | 1.915 | 3.113 | 3.21(-1) |
| 2.6 | 5.17(-1) | 8.47(-1) | 4.77(-1) | 7.62(-15) | 4.2 | 6.72(-1) | 1.972 | 3.228 | 4.25(-1) |
| 2.7 | 5.20(-1) | 9.61(-1) | 6.78(-1) | 5.64(-12) | 4.3 | 6.89(-1) | 2.031 | 3.343 | 5.41(-1) |
| 2.8 | 5.23(-1) | 1.065 | 8.99(-1) | 1.07(-9) | 4.4 | 7.03(-1) | 2.084 | 3.444 | 6.65(-1) |
| 2.9 | 5.28(-1) | 1.160 | 1.129 | 6.94(-8) | 4.5 | 7.11(-1) | 2.117 | 3.511 | 7.89(-1) |
| 3.0 | 5.36(-1) | 1.250 | 1.362 | 1.91(-6) | 4.6 | 7.10(-1) | 2.119 | 3.524 | 9.00(-1) |
| 3.1 | 5.47(-1) | 1.337 | 1.593 | 3.00(-5) | 4.7 | 6.95(-1) | 2.081 | 3.469 | 9.91(-1) |
| 3.2 | 5.60(-1) | 1.421 | 1.817 | 2.20(-4) | 4.8 | 6.66(-1) | 2.000 | 3.340 | 1.050 |
| 3.3 | 5.75(-1) | 1.501 | 2.030 | 1.14(-3) | 4.9 | 6.25(-1) | 1.879 | 3.143 | 1.071 |
| 3.4 | 5.89(-1) | 1.574 | 2.226 | 4.31(-3) | 5.0 | 5.73(-1) | 1.725 | 2.890 | 1.054 |
| 3.5 | 6.01(-1) | 1.638 | 2.400 | 1.24(-2) |
4 Conclusion
The computed data and results are useful for both temperature/density diagnostics and possible detection of phosphorus in astrophysical sources, particularly exoplanetary ionosopheres as biosignatures or precursors of DNA-based life forms. Line emissivity ratios and new collision strengths for P ii are computed for comparison with observation and diagnostics. The inclusion of (e + ion) recombination has a large impact on forbidden line emissivities, and considerably improve the physical accuracy of models. Many transitions, with a sample of results presented, occur within the 0.6-28.3 m range of the spectrometers aboard JWST. Given the sensitivity of JWST, these emission lines might be present in the spectra of exoplanets that have detectable amounts of
Future work will involve a more complete CRR modelling of resultant spectrum with SPECTRA involving emission and absorption processes. This entails user input of ionization fractions and abundances to produce individual line emissivities, in addition to line ratios. Data from this new code can then be combined with codes for a full-scale modelling of planetary atmospheres, such as a new version of the code GEANT4-EXOP code in progress (M. Rothman, private communication). These models will include atomic-ionic-molecular data as input to produce absorption and emission spectra of other biosignature elements.
Acknowledgments
The computational work was carried out at the Ohio Supercomputer Center in Columbus Ohio.
Data Availability
All data underlying the results presented are available publicly from the online database Nahar-OSU-Atomic-Radiative-Data (NORAD), maintained by co-author S.N. Nahar at the Department of Astronomy of the Ohio State University from the website https://norad.astronomy.ohio-state.edu.
References
- Asplund (2009) Asplund, M., Grevesse, N., Jacques Sauval, A. and Scott, P., 2009, Ann. Rev. Astron. Astrophys. 209, 47
- Blum (1991) Blum, R. D. and Pradhan, A. K., 1991, Phys. Rev. A 44, 6123
- Burke (2011) Burke, P.G., R-Matrix Theory of Atomic Collisions, 2011, Springer
- Ganas (1998) Ganas, P. S., 1998, Eur. Phys. J. D-1, 165
- Hernández (2015) L. Hernández a, A.M. Covington b, E.M. Hernández a,d, A. Antillón a, A. Morales-Mori a, Kiattichart Chartkunchand b, A. Aguilar c, G. Hinojosa, JQSRT 159, July 2015, Pages 80-86
- Maas (2017) Maas, Z. G., Pilachowski, C. A. and Cescutti, G., 2017, Astrophys. J. 841, 108
- Nahar (2017) Nahar, S. N. et al. , JQSRT 187, 215 (2017)
- Nahar (2017) Nahar, S. N., Mon. Not. R. astr. Soc. 469, 3225 (2017a)
- Nahar (2017) Nahar, S. N., New Ast 50, 19 (2017b)
- Naghma (2018) Naghma, R., Nahar, S. N., Pradhan, A. K., Mon. Not. R. astr. Soc. 479, L60 (2018)
- Otsuka (2011) Otsuka, M., Mexner, M., Riebel, D., Hyung, S., Tajitsu, A. and Izumiura, H., 2011, Astrophys. J. 729, 39
- Peng (1994) Peng, J. and Pradhan, A. K., 1994, Astrophys. J. Lett. 432, L123
- Pottasch (1999) Pottasch, S. R. and Beintema, D. A., 1999, Astron. Astrophys. 347, 975
- Pottasch (2008) Pottasch, S. R., Bernard-Salas, J. and Roelig, T. L., 2008, Astron. Astrophys. 481, 393
- Pottasch (2008) Pottasch, S. R. and Bernard-Salas, J., 2008, Astron. Astrophys. 490, 715
- Pradhan (2011) Pradhan, A. K. and Nahar, S. N., 2011, Atomic Astrophysics and Spectroscopy, Cambridge University Press
- Wang (2016) Wang, H., Jiang, G. and Duan, J., 2016, Eur. Phys. J. D 70, 122