Site-specific weed management in corn using UAS imagery analysis and computer vision techniques
Abstract
Currently, applying uniform distribution of chemical herbicide through a sprayer without considering the spatial distribution information of crops and weeds is the most common method of controlling weeds in commercial agricultural production system. This kind of weed management practice lead to excessive amounts of chemical herbicides being applied in a given field. The objective of this study was to perform site-specific weed control (SSWC) in a corn field by: 1) using a unmanned aerial system (UAS) to map the spatial distribution information of weeds in the field; 2) creating a prescription map based on the weed distribution map, and 3) spraying the field using the prescription map and a commercial size sprayer. In this study, we assumed that plants growing outside the corn rows are weeds and they need to be controlled. The first step in implementing such an approach is identifying the corn rows. For that, we are proposing a Crop Row Identification (CRI) algorithm, a computer vision algorithm that identifies corn rows on UAS imagery. After being identified, the corn rows were then removed from the imagery and remaining vegetation fraction was classified as weeds. Based on that information, a grid-based weed prescription map was created and the weed control application was implemented through a commercial-size sprayer. The decision of spraying herbicides on a particular grid was based on the presence of weeds in that grid cell. All the grids that contained at least one weed were sprayed, while the grids free of weeds were not. Using our SSWC approach, we were able to save 26.23% of the land (1.97 acres) from being sprayed with chemical herbicide compared to the existing method. This study presents a full workflow from UAS image collection to field weed control implementation using a commercial size sprayer, and it shows that some level of savings can potentially be obtained even in a situation with high weed infestation, which might provide an opportunity to reduce chemical usage in corn production systems.
Keywords Remote Sensing Unmanned Aerial Vehicle Weed management site-specific weed management computer vision Drone GIS precision agriculture weed control UAV UAS sensors
1 Introduction
About 1 billion pounds of conventional pesticides are used each year to control undesirable vegetation such as weeds in the agricultural production system of the United States (U.S.), which amount to a cost of almost $9 billion USGS 2017; sow 2022. One of the major reasons for excessive use of chemicals in agriculture is the conventional method of spraying herbicides, often called a blanket application for weed control, which accounts for 59% of the major pesticide expenditures in economic crops in North America Sharma et al. 2019. The blanket application implies spraying herbicide uniformly across the field without considering the spatial distribution of the weeds, which often causes overuse of chemicals.
In addition to being harmful to the environment Fugère et al. 2020; Vieira et al. 2020, chemical herbicides can be harmful to human health as they have been linked to cancerKoutros et al. 2013, attention deficit hyperactivity disorder (ADHD)Polańska et al. 2013, alzheimer’sYan et al. 2016, DNA damage, cardiovascular diseases, neurological disorders, and reproductive disordersKaur and Kaur 2018. Moreover, excessive chemical use in agriculture has the potential to harm nervous system, endocrine system, and reproductive system of humanJakuboski 2011. On the other hand, excessive use of chemicals in agriculture have become one of the major reason for surface and groundwater pollution Srivastav 2020; Zhang et al. 2018; Kumar et al. 2019; Hasan et al. 2019, resulting big threat to the ecosystem and public health. Although organic farming is seen by many as a potential solution for the excessive use of chemicals in agriculture, it is not a silver bullet to meet the United Nations sustainable development goals by 2030 Eyhorn et al. 2019. Therefore, to maintain environmental sustainability and human health, agricultural production systems are in dire need of technologies that can significantly reduce the amount of chemicals currently being used, without compromising crop yields.
An alternative way to neglect chemical use for weed control in agricultural production system is through physically removing weeds by using robotics platforms. Some of the latest automated robots such as the autonomous weed robot by “ecoRobotix” (ecoRobotix, Vaud, Switzerland) and “Deepfield Robotics” (Deepfield Robotics, Renningen, Germany), use ground-based machine vision and image processing techniques to perform site-specific weed control (SSWC) in row crops Steward et al. 2019. However, these robotic solutions are not effective to be deployed in a large commercial agricultural field (hundreds or thousands of acres).
To overcome that issue, some companies have developed and commercialized solutions such as “Weedseeker®” (Trimble agriculture, California, USA), and “WEED-it” (WEED-IT, Steenderen, Netherlands), which use optoelectronic sensors to measure the reflection intensity of vegetation, allowing them to discriminate vegetation from soil background Peteinatos et al. 2014. The shortfall of those products, at the time of this writing, is that they cannot discern weeds from crops early in growing to allow such technologies to be used for weed control. Recently, John Deere (Illinois, USA) launched See & Spray Ultimate®, a sprayer that enables detection and control of weeds during the growing season in corn, soybean, and cotton. More details regarding the field performance of that technology remain to be seen since the sprayers fitted with the system will be available only in 2023joh 2022.
Another approach of performing SSWC is possible through the use of remote sensing technology to accurately map the weed distribution information across a field and integrate that with a spraying platform LÓPEZ-GRANADOS 2011. The main idea here is to spray herbicide only to those areas where weeds are present Jin et al. 2021. To accomplish that, one would need a high-resolution imagery to discern plants growing in the field as weeds and crop. Since the satellite imagery would present some challenges to discern weeds from crops, due to its limitations in providing adequate spatial resolutionHerwitz et al. 2004, the use of UAS with high-resolution cameras seems to be a promising platform, which can be processed and analyzed to obtain an accurate weed distribution map from a field Huang et al. 2018. For that approach to work, is imperative to detect weeds accurately early in the growing season. In most crop weed management programs, weed treatment is recommended at the early growth stages of both crops and weeds. Mapping weeds at that stage can be a challenging task because of four main reasons: 1) weeds are not uniformly distributed across the field, which necessitates working at a single pixel size on the image Mani et al. 2021, 2) crop and weeds have the same or similar reflectance properties, 3) interference of soil background Thorp and Tian 2004, and 4) very small size weeds which are not captured by the sensor’s insufficient camera López-Granados et al. 2016.
One of the earliest studies related to SSWC using UAS Torres-Sánchez et al. 2013 reported about the possibility of the use of UAS imagery and imagery analysis techniques to perform accurate discrimination between weeds and sunflower at early growth stages, which is key to implement any SSWC. More recently, the use of UAS in agriculture for SSWC have become a topic of several publications in specialized literature related to agriculture Mink et al. 2018; Peña et al. 2013; Gao et al. 2018; Sapkota et al. 2020; Rasmussen et al. 2019; Louargant et al. 2018; Zisi et al. 2018; Rasmussen and Nielsen 2020; Jurado-Expósito et al. 2019. Around the same time, more sophisticated and powerful image analysis algorithms, such as machine learning (ML) and deep learning (DL) have being developed and adapted for agricultural applications, and they have gained space as effective ways to process large amounts of data in agriculture Koul 2021; Liakos et al. 2018.
Identification of crop rows in an UAS imagery using ML and DL have become another subject for several recent studies Pang et al. 2020; Varela et al. 2018; Ronchetti et al. 2020; De Castro et al. 2018; Torres-Sánchez et al. 2021; Vong et al. 2021; Bah et al. 2019; Osco et al. 2021; Basso and Pignaton de Freitas 2020; Wang et al. 2021. Although, most of these studies have been able to identify crop rows, and discriminate between weeds and crops during the early stage, however, these all studies are limited to virtual simulations only. Most of these reports regarding the use of UAS imagery for SSWC fall short of providing a real word solution for SSWC, since most of them just report on the capability of different algorithms to separate weeds from crops. Moreover, most of these studies regarding crop row detection, were able to identify the rows as lines with great accuracy Ronchetti et al. 2020; De Castro et al. 2018; Torres-Sánchez et al. 2021; Vong et al. 2021; Bah et al. 2019; Osco et al. 2021; Basso and Pignaton de Freitas 2020; Wang et al. 2021, however, the authors could not provide any insights on how to use those detected crop rows in practical agriculture. Additionally, most of the reports are performed in a small area of agricultural land which would probably raise questions about the research validity in a bigger agricultural area.
Among the row crops grown the United States (US), corn is the primary, largest and most important feed grains, accounting for more than 95% of total feed grain production in the bib 2021. Corn is a major crop for the state of North Dakota (ND), US. In 2020, ND farmers grew corn in 1.5 million hectares of corn in ND bib 2020. Weed competition is a major cause of corn yield losses in ND, and chemical herbicide is the most widely used option for weed control bib 2019.
In order to optimize weed control efficacy, the use of pre- and post-emergence chemical herbicide treatments have been proven to be the most effective weed control strategy Kudsk et al. 2002; Pannacci et al. 2007. At present, most of the farmers apply a blanket application of herbicides for the post-emergence weed control in corn, with no consideration regarding the spatial distribution of weeds across the field. That application often results in an overuse of chemical herbicides. The cost of post-emergence herbicide application (product + application) in ND is usually around $8-12/ha (2020 growing season). If one could use UAS imagery to generate a weed distribution map, to implement SSWC, and apply chemicals to only those areas where weeds are present in the field, that could lead to significant savings on chemicals for corn growers. Using the area grown with corn in 2020 in ND and the cost associated with chemical application, those saving could reach as much as $5.5-7.5 million, with as little as a 10% reduction in applied acreage. In addition to the financial savings, there are environmental savings, which are harder to put a number to it, that can be realized using applying less chemicals to the land.
To our knowledge, this is the first study to report on the whole workflow, from data image collection to weed control in the field, to implement SSWC in corn by integrating UAS imagery with a commercial size sprayer. This study was carried out with two major objectives:
- •
to use UAS imagery to map and quantify post emergent weed infestation in a corn field
- •
to integrate and evaluate that map as a prescription map for site-specific weed control using a commercial size sprayer.
2 Material and methods
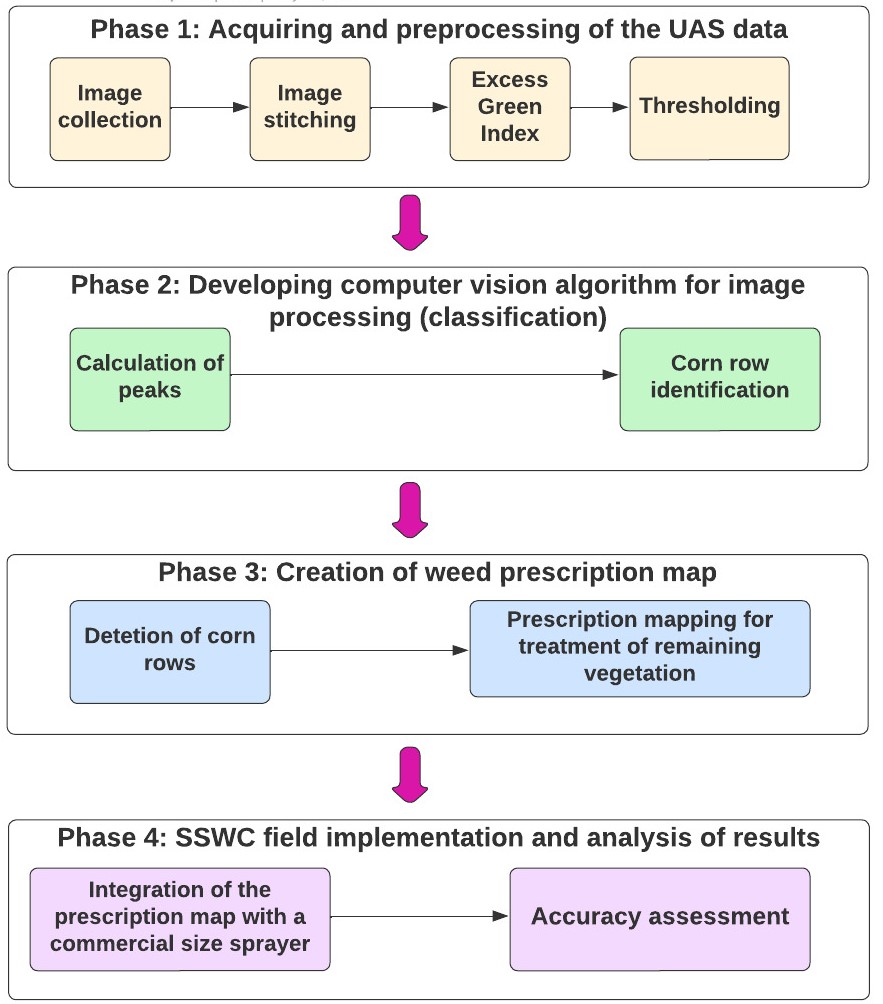
This study can be divided into four phases (Figure 1); (1) acquiring and preprocessing UAS data, (2) develop a computer vision algorithm for corn row classification, (3) weed prescription map creation, and (4) field implementation of the prescription map.
Study site
The study was carried out in a 17 hectares (approximate) corn field, located at Carrington, North Dakota . The experimental land for this study was provided by North Dakota State University (NDSU) Carrington Research Extension Center (REC). According to the data provided by web soil survey (WSS), the soil in the experimental field was composed of heimdall and similar soil (42%) , emrick and similar soil (37%), and minor components 21%. The field was planted with silage corn on May 12, 2021, with a 30-inch row spacing pattern. Prior to planting, on May 7, the field received a pre-emergence herbicide treatment (Verdict BAS 2022, 0.98 kg/ha), which was applied at a rate 140.3 L/ha.
Data collection
The UAS flights for image collection were carried out on June 14, 2021. A DJI Matrice 600 Pro (M600) (figure 2(a)(DJI, Shenzhen, China), outfitted with a Sony Alpha 7R II 42 Megapixel RGB camera (Sony City, Tokyo, Japan) was used to capture the aerial images of the field as shown in figure 2(a). The camera has a 7952 × 5304 pixels (42.4 megapixels) sensor resolution, and a focal length of 35mm. Integration unit for the camera on the drone was made by FieldofView LLC (Fargo, North Dakota, USA), which manufactures a device called GeoSnap PPK 2(b) that allows one to trigger the camera and geotag the images with PPK (postprocess kinematic) accuracy (2cm). Since distance between the research field and nearest CORS (Continuously Operating Reference Stations; Cooperstown, ND) was too far, which would cause a degradation of the geotag accuracy, an iG4 GNSS (Global navigation satellite system) base station (iGage Mapping Corporation, Salt Lake City, USA) (figure 2c) was used to implement the PPK correction to the geotags. The UAS was flown autonomously using flight missions created in Pix4DCapture app (IOS version) (PIX4D, Prilly, Switzerland). Flights were carried out at 350 feet above ground level (AGL), with the camera at nadir position, with 75% overlap both front and side, and the UAS speed was adjusted (by the app) to allow 1.4 seconds interval between pictures. Altogether, three flights were carried to cover the experimental field, collecting a total of 2251 images.
All the data processing in this study was performed in a desktop computer that have Windows 10 Pro, version 20H2, a 64-bit operating system with 132 gigabytes of RAM. The desktop was provided with two switchable GPUs. One was Intel(R) UHD Graphics 630, and the other was NVIDIA GeForce RTX 2080 SUPER.

2.1 Image preprocessing and stitching
In order to generate accurate (2 cm accuracy for latitude and longitude, and twice that for elevation) geotag information for each image, the information collected by the GNSS base station and GeoSnap device were processed using EzSurv software (Effigis, Montreal, Canada), which provided an output as “.csv” file with post-corrected geotag information for each picture. That file was then used during the images stitching process. Images were processed into an orthomosaic (figure 2 d) using image stitching software, Pix4DMapper (Pix4D, Prilly, Switzerland). It took 6 hours and 25 minutes for the software to generate the output as orthomosaic, which had an average ground sample distance (GSD) of 0.63 cm. That orthomosaic served as basis for all the subsequent analyses to implement our SSWC approach. Figure 3 shows the orthomosaic with the experimental units where both the SSWC and conventional (No-SSWC) treatments were applied.
2.2 Field area experimental design
A spatial field experiment area was designed on the orthomosaic to perform both the traditional method which farmers are currently using and our SSWC method. Altogether 3 trial plots of each 487.68m x 136.6m as shown in figure 2(d) were created. Each trial plot was then equally divided into four parts (121.92m x 41.64 m each), making 12 equal plots for the implementation of weed control methods. Among the 12 plots, 6 test plots were replications of our SSWC approach and the remaining 6 test plots were replications of the conventional method or no-SSWC approach. The spatial design for the experiment was created using a geographical information system (GIS) application, ArcGIS Pro (ESRI, California, USA).
Once the two approaches of weed control was applied, the total sprayed area and non-sprayed area for the SSWC replications was accessed through the sprayer’s computer and compared with the no-SSWC replications. The performance of our method was then evaluated based on the land area where chemical herbicide was not sprayed as there was not presence of weeds.
2.3 Vegetation Identification
In order to segment the vegetation fraction from the background on the orthomosaic, excess green index (ExGI) was calculated in ArcGIS Pro, using equation 1.
| (1) |
where r, g, and b are the normalized values of the bands red, green, and blue respectively, and R, G, and B represent the pixel digital number values of the red, green, and blue color bands respectively. Once the ExGI was calculated, a threshold value (0.08) was manually/visually identified and applied to distinguish all green vegetation from the background. That resulted in a binary imagery with pixel intensity value 1 for the vegetation and 0 for the remaining background. The binary image was further processed to identify the corn rows.
2.4 Algorithm development for crop row detection
We are proposing the use of a crop row identification (CRI) algorithm for the detection of corn rows in the binary orthomosaic imagery. In order to expedite the processing time, the CRI algorithm was applied only to the six SSWC treatment plots, which was around 3.05 hectares in area. Figure 3 shows the flow diagram for the CRI algorithm that is being proposed for corn row identification.

Pixel intensity along X-axis (columns) as shown in figure 4 (a) were summed and projected towards Y-axis (rows) in order to compute the local maximums (peaks) in Y-axis as shown in figure 4(b). Once the local maximums were computed for each row, straight lines perpendicular to Y-axis were drawn as shown in figure 4(c). The same process was repeated for all section that was inside the boundary of the SSWC treatment plots.
Once the lines were drawn over the computed local maximums in each row, those lines were visually compared with the original corn rows (ground truth) on the imagery using ArcGIS Pro. Figure 4(d) shows the visual comparison of the generated outputs as true positive(TP), false positive(FP) and false negative(FN). That visual inspection was used to verify the performance of CRI algorithm for accurately identifying the corn rows from the UAS imagery.

2.5 Weed mapping across SSWC treatment plots
Our approach of mapping weeds is quite simple, and that is by design. All the vegetation that growing within a certain distance (buffer) from the identified rows are considered corn plants, and the remaining of the vegetation, growing mainly between the rows, are considered weeds. Hence, once the corn rows were identified, the next step was to identify the vegetation fraction that would be classified as weeds. Our approach was to identify and delete all corn plants from the treatment plots, and the remaining vegetation was then classified as weeds. In order to implement that approach, we created a 3.5 inches buffer on both sides of the corn row lines as shown in figure 5(a). This 3.5-inch buffer was wide enough to cover most of the corn plants, which were then deleted from the imagery, leaving behind the weeds present between the corn rows as shown in figure 5(b). Since the weed pressure in the field was unusually high in the 2021 growing season, in order to implement the full workflow of the proposed approach for SSWC, from image collection to field spraying with a commercial size sprayer, the research team opted to overlay a grid of cells of 1.67 x 10 ft on the imagery. That resulted in an average value of 35% of the cells free of weeds across the SSWC treatment. The decision of spray or no spray on a given cell was based on the presence of weeds in a given grid cell. Grid cells that contained weed were assigned a rate of 140.3 L/ha herbicide mix solution, while the cells free of weeds were assigned at a rate of 0 L/ha, which is no-spray. The idea is that sprayer would just shut-off the nozzles while travelling over the no-spray cells. Figure 5(c) shows the prescription shapefile created in ArcGIS Pro, which was converted to a prescription map in a later step. The red cells among the replications of SSWC treatment were free of weeds whereas the green cells contained weeds.

2.6 Integration of Weed Map into a commercial sprayer
A Case IH Patriot 4440 self-propelled sprayer (Racine, Wisconsin, USA), model year 2021, (figure 6a) was implemented to spray herbicide in this study. The sprayer was provided with an AIM command FLEX system, which was the latest technology from Case IH that enables consistent, flexible, and accurate spray application in commercial agriculture, regardless of speed and terrain. In addition, the system enhances control of liquid product flow and pressure more accurately than conventional rate controller and enables instant on/off of individual nozzles, with a nozzle valve diagnostic system.
The sprayer was set up with a Raven RX1 real time kinematic (RTK) receiver (Raven Technology, Sioux Falls USA), which operates at a frequency of 10Hz. Following Case IH engineer’s advice, the application speed for this study was kept below 11 km/hr (10.5 km/hr actual speed application) to allow for the sprayer to maintain position accuracy resolution of at least one foot per 1/10th of a second or 10 ft per second. That cab computer requires a certain folder structure, so it can read prescription maps (Rx) from an external storage device, such as a thumb drive. AgSMS Advanced software (Ag Leader, Iowa, USA) was used to read the shapefile created in ArcGIS Pro and to convert that file into a prescription map (Rx map) following the format required by the Viper 4+ computer cab. Once the Rx map was brought into the Viper 4+ display, the regions indicated by green color was set to be sprayed with a 56.78 L/ha, which is the same rate that farmers would use for a conventional chemical application.

2.7 Assessing the spraying performance in terms of spray accuracy and chemical savings
Once the spraying operation was completed, an as-applied map was downloaded from the sprayer’s cab computer to compare with the prescription map in terms of spray and no-spray area. The spatial area recorded on the 6-SSWC treatment plots figure 6 (b) of the as-applied map where the sprayer did not spray any chemical herbicide was calculated and compared with the other 6 plots (no-SSWC) where conventional method was applied.
Additionally, application accuracy of the sprayer was evaluated based on it’s ability to perform individual nozzle shut-off over the land where there was no presence of weeds. Based on the sprayed and not sprayed spatial area in the treatment zones between the prescription map and the as-applied map, the sprayer’s performance for chemical saving was evaluated. For that, the total area which was recorded as not-sprayed in the as-applied map was considered as Measured Value, and the total area which was set to be not-sprayed in the prescription map was considered as Expected Value. The accuracy of application in terms of spraying was calculated using equation 2:
| (2) |
2.8 Post-harvest field analysis
In order to investigate the experimental plots in terms of weed growth in a post harvest season, we collected a post harvest imagery on September 21, 2021, where image collection, image stitching, georeferencing, ExGI calculation, segmentation, and thresholding was carried out in a similar way as described for early-stage corn field data collection. The surface area of leftover and newly germinated weeds in the SSWC and conventionally approached test plots in the post harvest imagery was calculated and the datasets were analyzed using SAS PROC MIXED (SAS Institute, Cary, USA) with a mixed procedure using REML (restricted maximum likelihood) estimation. The area covered by weeds in the SSWC test plots was compared to the area of weeds present in six no-SSWC test plots using a pair-wise T-test with a significance level of 0.05 (p = 0.05).
3 Results and discussion
3.1 CRI Algorithm performance for crop row detection
Our simple computer vision algorithm "CRI (corn row identification) algorithm" was able to identify and draw corn rows from UAS imagery with great accuracy. There were 2313 true positive (TP), 12 false positive (FP), 0 true negative (TN), and 8 false negative (FN) values. Overall the CRI algorithm performed well when identifying corn rows based on a UAS imagery over 6.1 hectares land, with metrics: precision (0.9935), recall (0.9965), F1-score (0.9949), and accuracy (0.9901) all above 0.99. The algorithm processing time was 8 seconds using the desktop computer previously described.
Because of the very small size of some corn plants as shown in figure 7 (a), the algorithm failed to identify line over those regions. The row of corn plants that could not be identified in the figure is due to the effect of the threshold value (0.08) that was applied during image segmentation. Use of higher resolution camera that can map even the smallest size of corn plant could possibly solve this issue. Also, in very few regions, we have noticed two lines representing a single corn row as shown in figure 7 (b). This is because the corn rows are not perfectly straight inside the region of 3000 x 2000 pixels, specified in the CRI algorithm. Since the corn row is not straight over the part of image, two small peaks(local maxima) have been identified in this region and hence, the algorithm displayed 2 lines to represent a single corn row. Setting up the smaller region of interest during image processing could possibly solve this issue.

3.2 Application accuracy and chemical savings using our SSWC method
Overall, our study was able to achieve an application accuracy of 78.42% in terms of not-spraying in the regions where there was no presence of weeds. Figure 8 shows the no-spray land distribution information that was designed and implemented for 6 SSWC treatment plots. During the field implementation of this approach through a commercial-size sprayer, the overlap between individual nozzles could be a reason why the application accuracy is not much higher. Although the spray nozzle footprint covers the space between the nozzles (0.5 m), it is likely that the application rate towards the middle of the spraying pattern is higher than on its edges.

Likewise, our approach for SSWC achieved significant chemical savings. Using the prescription map to turn off the sprayer’s nozzles on the grids cells free of weed resulted in savings of 26% of the area to be sprayed. Our method saved 7919.6 out of 30457 land from being sprayed with the chemical herbicide. Figure 9 shows the consumption of chemicals on the basis of land area using our SSWC approach and the conventional or no-SSWC approach. Although the weed pressure at the season we performed this study was unusually high, the study proved that it is possible to spray chemicals only to the necessary part of the field. Since the conventional method that applies chemicals uniformly across the field would spray chemicals in the 7919.6 land inside SSWC while our approach did not spray any chemical in that area, therefore our study was able to save around 26% of chemical herbicide in the six SSWC treatment plots compared to the existing conventional method. Our approach minimized the chemical usage to this value in a practical agricultural environment of corn production system in agriculture.

Because of the significant reduction of chemical usage, our approach of spraying chemical herbicide only to those area where there is presence of weed could be a helpful practice in making this environmental ecosystem less disturbed from being attacked with agro-chemicals. Since 75% of all planted acres of cropland across the US are row crops, the approach we adopted in this study could be a foundational study for performing SSWC in the vast majority of US row crops. On the other hand, our approach made a financial savings on that 26% reduced chemical. Moreover, the reduction of land area for spraying herbicides directly reduces the amount of water usage, therefore, our approach also made significant saving(approximately 26%) in the water usage for chemical spray application.
Although some leading agricultural machinery manufacturing companies such as John Deere and CNH Industrials have announced about their future release of an automated sprayer which could perform site-specific application in some crops including corn, the technology upon successful release would be adopted by few farmers only because it is not that easy for all farmers to switch into newer technology due to the expensive cost of agricultural spray machines. However, farmers could easily use our approach with the existing variable rate sprayers in the market that could read the prescription maps.
In a post harvest imagery based field evaluation of the SSWC and no-SSWC treatments plots, we found that the treatment regions were significantly different in terms of weed presence . The amount of weeds present in SSWC treatment plots in terms of surface area was 3.4 times higher than the amount of weeds that were present in no-SSWC plots. The findings from this study could be a foundation to pursue various research questions that our study could not address, because of time and other limiting factors. Although the imagery obtained from the field had high resolution (GSD= 0.63 cm per pixel), we might have missed smaller weeds than the camera resolution during the data collection of the early growing season. Those weed detection skips might be one of the reasons why we observed weeds in the SSWC plots after the corn harvest. One could argue that image resolution should be increased to avoid those skips, but there are other challenges to achieve that, such as cost of better hardware (UASs and sensors), time to collect data (by flying lower with the same equipment used on this study), and time to process the data (lower altitude flight would lead to many more pictures captured, which increases processing time). The reasons to why the SSWC had more weeds than no-SSWC could likely be a combination of factors: 1) weeds were sprayed too late (rate not adequate to the size of the weeds); 2) lack of overlap when individual nozzles were applying chemical (applying even less chemical to the already too big/tall weeds); and 3) missing small weeds that germinated after we mapped the area.
4 Conclusion and future suggestions
According to the result achieved in this study regarding chemical savings, our approach of fusing UAS data with spraying platform have the potential to minimize chemical consumption in weed control application in the agricultural production system of the US corn. Additionally, our SSWC approach have the potential to reduce financial expenditure that farmers are currently investing in chemicals to apply conventional approach or no-SSWC approach in corn production. On the other hand, production of corn using our approach appear to be more healthy than the corn being produced through conventional weed control approach because everyone would love to consume corn that is being produced by using less chemicals.
The approach proposed in this study regarding identifying corn rows and removing them from the UAS imagery showed to be an effective way to map the weeds during the early growing season of corn. However, this study was performed through human intervention for weed mapping which would take around a day to collect and process data for making a weed prescription map. Although we have beaten the state-of-the art and achieved some strong milestones in the investigations that have been performed for site-specific weed management implementation using UAS platform, to make our SSWC approach consumer grade in commercial agricultural production system, our future suggestions are:
- •
Automating real time prescription map generation from the information collected using UAS could reduce the data collection and processing time. For that, use of embedded platforms to integrate UAS data with sprayer platform could be a field to explore in the near future.
- •
The overlap between individual nozzles of the sprayer should be set in a way that the spray-pattern covers the entire region set in the prescription map.
- •
Since the sprayer was operated at lower speed(11.5 km/hr approximate) than the normal practice(19 km/hr approximate), in commercial farming, approximate speed of because of the GPS refreshing capability of the the sprayer. Upon improvement of the sprayer’s GPS refreshing rate, the application could be improved to operate at higher speed.
5 Acknowledgements and Funding
The authors would like to acknowledge Richard Richter and Chad Richter for operating the commercial sprayer during field implementation of this study. The project was funded by North Dakota Corn Council (NDCC).
Author contributions statement
Investigation, conceptualization, formal analysis, data analysis, writing and editing: Ranjan Sapkota, Paulo Flores; Data analysis, reviewing: John Stenger, Michael Ostlie
References
- USGS [2017] USGS. IHundreds of millions of pounds of pesticides are applied to agricultural crops every year to control weeds, insect infestations, plant diseases, and other pests., 03 2017. URL hhttps://www.usgs.gov/centers/ohio-kentucky-indiana-water-science-center/science/pesticides.
- sow [2022] 2021 pesticides in the pantry: Transparency & risk in food supply chains. https://www.asyousow.org/reports/2021-pesticides-pantry, 2022.
- Sharma et al. [2019] Anket Sharma, Vinod Kumar, Babar Shahzad, Mohsin Tanveer, Gagan Preet Singh Sidhu, Neha Handa, Sukhmeen Kaur Kohli, Poonam Yadav, Aditi Shreeya Bali, Ripu Daman Parihar, et al. Worldwide pesticide usage and its impacts on ecosystem. SN Applied Sciences, 1(11):1–16, 2019.
- Fugère et al. [2020] Vincent Fugère, Marie-Pier Hébert, Naila Barbosa Da Costa, Charles CY Xu, Rowan DH Barrett, Beatrix E Beisner, Graham Bell, Gregor F Fussmann, B Jesse Shapiro, Viviane Yargeau, et al. Community rescue in experimental phytoplankton communities facing severe herbicide pollution. Nature Ecology & Evolution, 4(4):578–588, 2020.
- Vieira et al. [2020] Bruno C Vieira, Joe D Luck, Keenan L Amundsen, Rodrigo Werle, Todd A Gaines, and Greg R Kruger. Herbicide drift exposure leads to reduced herbicide sensitivity in amaranthus spp. Scientific reports, 10(1):1–11, 2020.
- Koutros et al. [2013] Stella Koutros, Laura E Beane Freeman, Jay H Lubin, Sonya L Heltshe, Gabriella Andreotti, Kathryn Hughes Barry, Curt T DellaValle, Jane A Hoppin, Dale P Sandler, Charles F Lynch, et al. Risk of total and aggressive prostate cancer and pesticide use in the agricultural health study. American journal of epidemiology, 177(1):59–74, 2013.
- Polańska et al. [2013] Kinga Polańska, Joanna Jurewicz, and Wojciech Hanke. Review of current evidence on the impact of pesticides, polychlorinated biphenyls and selected metals on attention deficit/hyperactivity disorder in children. International journal of occupational medicine and environmental health, 26(1):16–38, 2013.
- Yan et al. [2016] Dandan Yan, Yunjian Zhang, Liegang Liu, and Hong Yan. Pesticide exposure and risk of alzheimer’s disease: a systematic review and meta-analysis. Scientific reports, 6(1):1–9, 2016.
- Kaur and Kaur [2018] Karashdeep Kaur and Rupinder Kaur. Occupational pesticide exposure, impaired dna repair, and diseases. Indian journal of occupational and environmental medicine, 22(2):74, 2018.
- Jakuboski [2011] Samantha Jakuboski. The Dangers of Pesticides | Green Science | Learn Science at Scitable, 07 2011. URL https://www.nature.com/scitable/blog/green-science/the_dangers_of_pesticides/?error=cookies_not_supported&code=5667e842-1909-4928-89ce-556be39ba7c3.
- Srivastav [2020] Arun Lal Srivastav. Chemical fertilizers and pesticides: role in groundwater contamination. In Agrochemicals detection, treatment and remediation, pages 143–159. Elsevier, 2020.
- Zhang et al. [2018] Lu Zhang, Chengxi Yan, Qing Guo, Junbiao Zhang, and Jorge Ruiz-Menjivar. The impact of agricultural chemical inputs on environment: global evidence from informetrics analysis and visualization. International Journal of low-Carbon technologies, 13(4):338–352, 2018.
- Kumar et al. [2019] Randeep Kumar, Ravendra Kumar, and Om Prakash. Chapter-5 the impact of chemical fertilizers on our environment and ecosystem. Chief Ed, 35:69, 2019.
- Hasan et al. [2019] Md Khalid Hasan, Abrar Shahriar, and Kudrat Ullah Jim. Water pollution in bangladesh and its impact on public health. Heliyon, 5(8):e02145, 2019.
- Eyhorn et al. [2019] Frank Eyhorn, Adrian Muller, John P Reganold, Emile Frison, Hans R Herren, Louise Luttikholt, Alexander Mueller, Jürn Sanders, Nadia El-Hage Scialabba, Verena Seufert, et al. Sustainability in global agriculture driven by organic farming. Nature Sustainability, 2(4):253–255, 2019.
- Steward et al. [2019] Brian L Steward, Jingyao Gai, and Lie Tang. The use of agricultural robots in weed management and control. Robotics and automation for improving agriculture, 44:1–25, 2019.
- Peteinatos et al. [2014] Gerassimos G Peteinatos, Martin Weis, Dionisio Andújar, Victor Rueda Ayala, and Roland Gerhards. Potential use of ground-based sensor technologies for weed detection. Pest management science, 70(2):190–199, 2014.
- joh [2022] See & spray™ ultimate targeted, in-crop spraying. https://www.deere.com/en/sprayers/see-spray-ultimate, 2022.
- LÓPEZ-GRANADOS [2011] Francisca LÓPEZ-GRANADOS. Weed detection for site-specific weed management: mapping and real-time approaches. Weed Research, 51(1):1–11, 2011.
- Jin et al. [2021] Xiaojun Jin, Jun Che, and Yong Chen. Weed identification using deep learning and image processing in vegetable plantation. IEEE Access, 9:10940–10950, 2021.
- Herwitz et al. [2004] SR Herwitz, LF Johnson, SE Dunagan, RG Higgins, DV Sullivan, J Zheng, BM Lobitz, JG Leung, BA Gallmeyer, M Aoyagi, et al. Imaging from an unmanned aerial vehicle: agricultural surveillance and decision support. Computers and electronics in agriculture, 44(1):49–61, 2004.
- Huang et al. [2018] Huasheng Huang, Jizhong Deng, Yubin Lan, Aqing Yang, Xiaoling Deng, and Lei Zhang. A fully convolutional network for weed mapping of unmanned aerial vehicle (uav) imagery. PloS one, 13(4):e0196302, 2018.
- Mani et al. [2021] Pabitra Kumar Mani, Agniva Mandal, Saikat Biswas, Buddhadev Sarkar, Tarik Mitran, and Ram Swaroop Meena. Remote sensing and geographic information system: a tool for precision farming. In Geospatial Technologies for Crops and Soils, pages 49–111. Springer, 2021.
- Thorp and Tian [2004] KR Thorp and LF Tian. A review on remote sensing of weeds in agriculture. Precision Agriculture, 5(5):477–508, 2004.
- López-Granados et al. [2016] Francisca López-Granados, Jorge Torres-Sánchez, Angélica Serrano-Pérez, Ana I de Castro, Fco Mesas-Carrascosa, José-Manuel Pena, et al. Early season weed mapping in sunflower using uav technology: variability of herbicide treatment maps against weed thresholds. Precision Agriculture, 17(2):183–199, 2016.
- Torres-Sánchez et al. [2013] Jorge Torres-Sánchez, Francisca López-Granados, Ana Isabel De Castro, and José Manuel Peña-Barragán. Configuration and specifications of an unmanned aerial vehicle (uav) for early site specific weed management. PloS one, 8(3):e58210, 2013.
- Mink et al. [2018] Robin Mink, Avishek Dutta, Gerassimos G Peteinatos, Markus Sökefeld, Johannes Joachim Engels, Michael Hahn, and Roland Gerhards. Multi-temporal site-specific weed control of cirsium arvense (l.) scop. and rumex crispus l. in maize and sugar beet using unmanned aerial vehicle based mapping. Agriculture, 8(5):65, 2018.
- Peña et al. [2013] José Manuel Peña, Jorge Torres-Sánchez, Ana Isabel de Castro, Maggi Kelly, and Francisca López-Granados. Weed mapping in early-season maize fields using object-based analysis of unmanned aerial vehicle (uav) images. PloS one, 8(10):e77151, 2013.
- Gao et al. [2018] Junfeng Gao, Wenzhi Liao, David Nuyttens, Peter Lootens, Jürgen Vangeyte, Aleksandra Pižurica, Yong He, and Jan G Pieters. Fusion of pixel and object-based features for weed mapping using unmanned aerial vehicle imagery. International journal of applied earth observation and geoinformation, 67:43–53, 2018.
- Sapkota et al. [2020] Bishwa Sapkota, Vijay Singh, Dale Cope, John Valasek, and Muthukumar Bagavathiannan. Mapping and estimating weeds in cotton using unmanned aerial systems-borne imagery. AgriEngineering, 2(2):24, 2020.
- Rasmussen et al. [2019] J Rasmussen, J Nielsen, JC Streibig, JE Jensen, KS Pedersen, and SI Olsen. Pre-harvest weed mapping of cirsium arvense in wheat and barley with off-the-shelf uavs. Precision Agriculture, 20(5):983–999, 2019.
- Louargant et al. [2018] Marine Louargant, Gawain Jones, Romain Faroux, Jean-Noël Paoli, Thibault Maillot, Christelle Gée, and Sylvain Villette. Unsupervised classification algorithm for early weed detection in row-crops by combining spatial and spectral information. Remote Sensing, 10(5):761, 2018.
- Zisi et al. [2018] Theodota Zisi, Thomas K Alexandridis, Spyridon Kaplanis, Ioannis Navrozidis, Afroditi-Alexandra Tamouridou, Anastasia Lagopodi, Dimitrios Moshou, and Vasilios Polychronos. Incorporating surface elevation information in uav multispectral images for mapping weed patches. Journal of Imaging, 4(11):132, 2018.
- Rasmussen and Nielsen [2020] J Rasmussen and J Nielsen. A novel approach to estimating the competitive ability of cirsium arvense in cereals using unmanned aerial vehicle imagery. Weed research, 60(2):150–160, 2020.
- Jurado-Expósito et al. [2019] Montserrat Jurado-Expósito, Ana Isabel de Castro, Jorge Torres-Sánchez, Francisco Manuel Jiménez-Brenes, and Francisca López-Granados. Papaver rhoeas l. mapping with cokriging using uav imagery. Precision Agriculture, 20(5):1045–1067, 2019.
- Koul [2021] Sumit Koul. Machine learning and deep learning in agriculture. In Smart Agriculture: Emerging Pedagogies of Deep Learning, Machine Learning and Internet of Things, pages 1–19. CRC Press, 2021.
- Liakos et al. [2018] Konstantinos G Liakos, Patrizia Busato, Dimitrios Moshou, Simon Pearson, and Dionysis Bochtis. Machine learning in agriculture: A review. Sensors, 18(8):2674, 2018.
- Pang et al. [2020] Yan Pang, Yeyin Shi, Shancheng Gao, Feng Jiang, Arun-Narenthiran Veeranampalayam-Sivakumar, Laura Thompson, Joe Luck, and Chao Liu. Improved crop row detection with deep neural network for early-season maize stand count in uav imagery. Computers and Electronics in Agriculture, 178:105766, 2020.
- Varela et al. [2018] Sebastian Varela, Pruthvidhar Reddy Dhodda, William H Hsu, PV Vara Prasad, Yared Assefa, Nahuel R Peralta, Terry Griffin, Ajay Sharda, Allison Ferguson, and Ignacio A Ciampitti. Early-season stand count determination in corn via integration of imagery from unmanned aerial systems (uas) and supervised learning techniques. Remote Sensing, 10(2):343, 2018.
- Ronchetti et al. [2020] Giulia Ronchetti, Alice Mayer, Arianna Facchi, Bianca Ortuani, and Giovanna Sona. Crop row detection through uav surveys to optimize on-farm irrigation management. Remote Sensing, 12(12):1967, 2020.
- De Castro et al. [2018] Ana I De Castro, Jorge Torres-Sánchez, Jose M Peña, Francisco M Jiménez-Brenes, Ovidiu Csillik, and Francisca López-Granados. An automatic random forest-obia algorithm for early weed mapping between and within crop rows using uav imagery. Remote Sensing, 10(2):285, 2018.
- Torres-Sánchez et al. [2021] Jorge Torres-Sánchez, Francisco Javier Mesas-Carrascosa, Francisco M Jiménez-Brenes, Ana I de Castro, and Francisca López-Granados. Early detection of broad-leaved and grass weeds in wide row crops using artificial neural networks and uav imagery. Agronomy, 11(4):749, 2021.
- Vong et al. [2021] Chin Nee Vong, Lance S Conway, Jianfeng Zhou, Newell R Kitchen, and Kenneth A Sudduth. Early corn stand count of different cropping systems using uav-imagery and deep learning. Computers and Electronics in Agriculture, 186:106214, 2021.
- Bah et al. [2019] Mamadou Dian Bah, Adel Hafiane, and Raphael Canals. Crownet: Deep network for crop row detection in uav images. IEEE Access, 8:5189–5200, 2019.
- Osco et al. [2021] Lucas Prado Osco, Mauro dos Santos de Arruda, Diogo Nunes Gonçalves, Alexandre Dias, Juliana Batistoti, Mauricio de Souza, Felipe David Georges Gomes, Ana Paula Marques Ramos, Lúcio André de Castro Jorge, Veraldo Liesenberg, et al. A cnn approach to simultaneously count plants and detect plantation-rows from uav imagery. ISPRS Journal of Photogrammetry and Remote Sensing, 174:1–17, 2021.
- Basso and Pignaton de Freitas [2020] Maik Basso and Edison Pignaton de Freitas. A uav guidance system using crop row detection and line follower algorithms. Journal of Intelligent & Robotic Systems, 97(3):605–621, 2020.
- Wang et al. [2021] Le Wang, Lirong Xiang, Lie Tang, and Huanyu Jiang. A convolutional neural network-based method for corn stand counting in the field. Sensors, 21(2):507, 2021.
- bib [2021] Feedgrains sector at a glance. https://www.ers.usda.gov/topics/crops/corn-and-other-feedgrains/feedgrains-sector-at-a-glance/, 2021.
- bib [2020] 2020 state agriculture overview. https://www.nass.usda.gov/Quick_Stats/Ag_Overview/stateOverview.php?state, 2020.
- bib [2019] Basics of corn production in north dakota. https://www.ag.ndsu.edu/publications/crops/basics-of-corn-production-in-north-dakota, 2019.
- Kudsk et al. [2002] Per Kudsk et al. Optimising herbicide performance. Weed management handbook, 9:323–344, 2002.
- Pannacci et al. [2007] E Pannacci, F Graziani, and G Covarelli. Use of herbicide mixtures for pre and post-emergence weed control in sunflower (helianthus annuus). Crop Protection, 26(8):1150–1157, 2007.
- BAS [2022] Farming & crop protection herbicides. https://agriculture.basf.us/crop-protection/products/herbicides/verdict.html, 2022.