A Multiwavelength Study of Active Galactic Nuclei in Post-Merger RemnantsJournal: ApJ
Abstract
We investigate the role of galaxy mergers in triggering active galactic nuclei (AGN) in the nearby universe. Our analysis is based on a sample of 79 post-merger remnant galaxies with deep X-ray observations from Chandra/XMM-Newton capable of detecting a low-luminosity AGN of erg s-1. This sample is derived from a visually classified, volume-limited sample of 807 post-mergers identified in the Sloan Digital Sky Survey Data Release 14 with log M∗/M and z. We find that the X-ray AGN fraction in this sample is compared to for a mass- and redshift-matched noninteracting control sample. The multiwavelength AGN fraction (identified as an AGN in one of X-ray, IR, radio or optical diagnostics) for post-mergers is compared to for controls. Thus post-mergers exhibit a high overall AGN fraction with an excess between 2 - 4 depending on the AGN diagnostics used. In addition, we find most optical, IR, and radio AGN are also identified as X-ray AGN while a large fraction of X-ray AGN are not identified in any other diagnostic. This highlights the importance of deep X-ray imaging to identify AGN. We find that the X-ray AGN fraction of post-mergers is independent of the stellar mass above log M∗/M unlike the trend seen in control galaxies. Overall, our results show that post-merger galaxies are a good tracer of the merger–AGN connection and strongly support the theoretical expectations that mergers trigger AGN.
Keywords:
Galaxy evolution — Galaxy interactions — Galaxy mergers — Active galactic nucleiI Introduction
It is well known that most massive galaxies host a supermassive black hole (SMBH) in their centers (Gebhardt et al. 2000; Hickox et al. 2009; McConnell et al. 2012; Kormendy & Ho 2013). When material is accreted onto a SMBH, it triggers an active galactic nucleus (AGN), which can ionize the gas and/or push gas out of the galaxy (i.e., AGN “feedback”) stopping star-formation. AGN are expected to play a role in regulating the star formation and mass growth of galaxies (Bower et al. 2006; Croton et al. 2006; Hopkins et al. 2008; Schaye et al. 2015; Pillepich et al. 2019).
Theoretically, mergers of galaxies are expected to trigger AGN (Hopkins et al. 2005; Springel et al. 2005; Somerville et al. 2008; Choi et al. 2012; Steinborn et al. 2018). The current simplest picture of how bulge-dominated/elliptical galaxies form is: (1) Gas rich, star-forming galaxies merge triggering gas inflows and enhanced star formation in the center. These systems may be observed as (ultra)luminous infrared galaxies (LIRGS). (2) Optical/IR quasars with high Eddington ratios are triggered when gas is accreted onto the SMBHs. (3) The AGN or stellar-driven winds quench star formation by heating and expelling gas, creating post-merger remnants (or bulge-dominated galaxies) with colors that span a range from the blue cloud to the red sequence on the color magnitude diagram. AGN activity declines in this phase until finally (4) a red and dead spheroid is formed, which may exhibit intermittent radio AGN activity (Hickox et al. 2009).
Unfortunately, observational support for this scenario is in dispute with some studies finding strong support for mergers triggering AGN while others find no evidence. Numerous studies have found a higher optical/mid-IR AGN fraction in galaxy mergers compared to noninteracting galaxies in the local universe. For example, Ellison et al. 2011 found an optical AGN enhancement of 2.5 times in Sloan Digital Sky Survey (SDSS) very close pairs (10 kpc) at compared to isolated control galaxies. They also found an increasing optical AGN fraction with decreasing projected separation. Many other low-redshift () studies with similar approaches have also found that AGN are more likely to appear in galaxy mergers than isolated galaxies both in the optical (Keel et al. 1985; Alonso et al. 2007; Woods & Geller 2007; Ellison et al. 2013) and in the mid-IR (Satyapal et al. 2014; Weston et al. 2017; Goulding et al. 2018; Gao et al. 2020). This suggests a connection between AGN and mergers.
Comparatively few studies have probed the X-ray AGN fraction in mergers relative to isolated galaxies in the nearby universe. The recent study presented by Secrest et al. 2020 found no statistically significant enhancement of X-ray-selected AGN with L 1041.5 erg s-1 in SDSS post-merger galaxies relative to noninteracting galaxies at . However, they did find an enhancement of mid-IR AGN for the same sample with an AGN excess when compared to a noninteracting control sample.
X-ray studies at higher redshifts provide conflicting results. Silverman et al. 2011 have found an excess of X-ray AGN with L 1042 erg s-1 in kinematic close pairs compared to isolated galaxies at . A similar X-ray AGN excess in similar luminosity range (L 1042 erg s-1) was also found in late-stage mergers relative to isolated galaxies by Lackner et al. 2014 at . However, Shah et al. 2020 found a lack of enhancement of X-ray AGN with L 1042 erg s-1 in galaxy pairs at from the Cosmological Evolution Survey and the Cosmic Assembly Near-infrared Deep Extragalactic Legacy Survey.
An alternate approach is to look at the merger frequency in AGN host galaxies compared to non-AGN host galaxies. Ellison et al. 2019 have found an interacting fraction in both optical-selected and mid-IR-selected AGN host galaxies, which is a factor of 2 higher than that in non-AGN control galaxies. Their results strongly suggest that AGN are related to galaxy mergers. Similar results were also found in studies of optical AGN host galaxies at (Bennert et al. 2008; Letawe et al. 2010; Bessiere et al. 2012; Hong et al. 2015) and mid-IR AGN at (Urrutia et al. 2008), suggesting a merger–AGN connection.
Studies of the merger rate in X-ray-selected AGN host galaxies provide conflicting results. Koss et al. 2010 have found a high merger rate (18% vs 1%) in the Swift Burst Alert Telescope AGN sample (L 1042 erg s-1) compared to non-AGN host galaxies at , suggesting mergers are the dominant mechanism triggering luminous AGN. Studies of X-ray-selected and optical-selected luminous AGN (L 1042 erg s-1) also found a higher merger rate compared to non-AGN host galaxies at (Koss et al. 2012; Cotini et al. 2013). On the contrary, Gabor et al. 2009 analyzed the morphology of X-ray-selected AGN host galaxies with L 1042 erg s-1 at and found no difference between the asymmetry of AGN host galaxies and non-AGN control galaxies. Numerous similar studies of the morphology of X-ray luminous AGN host galaxies (L 1042 erg s-1) have not found strong levels of merger signatures at (Grogin et al. 2005; Cisternas et al. 2011; Cisternas et al. 2013; Villforth et al. 2014; Ellison et al. 2019) and at higher redshifts (Kocevski et al. 2012), which suggest that mergers are not the primary mechanism triggering AGN.


There are many potential causes for these discrepant results. According to simulations, AGN luminosities and lifetimes are variable at different merger stages. AGN in mergers are in a lower-luminosity phase ( erg s-1) for a longer duration ( Gyr, Hopkins et al. 2008; Blecha et al. 2018) compared to the luminous AGN phase ( erg s-1) of Myr (Conselice 2006; Martini 2004; Hopkins & Hernquist 2009). Therefore, studies that do not probe low-luminosity AGN (LLAGN) cannot provide a complete census of the merger-triggered AGN population. The sporadic nature of the luminous AGN phase will also naturally lead to an underestimate in the fraction of mergers that have experienced an AGN. Most previous studies have mainly focused on the luminous AGN phase. Many have relied on single-wave-band AGN diagnostics (such as optical, X-ray, or IR) which provide an incomplete census of AGN. For example, optical AGN diagnostics can suffer from significant contamination. As galaxy mergers can trigger both star formation and AGN, the emission from faint AGN can be overpowered by star formation. In addition, the source of Low-Ionization Nuclear Emission-line Regions (LINERs) and composite emission is also uncertain. X-ray AGN emission can also be contaminated by emission from X-ray binaries or hot gas. Dust obscuration can also lead to an underestimate of the AGN fraction. Lastly, many previous works have relied on incomplete/impure samples of mergers at a range of merger stages, which can obfuscate correlations between mergers and AGN.
To probe the merger–AGN connection, we need to identify LLAGN in a merger stage where the lifetimes of the merger signatures are comparable to the LLAGN lifetimes. Post-merger galaxies are the ideal sample to investigate this correlation. They are the end products of major mergers observed during or after coalescence, from just before the ultraluminous infrared galaxy (ULIRG) phase through to the remnant phase when the AGN fades and shells and tidal tails are apparent (see Figure 1). These tidal structures have lifetimes comparable to the lifetimes of LLAGN ( 1 Gyr, Barnes 1992; Conselice 2006; Lotz et al. 2008; Ji et al. 2014). Hence, they are the ideal targets to look for LLAGN.
Unfortunately, identifying AGN in post-merger systems using optical diagnostics (i.e., Baldwin–Phillips–Telervich (BPT) diagrams, Baldwin et al. 1981) alone is challenging. While LINER- and composite-like emission ratios can be caused by AGN, they can also be produced by post-AGB stars or shocks (Singh et al. 2013; Davies et al. 2017). As post-merger galaxies are shocked systems, they exhibit LINER-like emission line ratios and cannot be confirmed as AGN by optical diagnostics alone. Therefore, multiwavelength diagnostics are required in order to confirm their AGN nature.
In this paper, we use these different selection techniques to identify AGN in our post-merger galaxies, which should enable a more comprehensive study of the merger–AGN connection. This paper is arranged as follows. In Section 2, we describe our high-mass post-merger subsample, the available multiwavelength data, and the analysis techniques we used for reducing X-ray observations. In Section 3, we describe the results of the multiwavelength AGN fraction in high-mass post-merger galaxies and control galaxies. In Section 4, we compare our results to previous studies and explain the reasons of the discrepancy. In Section 5, we summarize the main conclusions in this work.
II Sample and Analysis Techniques
II.1 High-mass Post-merger Subsample
The post-merger sample is derived from a parent catalog of 113,693 galaxies with 0.02 z 0.06 and 9 log M∗/M 12 from the SDSS Data Release 14 (York et al. 2000) main sample. Nair (2023, in preparation; hereafter N23) visually classified the SDSS images of this 113k sample following the prescription described in Nair & Abraham 2010 to identify bars, rings, spiral arms, interacting galaxies, close pairs, dual nuclei, merger remnants, etc. N23 identifies 1,200 post-merger remnant galaxies. The work of this paper focuses on the high-mass (log M∗/M 10.5) subsample of 807 post-merger galaxies. Example images of post-merger galaxies are shown in Figure 1.
To investigate the X-ray AGN nature of post-merger galaxies, we used new, deep, Chandra observations (proposal ID: 19700403 by PI Nair) for a sample of 12 objects. Eleven of these objects are in our high-mass subsample. The observations were designed to be deep enough to detect a source down to luminosity of erg s-1, a threshold chosen as the luminosity from contaminants such as X-ray binaries (XRBs), which are expected to be lower than this threshold for our sample (see Section 3). To complement data in the archive, the sample was chosen to not be Seyfert galaxies as classified by the [O III]/H vs [N II]/H optical BPT diagnostic using the Kewley et al. 2001 and Schawinski et al. 2007 demarcation lines and to have z0.04 to keep exposure times reasonable per target.
We crossmatched our high-mass (log M∗/M 10.5) post-merger sample with the Chandra and XMM-Newton archive. Given the large imaging field, we used a search radius of in Chandra and in XMM-Newton observations to allow a search for both targeted and serendipitous observations for our galaxies. We also restricted our matches to be within of the focal point (off-axis angle) of Chandra observations and of the XMM-Newton observations to allow robust point-spread function (PSF) corrections. There are 36 post-mergers that were observed in Chandra, and 47 were observed in XMM. We also crossmatched the post-merger sample with the CSC 2.0 catalog (Evans et al. 2010) and the 4XMM-DR11 source catalog (Webb et al. 2020) to ensure no X-ray source is missed. For each observation, we calculated the detection limit in photon counts by using the Poisson upper limit for (assumed) zero background count (Gehrels 1986). We converted the detection limit from counts to fluxes and luminosities using the WebPIMMS11 1 https://heasarc.gsfc.nasa.gov/cgi-bin/Tools/w3pimms/w3pimms.pl by assuming a simple power-law model with and Galactic absorption assuming the HI4PI survey map (HI4PI Collaboration et al. 2016).
In order to search for the very faint AGN, we further selected observations that were deep enough to detect a source with L erg s-1. (Very few of the archived sources had detection limits down to erg s-1). There are 26 Chandra-observed sources and 41 XMM-observed sources that satisfy this detection threshold. An additional Chandra post-merger galaxy has shallower Chandra observations but has a point-source detection. Hence, we still included it in our sample. Of the 27 Chandra-observed post-mergers, 12 were serendipitously observed in the field of view while the remaining 15 were targeted X-ray observations. Of the 15, 10 were targeted because they were AGN preselected in either hard X-ray, radio, IR, or optical. The remaining 5 were targeted for other reasons not directly related to their potential AGN nature. For the 41 XMM-observed sources, 28 were serendipitously observed while the other 13 post-mergers were targeted. Of the 13, 10 were targeted because they were preselected as AGN in other wavebands. This yields a sample of 38 Chandra-observed galaxies and 41 unique XMM-observed galaxies. In total, there are 79 high-mass post-merger galaxies with deep observations or a source detection in either Chandra or XMM. A summary of the targets is shown in Table 1 for Chandra data and Table 2 for XMM, which also include details on the X-ray observations. The serendipitously observed galaxies are marked with a following the SDSS object ID. Galaxies with b marked in Table 1 are the (non-Seyfert) post-mergers observed as part of our Chandra proposal.
Optical data for the 79 post-mergers are available from the value-added catalog compiled by the Max Planck Institute for Astrophysics and the John Hopkins University (MPA-JHU, Brinchmann et al. 2004; Kauffmann et al. 2003a; Tremonti et al. 2004). The MPA-JHU catalog contains optical emission line fluxes, equivalent widths measurements, and spectral indexes from SDSS single-fiber spectra, which are used to identify AGN in this work. This catalog also provides derived stellar masses and star formation rate (SFR) measured within the 3 SDSS fiber (fiber value) and those measured for the entire galaxy (total value).
We crossmatched these 79 X-ray-observed post-mergers with value-added catalogs from infrared and radio. Infrared measurements were obtained by crossmatching with the All-sky Wide-field Infrared Survey Explorer (ALLWISE) catalog (Cutri & et al. 2014), which contains photometric measurements for over 700,000,000 objects detected in the all-sky imaging of the Wide-field Infrared Survey Explorer (WISE; Wright et al. 2010). This catalog provides magnitudes measured with profile-fitting photometry in four different filters centered at 3.4, 4.6, 12, and 22 m (denoted as W1, W2, W3, and W4). By using a search radius of , we found counterparts for all 79 post-mergers. Radio data were obtained from the Very Large Array (VLA) Faint Images of the Radio Sky at Twenty cm (FIRST) catalog (Becker et al. 1994), which contains radio flux densities for sources detected by the VLA over 10,000 square degrees of the north and south sky in the FIRST (Becker et al. 1995)) survey. Using a search radius of , 77 out of these 79 post-mergers had counterparts in the VLA FIRST catalog. The remaining two galaxies do not have FIRST radio observation and are excluded from the multiwavelength AGN analysis.
In summary, out of 79 high-mass X-ray observed post-mergers, 77 have multiwavelength observations in all four wavebands: optical, X-ray, infrared, and radio band. We will discuss AGN identification in Section 3.
| SDSS ObjID | R.A. | Dec. | z | log | ObsID | Exp. | Sep. | log | log | log | BPT | |
|---|---|---|---|---|---|---|---|---|---|---|---|---|
| J2000 | J2000 | ksec | arcmin | |||||||||
| 1237651272966275163 | 143.96 | 61.35 | 0.039 | 10.9 | 2033 | 49.3 | 0.59 | 0.44 | 41.6 | 39.9 | 39.4 | L |
| 1237651539262701677a | 242.84 | 52.45 | 0.029 | 10.6 | 6859 | 14.8 | 2.58 | - | 39.9 | 39.0 | 36.6 | N |
| 1237651539792953375 | 222.33 | 63.27 | 0.042 | 11.3 | 12797 | 28.7 | 0.29 | 1.97 | 40.6 | 39.4 | 37.4 | S |
| 1237652600101142677b | 319.27 | -6.72 | 0.029 | 11.1 | 20435 | 12.9 | 0.44 | 1.92 | 41.0 | 39.3 | 38.5 | C |
| 1237654030867562543a | 176.39 | 3.23 | 0.020 | 10.8 | 17029 | 4.9 | 9.38 | 1.9 | 40.4 | 40.3 | 39.8 | C |
| 1237654400765395076a | 177.62 | 65.74 | 0.055 | 10.9 | 10355 | 7.8 | 1.75 | 1.9 | 40.9 | 39.4 | 38.5 | S |
| 1237654602104569933a | 159.88 | 5.10 | 0.027 | 10.7 | 15117 | 13.6 | 4.12 | 1.9 | 40.1 | 39.8 | 39.5 | C |
| 1237654881271414816 | 209.28 | 5.25 | 0.040 | 10.8 | 14932 | 46.5 | 0.19 | 1.9 | 40.2 | 40.0 | 39.6 | C |
| 1237655349431959652 | 246.76 | 43.47 | 0.047 | 11.0 | 10273 | 14.8 | 1.68 | 1.9 | 40.7 | 39.2 | 36.9 | L |
| 1237655465922658349 | 215.65 | 59.93 | 0.029 | 10.8 | 14933 | 29.0 | 0.18 | 1.89 | 40.7 | 39.1 | 38.2 | C |
| 1237655468597575708a | 225.33 | 1.63 | 0.035 | 11.1 | 5907 | 48.4 | 5.76 | 1.01 | 41.7 | 40.4 | 38.5 | C |
| 1237656496713105500a | 333.63 | 13.77 | 0.024 | 10.6 | 5635 | 27.0 | 3.52 | - | 39.5 | 38.7 | 36.7 | N |
| 1237657629513809952b | 135.75 | 40.43 | 0.029 | 10.6 | 20430 | 11.9 | 0.43 | - | 40.0 | 39.2 | 38.7 | C |
| 1237658205567320143 | 130.93 | 35.82 | 0.054 | 11.1 | 18143 | 22.7 | 0.27 | 1.17 | 43.4 | 39.6 | 39.1 | S |
| 1237658423556964512a | 167.20 | 7.00 | 0.041 | 10.9 | 12749 | 19.3 | 1.33 | - | 40.1 | 39.3 | 38.1 | N |
| 1237658612519141389a | 173.70 | 49.07 | 0.033 | 11.4 | 6946 | 47.3 | 1.86 | 1.9 | 39.8 | 39.3 | 36.9 | N |
| 1237658800968761369b | 202.31 | 53.08 | 0.029 | 11.2 | 20436 | 12.9 | 0.28 | - | 40.0 | 39.1 | 37.5 | L |
| 1237659897784566134b | 264.68 | 57.23 | 0.030 | 10.8 | 20432 | 12.9 | 0.32 | - | 40.0 | 39.0 | 37.4 | N |
| 1237661354316726385 | 179.77 | 58.34 | 0.054 | 11.4 | 17116 | 93.8 | 0.33 | 1.16 | 42.0 | 39.4 | 37.3 | L |
| 1237661387602853939 | 206.17 | 55.88 | 0.037 | 10.9 | 18177 | 59.9 | 0.13 | 1.17 | 41.7 | 39.8 | 39.4 | S |
| 1237662194528026666b | 189.59 | 42.20 | 0.029 | 10.7 | 20431 | 11.9 | 0.26 | 1.64 | 41.4 | 39.0 | 37.0 | L |
| 1237662199356325991b | 225.46 | 9.72 | 0.034 | 10.7 | 20427 | 16.9 | 0.35 | - | 40.0 | 39.1 | 36.8 | N |
| 1237662224616128524a | 218.32 | 34.73 | 0.034 | 10.9 | 19668 | 24.7 | 8.06 | 1.78 | 41.7 | 39.9 | 38.1 | L |
| 1237662236393406478a | 186.64 | 9.03 | 0.025 | 11.0 | 2982 | 37.9 | 2.60 | 1.9 | 39.7 | 39.1 | 36.3 | L |
| 1237662335719309348b | 241.66 | 30.09 | 0.022 | 11.0 | 20434 | 7.0 | 0.37 | - | 40.0 | 39.6 | 38.6 | C |
| 1237662666963025994 | 247.47 | 24.44 | 0.038 | 10.7 | 18169 | 9.1 | 0.18 | 1.52 | 42.3 | 39.7 | 39.3 | C |
| 1237663480337072277 | 343.77 | 0.97 | 0.053 | 10.8 | 8173 | 15.9 | 0.29 | 1.9 | 40.8 | 39.3 | 38.7 | N |
| 1237663783674314797 | 31.56 | -0.29 | 0.043 | 11.3 | 19560 | 48.6 | 0.36 | 1.57 | 43.0 | 39.8 | 39.3 | L |
| 1237665331471515679 | 208.07 | 31.44 | 0.045 | 11.2 | 12712 | 67.8 | 0.28 | 1.07 | 42.9 | 39.7 | 39.0 | L |
| 1237665372796223576a | 239.14 | 20.05 | 0.032 | 11.1 | 21400 | 17.8 | 5.77 | - | 40.0 | 39.2 | 36.7 | N |
| 1237665532798763287b | 244.66 | 15.55 | 0.030 | 11.3 | 20437 | 12.9 | 0.41 | - | 40.0 | 39.3 | 37.2 | L |
| 1237665564998762503b | 219.84 | 19.99 | 0.030 | 11.0 | 20433 | 12.9 | 0.34 | - | 40.0 | 39.0 | 37.7 | C |
| 1237665566615666691 | 234.72 | 17.02 | 0.030 | 11.0 | 18080 | 9.8 | 0.16 | 1.01 | 41.4 | 39.1 | 37.9 | S |
| 1237667212121604127b | 138.57 | 22.27 | 0.027 | 10.6 | 20429 | 11.4 | 0.30 | - | 40.0 | 38.7 | 37.1 | N |
| 1237667430091194665 | 134.65 | 18.37 | 0.060 | 11.1 | 14970 | 19.8 | 0.16 | 1.9 | 40.7 | 39.7 | 39.0 | S |
| 1237667430630228069b | 139.56 | 20.36 | 0.031 | 10.5 | 20428 | 13.8 | 0.42 | 1.9 | 40.4 | 38.9 | 37.5 | L |
| 1237667536920707358 | 121.19 | 10.77 | 0.035 | 10.8 | 22089 | 10.0 | 0.28 | 0.43 | 43.2 | 39.6 | 38.8 | S |
| 1237667915416731720a | 176.22 | 19.77 | 0.027 | 10.7 | 17201 | 61.3 | 3.94 | 1.9 | 41.2 | 39.0 | 38.3 | C |
Note. — (1) SDSS object IDs. IDs marked with a were serendipitously observed in the field of view. IDs marked with b were the objects observed as part of our Chandra proposal (ID: 19700403). Columns (2) and (3) are the RA and DEC J2000 epoch coordinates, respectively. (4) Spectroscopic redshifts. (5) Stellar mass in log M∗/M⊙. (6) Chandra observation IDs. (7) Exposure time in ksec. (8) Off-axis angle in arcminutes. (9) Photon index . For sources with counts , the spectra were fit with XSPEC and the best-fit is reported. For sources with counts , a is used, which is typical for low-luminosity AGN. See Section 2.3 for details. (10) 2 - 10 keV luminosity calculated by XSPEC or WebPIMMS. Upper limits are shown for nondetections. (11) The expected 2 - 10 keV luminosity from low-mass and high-mass X-ray binaries calculated by using the Lehmer et al. 2010 empirical relation. (12) The expected 0.5 - 2 keV luminosity from hot gas calculated using the Mineo et al. 2012 relation. (13) Optical AGN BPT classification: S for Seyferts. L for LINERs. C for composites. N for objects not classified on the BPT due to a low S/N. There are no high-mass post-mergers classified as star forming by the BPT diagnostic.
| SDSS ObjID | R.A. | Dec. | z | log | ObsID | Exp. | Sep. | log | log | log | BPT |
|---|---|---|---|---|---|---|---|---|---|---|---|
| J2000 | J2000 | ksec | arcmin | ||||||||
| 1237649963529535543 | 51.36 | -6.14 | 0.034 | 10.9 | 0760230401 | 21.9 | 1.70 | 42.4 | 40.3 | 39.9 | S |
| 1237651534946959533 | 130.40 | 54.91 | 0.045 | 10.7 | 0403190901 | 13.5 | 1.68 | 42.7 | 39.7 | 38.8 | S |
| 1237651735777509473a | 226.99 | 1.23 | 0.035 | 10.9 | 0402781001 | 19.7 | 4.28 | 40.9 | 40.3 | 39.9 | C |
| 1237652900758880309 | 24.98 | -9.24 | 0.042 | 11.6 | - | - | - | 40.5 | 40.6 | 38.0 | L |
| 1237652901297061972a | 27.88 | -8.78 | 0.036 | 11.2 | 0761730401 | 37.3 | 9.64 | 39.4 | 40.2 | 39.3 | N |
| 1237652942625767592 | 330.42 | 11.85 | 0.030 | 11.3 | 0762630201 | 21.9 | 1.75 | 40.3 | 40.3 | 39.0 | L |
| 1237653438155128872 | 346.18 | -8.68 | 0.047 | 11.4 | 0790640101 | 53.6 | 1.71 | 44.1 | 40.6 | 40.0 | S |
| 1237653616933535826a | 158.19 | 58.86 | 0.046 | 11.5 | 0142970101 | 25.5 | 9.54 | 39.8 | 40.5 | 37.8 | L |
| 1237654382515060810a | 138.35 | 52.98 | 0.025 | 11.1 | - | - | - | 40.6 | 40.1 | 37.6 | L |
| 1237655370892247130a | 154.65 | 59.66 | 0.044 | 10.7 | 0406630201 | 41.4 | 11.22 | 39.1 | 40.0 | 39.5 | C |
| 1237655373573062713a | 247.43 | 40.81 | 0.029 | 11.6 | 0203710201 | 26.3 | 1.07 | 41.6 | 40.5 | 38.0 | L |
| 1237657857145962520 | 176.84 | 52.44 | 0.049 | 10.7 | 0504101401 | 30.3 | 1.71 | 41.5 | 40.2 | 39.8 | S |
| 1237657857145962550a | 176.92 | 52.44 | 0.048 | 10.8 | 0504101401 | 30.3 | 4.01 | 41.0 | 39.9 | 39.0 | C |
| 1237658297922945185a | 157.49 | 5.48 | 0.056 | 10.6 | 0148560501 | 103.8 | 9.09 | 38.9 | 39.6 | 37.4 | N |
| 1237658299534802987 | 160.29 | 6.82 | 0.033 | 10.6 | 0782530701 | 9.9 | 1.69 | 40.4 | 39.6 | 38.6 | C |
| 1237658304352944175a | 160.60 | 58.45 | 0.045 | 10.6 | - | - | - | 40.7 | 39.6 | 37.5 | L |
| 1237658304355172477a | 170.13 | 59.87 | 0.054 | 10.9 | 0502780201 | 21.2 | 14.70 | 39.5 | 39.9 | 37.4 | N |
| 1237660613973049348 | 168.45 | 9.58 | 0.029 | 10.9 | 0601780201 | 15.1 | 1.68 | 42.8 | 40.1 | 39.6 | S |
| 1237661416605679815a | 224.94 | 49.50 | 0.027 | 10.6 | 0401270301 | 23.1 | 3.95 | 38.9 | 39.7 | 38.9 | N |
| 1237661949739663472 | 235.86 | 7.91 | 0.036 | 10.8 | 0822391101 | 16.2 | 1.69 | 42.2 | 40.1 | 39.6 | C |
| 1237662236394258511a | 188.68 | 9.00 | 0.043 | 10.6 | 0722960101 | 52.9 | 6.96 | 40.7 | 40.2 | 39.9 | C |
| 1237662340012507431a | 239.43 | 27.46 | 0.032 | 10.8 | - | - | - | 40.5 | 39.8 | 38.9 | C |
| 1237664092903047228a | 138.74 | 29.73 | 0.021 | 10.9 | 0673150401 | 42.4 | 13.55 | 40.7 | 39.9 | 38.8 | C |
| 1237664106852319509a | 149.77 | 13.02 | 0.037 | 10.7 | 0504100201 | 21.9 | 1.68 | 41.6 | 39.8 | 38.8 | S |
| 1237664106852450313a | 149.98 | 13.04 | 0.035 | 10.8 | 0504100201 | 21.9 | 10.56 | 43.3 | 40.8 | 40.5 | C |
| 1237664667902345246a | 166.34 | 38.02 | 0.030 | 10.7 | - | - | - | 40.0 | 39.7 | 37.3 | L |
| 1237664880485728337a | 139.28 | 29.37 | 0.035 | 10.7 | 0673150301 | 31.9 | 9.32 | 41.2 | 40.0 | 39.5 | S |
| 1237665025440677967a | 181.45 | 35.17 | 0.054 | 10.6 | - | - | - | 43.6 | 40.1 | 39.7 | C |
| 1237665532247670906a | 211.42 | 25.23 | 0.030 | 10.8 | - | - | - | 42.0 | 39.8 | 38.0 | S |
| 1237666299481817317a | 50.18 | -1.04 | 0.021 | 11.1 | 0810600201 | 43.0 | 1.86 | 40.0 | 40.0 | 37.8 | L |
| 1237667107428565094a | 130.67 | 19.65 | 0.055 | 11.2 | - | - | - | 40.7 | 40.2 | 38.5 | N |
| 1237667210529275951 | 184.58 | 29.25 | 0.048 | 10.7 | 0762630301 | 21.9 | 1.70 | 41.0 | 39.7 | 38.4 | S |
| 1237667211597119522a | 169.09 | 29.25 | 0.045 | 11.4 | - | - | - | 41.1 | 40.4 | 38.0 | L |
| 1237667255624990807 | 181.18 | 31.17 | 0.025 | 10.8 | 0601780601 | 39.5 | 1.69 | 41.9 | 40.0 | 39.3 | S |
| 1237667735572381852 | 159.96 | 20.84 | 0.046 | 11.2 | 0059800101 | 14.9 | 1.66 | 40.9 | 40.1 | 37.8 | L |
| 1237668298739351591a | 181.04 | 20.40 | 0.024 | 11.2 | 0112270601 | 12.4 | 9.71 | 41.2 | 40.2 | 37.6 | L |
| 1237671140947591227 | 180.24 | 6.80 | 0.036 | 10.7 | 0312191701 | 12.9 | 1.76 | 42.4 | 39.7 | - | S |
| 1237671932283256842a | 164.93 | 10.07 | 0.035 | 10.9 | 0802200801 | 35.9 | 7.93 | 40.8 | 39.9 | 37.7 | N |
| 1237671932820259064a | 165.31 | 10.48 | 0.042 | 10.9 | - | - | - | 40.3 | 39.9 | 38.6 | N |
| 1237673808121495726a | 128.93 | 21.59 | 0.042 | 10.6 | 0803953001 | 38.8 | 14.55 | 39.1 | 39.9 | 39.4 | C |
| 1237674462024106294a | 136.01 | 1.45 | 0.053 | 11.0 | 0725310131 | 12.5 | 11.45 | 41.3 | 40.2 | 39.5 | C |
Note. — (1) SDSS object IDs. Galaxies with a marked are the serendipitous galaxies in XMM observations. (2) and (3) J2000 epoch. (4) Spectroscopic redshifts. (5) Stellar mass in log M∗/M⊙. (6) XMM observation IDs. If a source is not detected in a single archived image but is detected in the 4XMM-DR11 catalog, then their observation IDs and exposure time are not shown in the table. (7) Exposure time in ksec. (8) Off-axis angle in arcmin. (9) 2 - 10 keV luminosity in log unit estimated by WebPIMMS with a fix . If a source is not detected in a single archived image but is detected in the 4XMM-DR11 catalog, the luminosity reported in the catalog is shown here. (10) 2 - 10 keV luminosity contributed from X-ray binaries in log unit calculated by using the Lehmer et al. 2010 relation. (11) 0.5 - 2 keV luminosity form hot gas in log unit calculated by using the Mineo et al. 2012 relation. (12) BPT classification: S for Seyferts. L for LINERs. C for composites. N for not on BPT due to a low S/N. There are no post-mergers classified as star forming by BPT.


II.2 Noninteracting Control Sample
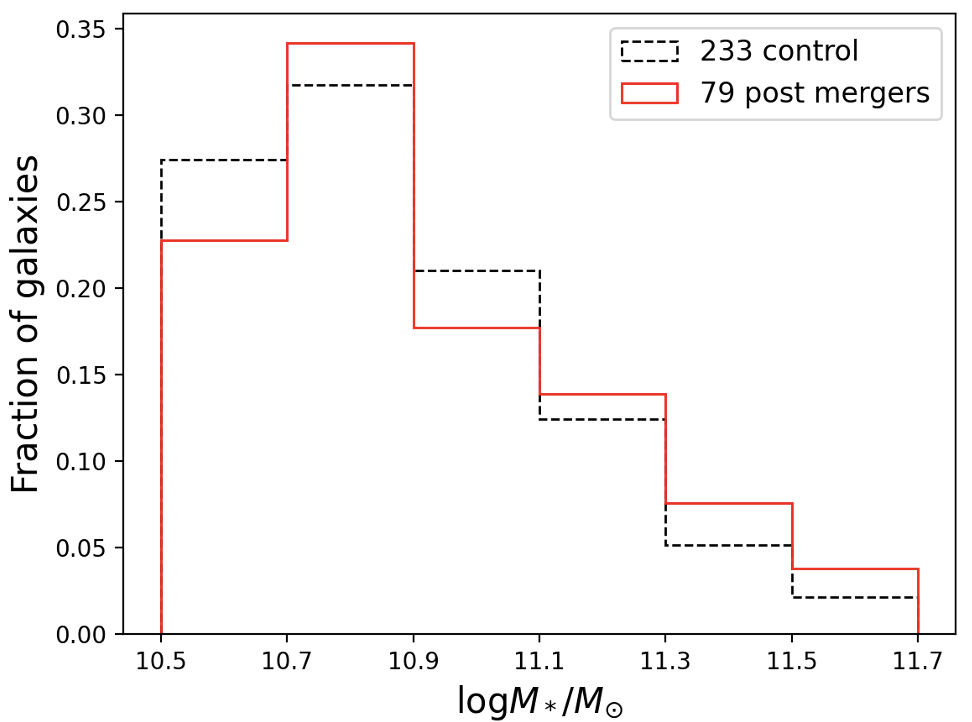
For the 79 X-ray observed post-mergers, we built a control sample by searching for noninteracting galaxies with similar redshift and stellar mass from the 113,000 N23 parent sample. For each of the post-mergers, we required its control galaxies to have a redshift within z and stellar mass within log M∗/M. We found 19,000 noninteracting control galaxies. We crossmatched this control sample with the Chandra and XMM archive and calculated the detection limit in luminosity with the same procedure as we did for the post-mergers. We identified 245 Chandra-observed control galaxies and 177 XMM-observed control galaxies for a total of 422 unique control galaxies that were deep enough to detect a source with L erg s-1. We then required the same number of X-ray-observed control galaxies matched for each of the 79 post-mergers within the z and log M∗/M⊙ range to avoid any biases. We found 77 out of 79 post-mergers that have three unique X-ray-observed noninteracting control galaxies matched. For the remaining two post-mergers, one has only two unique control galaxies and for the other (one of the most massive galaxy in our sample; log M∗/M) we were not able to find any control galaxies with X-ray observations. Including this object in our post-merger sample did not affect our results so we choose to keep it in the sample. In total, there are 233 unique noninteracting control galaxies with deep X-ray observations in either Chandra or XMM. Out of the 233 controls, 129 are observed in Chandra and the other 104 are observed in XMM. Out of the 129 Chandra-observed control galaxies, 21 were targeted objects and 108 were serendipitously observed in the field of view. Out of the 104 XMM-observed galaxies, 12 were targeted and 92 were serendipitous. These 233 control galaxies also have been observed with WISE and VLA FIRST. Their optical emission line fluxes, equivalent widths, and spectral indexes are provided by the MPA-JHU catalog. Figure 2 shows example images of control galaxies. Figure 3 shows the normalized histogram distribution of stellar masses and redshifts of post-merger galaxies and control galaxies as well as the distribution in the 2D parameter space.
II.3 X-ray Data Reduction
We downloaded the raw data from the Chandra and XMM archives and reduced all X-ray data in a consistent manner using version 4.10 of the CIAO package with version 4.7.8 of the CALDB calibration files, XSPEC version 12.11.1c, and WebPIMMS version 4.11b.
For Chandra sources, the data-reduction process is as follows. We reproduced the Chandra event-2 file in CIAO by running chandra_repro and used a enclosed counts fraction (ECF) aperture to account for PSF correction by running psfsize_srcs in CIAO. To estimate the background, a nearby region 10 times larger was chosen without any sources. For XMM sources, we used wavdetect in CIAO to determine the source regions, which also accounts for PSF correction.
To identify X-ray detections in Chandra and XMM, we required a S/N detection threshold for point sources with X-ray photon counts . For point sources with X-ray photon counts , we used small number statistics and required the source flux to be greater than the Poisson upper limit of the background (Gehrels 1986).
For Chandra detections with X-ray counts , we extracted their X-ray spectra by using specextract and calculated their X-ray luminosities by modeling an absorbed power-law spectrum using XSPEC. For Chandra detections with X-ray counts and all XMM detections, their X-ray luminosities are calculated by applying a power-law model of a fixed photon index with Galactic absorption using WebPIMMS (Constantin et al. 2009; Ishibashi & Courvoisier 2010).
For the 79 post-mergers, a total of 60 X-ray point sources were detected: 26 X-ray point sources were detected out of 38 (68.4%) Chandra observations while 34 sources were detected out of 41 (82.9%) XMM observations. For the 233 control galaxies, a total of 62 X-ray point sources were detected: 33 point sources were detected out of 129 (25.6%) Chandra observations, while 29 galaxies were detected out of 104 (or 27.9%) XMM observations. Figure 4 shows the luminosity distribution of X-ray detections in (left) post-mergers and (right) control galaxies. The Chandra detections are shown in blue while the XMM detections are shown in red. It should be noted that the Chandra observations are well resolved (1), and hence the luminosity corresponds to the central, nuclear luminosity of the galaxy. The XMM observations are not as well resolved, and the luminosity plotted in Figure 4 is for the entire galaxy. However, as can be seen in Figure 4, the luminosity distribution of the XMM detections is consistent with the Chandra detections, which suggests a similar origin. To investigate this further, we will compare the X-ray AGN fractions in the Chandra vs XMM observations separately. In the next section, we determine how many of the X-ray detections are classified as AGN by comparing the observed X-ray luminosities to the luminosities expected from X-ray binaries and/or hot gas.


III Multiwavelength AGN Diagnostics
III.1 X-ray AGN Diagnostics
We consider X-ray detections with luminosities higher than those contributed from XRBs and hot gas as X-ray AGN. X-ray hot gas mostly contributes to soft X-ray emission between 0.5 – 2 keV with negligible contribution beyond 2 keV while XRBs and AGN are the main sources of X-ray emission beyond 2 keV (see Fabbiano 1989 and Fabbiano 2006 and references therein). To identify the source of the X-ray emission, we use the following empirical scaling relation from Lehmer et al. 2010 to determine the expected X-ray contribution from high-mass and low-mass X-ray binaries (HMXB & LMXB):
| (1) |
where erg and erg . The X-ray emission from hot gas is calculated using the relation from Mineo et al. 2012:
| (2) |
with a dispersion of 0.34 dex. For sources detected in resolved Chandra imaging (PSF FWHM ), their X-ray luminosities are calculated within the ECF aperture, with an average radius of . Most Chandra-observed sources have a ECF aperture . We use the stellar masses and SFRs within the SDSS fiber to estimate the luminosities from X-ray binaries (XRBs) and hot gas in the very center of the galaxies. In addition, two Chandra sources in post-mergers and four Chandra sources in the controls have a ECF aperture . For these sources, we use the total stellar masses and SFRs of the entire galaxy to estimate the luminosities from XRBs and hot gas. For XMM detections, which are unresolved with a PSF FWHM , we use the total stellar mass and total SFR to estimate the luminosities from XRBs and hot gas in the entire galaxy.
Figure 5 shows the measured 2 - 10 keV X-ray luminosities for our sources vs the luminosities expected from HMXBs and LMXBs using the Lehmer et al. 2010 relation for (left) post-mergers and (right) control galaxies. The diagonal line shows the relation, and the blue shaded region is the 1- scatter of the relation. We defined sources above the 1- scatter of the Lehmer et al. 2010 relation as X-ray AGN. More or less stringent cuts do not affect our final conclusions but do impact statistics. Figure 6, shows the measured 0.5 - 2 keV luminosities of post-mergers (left) and control galaxies (right) vs the estimated luminosity from X-ray hot gas using the scaling relation in Mineo et al. 2012. All of our sources have X-ray luminosities higher than that expected from hot gas (on average 3 orders of magnitude higher). The three Chandra post-merger sources with luminosities close to the 1:1 line also have 2 - 10 keV luminosities consistent with XRBs and are ruled out as AGN. Out of the 79 X-ray observed post-mergers, 60 are detected, and 49 out of the 60 detections have luminosities higher than those predicted for X-ray binaries (see Figure 5) and hot gas (see Figure 6), which indicates their X-ray emission is dominated by the AGN. In the control sample of 233 noninteracting galaxies, there are 62 detections, out of which 61 have X-ray luminosities dominated by AGN.


III.1.1 X-ray AGN Frequency in Post-merger Remnants
We define the AGN fraction as the number of galaxies hosting an X-ray AGN with L erg s-1. Any galaxies with a detected X-ray AGN with luminosity erg s-1 are not included as not all of our data are deep enough to detect fainter sources. Thus our X-ray AGN fractions are lower limits.
Out of the 38 Chandra-observed post-mergers, 26 are point-source detections. Of the 26 Chandra nuclear detections, 23 have X-ray luminosities higher than that expected from XRBs and hot gas. Hence, they are classified as X-ray AGN. Out of these 23 AGN, 20 have L erg s-1. This yields an X-ray AGN fraction of 22 2 The errors are calculated as , where f is the AGN fraction and N is the total number of galaxies. in the Chandra-observed sample. Another three Chandra detections are within the 1- scatter shaded region and have X-ray luminosities consistent with those of X-ray binaries. Hence, they are not identified as X-ray AGN in our analysis.
Out of 41 XMM-observed post-mergers, 34 have been detected. Out of the 34 detections, 26 are classified as X-ray AGN, and 24 of the 26 AGN have L erg s-1. This implies an X-ray AGN fraction of . The other 8 have luminosities consistent with X-ray binaries and are not classified as X-ray AGN. The XMM AGN fraction in post-mergers is consistent with the Chandra AGN fraction. We take this as confirmation that we can combine the Chandra and XMM samples despite the different imaging resolutions. In total, 44 unique X-ray AGN with L erg s-1 are identified in the entire X-ray observed post-merger sample of 79 galaxies, with a fraction of . It should be noted that this is a lower limit on the X-ray AGN fraction. If we include those AGN with detected luminosities erg s-1, there will be 49 X-ray AGN identified in 79 post-mergers, with an AGN fraction of .
III.1.2 X-ray AGN Frequency in the Control Sample
For control galaxies, out of the 129 Chandra-observed controls, all 33 X-ray detections (blue points in Figure 5 (right) and Figure 6 (right)) are identified as X-ray AGN, and 29 out of the 33 AGN have L erg s-1. This is an X-ray AGN fraction of . For the 104 XMM-observed controls, 28 of the 29 X-ray detections are identified as AGN, and 26 out of the 28 AGN have L erg s-1, which implies an X-ray AGN fraction of . Again, the XMM AGN fraction is consistent with the Chandra AGN fraction for control galaxies. Combining the two samples, there are 55 unique X-ray AGN with L erg s-1 identified in the entire X-ray-observed control sample of 233 galaxies. The X-ray AGN fraction in the control sample is . Including lower-luminosity AGN, there are 61 X-ray AGN in 233 control galaxies, with an AGN fraction of .
The X-ray AGN frequency in high-mass post-mergers () is 2.4 times higher than that in control galaxies (). This high X-ray AGN excess suggests a strong correlation between galaxy mergers and AGN. The significance of this result can be quantified by a hypergeometric test (urn problem). A hypergeometric test describes the probability of ‘k’ successes (the number of AGN) in ‘n’ draws (sample size of post-mergers with Chandra observations) from ‘N’ objects (total number of post-mergers) containing ‘K’ successes (total number of AGN). In particular:
| (3) |
where = n!/(k! (n-k)!) is the binomial coefficient. Assuming a null hypothesis that post-mergers and control galaxies have the same AGN fraction of 23.6%, the probability that we randomly draw 79 post-mergers from a volume-limited sample of 807 and obtain an AGN fraction of 55.7% is less than 1 in . Thus, we can rule out at confidence that mergers and control galaxies have similar AGN fractions. Applying a Fisher exact test for the association between post-mergers and X-ray AGN, the probability (p-value) that we observe this excess by chance is only . Hence, we find that post-mergers and AGN are strongly correlated.
It should be noted that some of the post-merger and control galaxies were targeted because they were identified as AGN with some other diagnostic. If we restrict our analysis to only the serendipitously observed galaxies, then the X-ray AGN fraction in post-merger galaxies reduces slightly to , which is consistent with our previous measurement (). The AGN fraction in the serendipitously observed control galaxy sample also decreases down to . The AGN excess in post-merger galaxies is then 2.6 times that in control galaxies, consistent with the full sample. Hence we will use the full 79 galaxy post-merger sample and its control going forward.
III.1.3 Stacking the X-ray Nondetections
Out of the 38 Chandra-observed post-mergers, 26 have point-source detections and 12 have no individual detections. By stacking the Chandra images of the 12 nondetections, we detected a point source in the center of the stacked image in the soft band (0.5 - 2 keV) and hard band (2 - 8 keV), respectively. The source counts are extracted from an aperture of radius after subtracting the average background. The average flux is calculated in WebPIMMS by using a power-law spectrum with a fixed photon index and a fixed Galactic absorption column density . The median luminosity distance of the 12 nondetections is used to convert flux to luminosity. The stacked source has an average luminosity of log erg s-1 with S/N=6 at 0.5 - 2 keV band and log erg s-1 with S/N=3 at 2 - 8 keV band.
As hot gas and X-ray binaries can produce X-ray emission in addition to AGN, we need to estimate their contribution to this faint source to determine if the emission is due to AGN, hot gas, or X-ray binaries. To estimate the contribution of hot gas, we calculated the count ratio between the 0.5 - 2 keV band and 2 - 8 keV band of the stacked image. For post-mergers, this ratio is . Then we compared it to the expected count ratio of a typical hot gas model assuming an APEC spectrum with 0.768 keV (log T = 6.95) and with the median Galactic absorption column density of the stacked post-mergers in WebPIMMS, which results in a count ratio of . The count ratio of the stacked source is much lower than that of the hot gas model. This suggests that hot gas does not contribute much to the X-ray emission of the stacked source. We used the median star formation rate of the stacked sample to estimate the X-ray luminosity from hot gas at 0.5 - 2 keV by using the Mineo et al. 2012 relation (equation 2). We found that hot gas contributes of the X-ray emission of the stacked source.
To estimate the contribution of XRBs in the 2 - 8 keV band, we applied the Lehmer et al. 2010 relation with the average stellar mass and SFR of the 12 nondetections. We calculated the X-ray luminosity from XRBs to be log erg s-1. The 2 - 8 keV luminosity of the stacked source is within the 1- scatter of the luminosity from XRBs. Hence, the X-ray emission in the stacked source of post-mergers is more consistent with XRBs rather than AGN or hot gas.
In the stacking analysis of the Chandra-observed control sample, we exclude the observations with targets close to the gaps between the telescope chips or with a bright source nearby. By stacking the 83 Chandra nondetections in the control sample, we detected a source of log with S/N=17 at 0.5 - 2 keV and log erg s-1 with S/N=8 at 2 - 8 keV. The count ratio between the 0.5 - 2 keV band and 2 - 8 keV band of the stacked controls is . This is much lower than the expected count ratio () of a 0.768 keV hot gas model with the median Galactic absorption column density of the stacked controls. Similarly, we find that hot gas contributes of the soft-band emission and the X-ray luminosity at the hard band is within the 1- scatter of the luminosity of XRBs (log erg s-1). Thus, XRBs are the likely source of the X-ray emission in stacked nondetections. However, we still cannot rule out the existence of faint AGN whose luminosity is comparable to XRBs.
We also stacked the XMM nondetections in post-mergers and control galaxies and also found a source in the stacked images in both cases. For both the stacked objects, we found that the X-ray emission is most likely due to XRBs not AGN or hot gas.


III.2 Optical AGN Diagnostics and Frequency
To identify optical AGN, we use the emission line ratios [O III]/H vs [N II]/H to construct a BPT diagram (Baldwin et al. 1981). Fluxes of emission lines are obtained from the MPA-JHU catalog. We place a S/N 3 cut for these four emission lines. By using the Schawinski et al. 2007 empirical relation, the Kewley et al. 2001, and the Stasinska et al. 2006 theoretical relations, galaxies are classified into Seyferts (red, Figure 7), LINERs (brown), composites (green), and star forming (blue) on the BPT diagram. Out of the 79 X-ray observed post-mergers, 66 have S/N for all the four lines and are shown in Figure 7. The remaining 13 galaxies are unclassified due to a low S/N. These 79 galaxies are classified into 16 Seyferts (20.3%4.5%), 24 LINERs (30.4%5.2%), 26 composites (32.9%5.3%), and 13 unclassified (16.5%4.2%). No galaxy in our high-mass post-merger sample is classified as star forming. (Most galaxies with masses including controls are not classified as star forming.) Out of 233 control galaxies, 135 are above the S/N cuts and are classified into 14 Seyferts (6.0%1.6%), 50 LINERs (21.5%2.7%), 61 composites (26.2%2.9%), and 10 star forming (4.3%)1.3%, as shown in Figure 7 right. The other 98 (42.1%3.2%) remain unclassified due to a low S/N.
Considering only Seyferts as true AGN, the optical AGN fraction in post-mergers (20.3%4.5%) is 3.4 times higher than in control galaxies (6.0%1.6%). Considering Seyfert+LINERs, the optical AGN fraction in post-mergers (50.6%5.6%) is 1.8 times higher than that in control galaxies (27.5%2.9%). Including composites, the AGN excess in post-mergers relative to controls is 1.6. The Seyfert-only excess is more consistent with the X-ray measured AGN excess in post-mergers. Contamination by non-AGN sources (post-AGB stars, shocks) in optically identified LINERs and composites likely causes an underestimate in the measurement of optical AGN excess. This is also true using other optical AGN diagnostics as shown in the Appendix.
Some studies (Cid Fernandes et al. 2011; Stasinska et al. 2006) have applied an equivalent width cut on H (EW3Å) to remove potential contaminants. If we apply the same cut (EW(H)3Å), we find a Seyfert fraction of 20.3%4.5% in post-mergers and 5.2%1.4% in control galaxies. The Seyferts + LINERs fraction is 34.2%5.3% in post-mergers and 9.0%1.9% in control galaxies. We find a consistent optical AGN excess of 3.8 in post-mergers relative to controls when considering either Seyferts or Seyferts+LINERs with the equivalent width cut (See Table 3). However, the equivalent width cut preferentially removes X-ray-identified low-luminosity AGN.
To investigate this further, we look at the X-ray properties of Seyferts, LINERs, and composites. In Figure 7, galaxies with an X-ray-identified AGN are shown as circles for Chandra and crosses for XMM. X-ray non-AGN are shown as filled squares. Remarkably, all post-merger galaxies classified as Seyferts are also identified as X-ray AGN. This high X-ray AGN fraction in Seyferts compared to that in other BPT classes is consistent with a previous study by Constantin et al. 2009. Out of the 24 post-merger LINERs, 11 (or 45.8% 10.2%) are identified as X-ray AGN. Out of the 26 composite optical AGN, 14 (or 53.8% 9.8%) are identified as X-ray AGN, a similar fraction as LINERs. Similar trends are seen for controls. Out of the 14 control Seyferts, 10 (or 71.4% 12.1%) are identified as X-ray AGN. Out of the 50 control LINERs, 17 (or 34.0% 6.7%) are identified as X-ray AGN. Out of 61 composites, 17 (or 27.9% 5.7%) are also identified as X-ray AGN. As expected, the X-ray AGN fraction in control galaxies is lower for Seyferts, LINERs, and composites in comparison to post-merger galaxies. While a significant fraction of optical LINERs and composites are clearly X-ray AGN, many are not, suggesting contamination by shocks or post-AGB stars (Binette et al. 1994; Dopita & Sutherland 1996; Yan & Blanton 2012; Singh et al. 2013). Applying an equivalent width cut on H does not significantly alter these results. We investigate the multiwavelength AGN properties in more detail in Section 4.


III.3 WISE AGN Diagnostics and Frequency
In the infrared, we use the WISE color diagnostics to identify AGN. Figure 8 shows the WISE color W1–W2 vs W2–W3 diagram for the (left) 79 post-mergers and (right) 233 control galaxies. Galaxies with an AGN detected in X-rays are color coded into blue circles for Chandra and red crosses for XMM. The sizes of the data points indicate their X-ray luminosities. By using the WISE AGN criteria: W1 - W2 from Assef et al. 2013, we identify 18 WISE AGN out of 79 post-merger galaxies, which implies an infrared AGN fraction of . Remarkably, 17 out of the 18 WISE AGN are also identified as AGN in X-rays and they are more luminous in X-rays than other X-ray AGN that are not identified as WISE AGN. This is consistent with previous works that show that infrared color diagnostics have a selection bias towards the most luminous AGN (Mateos et al. 2013; Yan et al. 2013; Rovilos et al. 2014).
In the control samples, 8 WISE AGN are identified out of the 233 X-ray observed control galaxies, with an infrared AGN fraction of . All of the 8 AGN are also identified as X-ray AGN. The infrared AGN excess of post-mergers is 6.7 relative to noninteracting control galaxies, which strongly suggests mergers trigger AGN. This is consistent with many previous works finding a high infrared AGN excess in post-mergers and galaxy pairs relative to noninteracting galaxies (Ellison et al. 2013; Satyapal et al. 2014; Weston et al. 2017; Goulding et al. 2018; Gao et al. 2020).


III.4 Radio AGN Diagnostics and Frequency
There are 77 post-mergers out of the 79 that have been observed by the VLA FIRST survey. Out of the 77, 49 have radio detections showing the presence of a radio core in the center of the galaxies. Radio lobes have also been found in some sources, indicating AGN. However, both AGN and star formation can produce core radio emission. In order to exclude galaxies with radio emission dominated by star formation, we apply two methods to identify radio AGN. The first method is to compare the strength of the break in the optical spectra to the 1.4 GHz radio luminosity per stellar mass (see Figure 9 left). The demarcation curve between radio-loud AGN and normal star-forming galaxies was developed by Best et al. 2005 and modified by Kauffmann et al. 2008. It is 0.225 higher in than the track produced by a galaxy with an exponentially declining star formation rate of 3 Gyr e-folding time. Radio AGN are expected to have radio luminosities higher than normal star-forming galaxies (to the right of the curve). The second method is to compare the H luminosity in solar unit to the 1.4 GHz radio luminosity (see Figure 9 right). Galaxies to the right of the straight line show a radio luminosity excess relative to star-forming galaxies, and hence they are identified as radio-loud AGN. Figure 9 shows these two planes for the 77 post-merger galaxies in the upper panel and 233 control galaxies in the lower panel. The 1.4 GHz radio luminosities are obtained from the VLA FIRST catalog, while the strength of and H luminosities are obtained or derived from the MPA-JHU catalog. Galaxies located either above the division line on the ‘ vs ’ plane or below the division line on the vs plane are classified as radio AGN, which are shown in green in Figure 9. Out of the 77 post-mergers, 4 are classified as radio-loud AGN, with a radio AGN fraction of .
In the control sample, all the 233 control galaxies are observed by the VLA FIRST survey, out of which, 56 have radio detections showing a radio core. By using the same identification method, 16 radio AGN are identified from the 233 X-ray observed control sample, which yields a radio AGN fraction of . The AGN fraction in post-mergers and in control galaxies are comparable to each other. Thus, there is no enhancement in the radio AGN fraction in post-mergers relative to control galaxies. This suggests that mergers may have no role in triggering radio AGN. It is interesting to note that the radio AGN fraction obtained is similar to that in higher-redshift studies such as Hickox et al. 2009. Unlike that study, we find most of our radio AGN in both post-merger and control galaxies are identified as X-ray AGN. We discuss this further in Section 4.


| AGN in post-mergers | AGN in control galaxies | AGN Excess | |
|---|---|---|---|
| Chandra | 20 / 38 () | 29 / 129 () | |
| XMM | 24 / 41 () | 26 / 104 () | |
| Chandra+XMM | 44 / 79 () | 55 / 233 () | |
| WISE infrared | 18 / 79 () | 8 / 233 () | |
| FIRST radio | 4 / 77 () | 16 / 233 () | |
| Optical (BPT, Seyfert) | 16 / 79 () | 14 / 233 () | |
| Optical (BPT, Seyfert, EWHÅ) | 16 / 79 () | 12 / 233 () | |
| Optical (BPT, Seyfert+LINER) | 40 / 79 () | 64 / 233 () | |
| Optical (BPT, Seyfert+LINER, EWHÅ) | 27 / 79 () | 21 / 233 () | |
| Optical (BPT, S+L+composite) | 66 / 79 () | 125 / 233 () | |
| Optical (BPT, S+L+composite, EWHÅ) | 52 / 79 () | 55 / 233 () | |
| Optical (WHaN, strong AGN) | 45 / 79 () | 34 / 233 () | |
| Optical (WHaN, strong+weak AGN) | 51 / 79 () | 53 / 233 () | |
| X-ray, WISE, radio | 45 / 77 () | 58 / 233 () | |
| WISE, radio, optical (S+L, EWHÅ) | 33 / 77 () | 39 / 233 () | |
| X-ray, WISE, radio, optical (Seyferts,EWHÅ) | 45 / 77 () | 61 / 233 () | |
| X-ray, WISE, radio, optical (S+L,EWHÅ) | 49 / 77 () | 65 / 233 () | |
| X-ray, WISE, radio, optical (S+L+composite,EWHÅ) | 59 / 77 () | 91 / 233 () | |
| X-ray, WISE, radio, optical (WhaN) | 60 / 77 () | 99 / 233 () |
Note. — The table lists the number of AGN and the AGN fraction in post-mergers and control galaxies and the AGN excess in different wavelength bands. The AGN excess is defined as the AGN fraction in post-mergers relative to that in control galaxies. When calculating the AGN fraction for a specific wavelength band or telescope, only the galaxies with existing observations are taken into account. The WHaN AGN fraction (Cid Fernandes et al. 2011), described in the Appendix, is also shown in this table.
IV Discussion
IV.1 Multiwavelength AGN Fraction
In the previous section, we investigated the merger–AGN relation in post-merger galaxies and controls individually in the X-rays, optical, mid-infrared, and radio. We found a significant AGN excess in post-mergers compared to control galaxies in the X-ray, infrared, and optical bands. In this section, we will discuss the multiwave-band AGN fraction by combing all four AGN identification methods. We identify a galaxy as an AGN if it is detected as an AGN in at least one diagnostic. We will first calculate the multiwave-band AGN fraction by considering only Seyferts as optical AGN. Then we will include LINERs. We will also apply the equivalent width cut on H to be 3Å.
Figure 10 shows Venn diagrams of AGN identified in all four wavebands: X-rays (blue), mid-IR (red), radio (yellow), and optical (green) for post-mergers (left) and their control galaxies (right). The top panels consider Seyferts only as optical AGN while the bottom panel considers both Seyferts and LINERs as optical AGN. Note that only 77 of the 79 post-mergers are shown in these diagram as two post-mergers do not have FIRST radio observations. The upper panels in Figure 10 show that 45 of the 77 post-mergers () are identified as AGN in at least one band (X-rays, IR, radio and optical) while 61 of the 233 control galaxies () are identified as AGN. Nearly all WISE mid-IR and FIRST radio AGN are also X-ray AGN no matter if they are post-mergers or control galaxies. This is also true for a large fraction of optically identified AGN. Thus the overall multiwavelength AGN fraction is dominated by the X-ray-detected sample. The multiwavelength AGN fraction in post-merger galaxies is times higher than in noninteracting control galaxies. By applying a hypergeometric test, we can rule out that post-mergers and control galaxies have similar AGN fractions at confidence level. Applying a Fisher exact test, we find post-mergers and AGN are strongly correlated with a p-value of .
The bottom Venn diagrams in Figure 10 show the multiwavelength AGN (including LINERs as optical AGN) identified in post-mergers and control galaxies. There are 49 AGN out of 77 post-mergers identified in at least one band. The multiwavelength AGN fraction including optical LINERs in the post-merger sample is . In the control sample, 65 AGN out of 233 control galaxies are identified in at least one band, which is shown as the last Venn diagram in Figure 10. This implies an AGN fraction of in control galaxies. The AGN excess in post-mergers is relative to control galaxies. By applying a similar hypergeometric test, we can rule out that post-mergers and control galaxies have similar AGN fractions at confidence level. A Fisher exact test shows that mergers and AGN are strongly related with a p-value = for the null hypothesis.
We find that a large fraction of AGN are identified mainly in X-rays ( in both post-mergers and control galaxies). In fact, 40% of AGN are only identified in deep X-ray imaging for both post-mergers and control galaxies. If we consider AGN classified in WISE, radio, and optical, the multiwavelength AGN fraction is in post-mergers and in control galaxies. Although it still implies a similar AGN excess (2.6), the multiwavelength AGN fraction is lower without X-ray AGN. Hence, deep X-ray observations are crucial to probe the complete demographics of AGN and the merger–AGN relation.
Table 3 summarizes the AGN fractions and excesses obtained using different AGN selection techniques for both post-mergers and their controls. In every wavelength range, except radio, post-mergers have a higher AGN fraction compared to control galaxies. However, the exact values of the AGN fraction and excess obtained differ based on the diagnostic.


Our multiwavelength AGN excess in optical and WISE diagnostics is consistent with that of many previous works (Ellison et al. 2011; Ellison et al. 2013; Satyapal et al. 2014; Weston et al. 2017; Goulding et al. 2018; Gao et al. 2020). However, our X-ray analysis is not consistent with a similar work. Secrest et al. 2020 investigated the AGN fraction in 43 post-mergers by using XMM-Newton observations. They found that (2/43) of their post-mergers host an X-ray AGN while (9/430) of noninteracting galaxies have X-ray AGN detections, with an excess of which though comparable to our measured excess was not statistically significant. Compared to their work, we find both a higher X-ray AGN fraction in post-mergers () and control galaxies () and a significant AGN excess in post-mergers. As can be seen in Figure 5, most of the X-ray AGN in both our post-merger sample and control sample have luminosities erg s-1, with a median value of log L = in post-mergers and log L = in control galaxies. The Secrest et al. 2020 sample, while not having a single detection threshold, was restricted to objects with luminosities between erg s-1, with a median luminosity of erg s-1. If we restrict our sample to the same luminosity range, we obtain an X-ray AGN fraction of in post-mergers and in control galaxies leading to an AGN excess of . We attribute the lower X-ray AGN fraction in Secrest et al. 2020 to (a) their sample not having uniform depth, (b) a smaller sample size spanning a wider range in merger stages, and (c) having contamination from noninteracting galaxies (like outer ring galaxies) in their post-merger sample.
Figure 11 shows the X-ray AGN fraction (solid line) and AGN excess (dashed line) versus the threshold X-ray luminosity for post-mergers (red lines) and control galaxies (black line). We find that the AGN fraction obtained decreases with increasing X-ray-detection threshold, as expected. However, the AGN excess stays in the range of 2 - 3 for any X-ray threshold luminosity chosen. There are indications that the AGN excess in post-mergers may increase at higher luminosities. However, we do not have the statistics to confirm this. This is consistent with some previous studies that found that major mergers tend to trigger the most luminous AGN more frequently than normal galaxies (Treister et al. 2012; Glikman et al. 2015; Hong et al. 2015; Dietrich et al. 2018; Goulding et al. 2018; Weigel et al. 2018; McAlpine et al. 2020). However, there are other studies finding no trend between mergers and luminous AGN (Villforth et al. 2014; Marian et al. 2019).
Overall, unlike many previous studies mainly focusing on luminous AGN (e.g., Silverman et al. 2011; Lackner et al. 2014; Weston et al. 2017; Goulding et al. 2018), our sample probes AGN with a wider range of X-ray luminosities from erg s-1 down to erg s-1. By specifically including LLAGN, we are able to have a more complete census of the AGN population.
IV.2 Dependence of the AGN Fraction on Galaxy Properties
In addition to AGN selection techniques, sample selection could play a role in understanding the merger–AGN connection. In Figure 12, we investigate the X-ray AGN fraction (top), optical AGN fraction (middle), and WISE IR AGN fraction (bottom) as a function of the stellar mass (left), g - r color (middle), and environment density (right) of the post-mergers and control galaxies. Again, we only consider X-ray AGN with luminosities erg s-1. We find that the X-ray AGN fraction in the 79 post-mergers is and nearly independent of the stellar mass given our measurement errors (blue, solid line), while in the 233 galaxy control sample (black, solid line), the X-ray AGN fraction increases with the stellar mass. This suggests that X-ray LLAGN in post-merger galaxies are a better tracer of the supermassive black hole (SMBH) occupation fraction compared to normal, noninteracting galaxies.
In Figure 12 (left, middle row), we consider Seyferts and LINERs with EW(H) 3Å as AGN (solid lines). We also show the Seyferts + LINERs without the equivalent width cut (dotted lines) for comparison. The optical AGN fraction does not depend on the stellar mass in neither post-mergers nor the control sample. Removing the equivalent width cut in H leads to a dependence of the AGN fraction on the stellar mass such that the AGN fractions are higher in more massive galaxies. This is likely due to increased contamination by non-AGN LINERs at higher masses. The IR AGN fraction is also consistent with having no dependence on the stellar mass for post-mergers given the error bars.
The middle column in Figure 12 shows the dependence of the AGN fraction on the galaxy color. We find a clear trend of decreasing X-ray AGN fraction from blue to red (g - r) colors for post-mergers. Bluer post-mergers tend to have a very high X-ray AGN fraction () than redder post-mergers (). Our control galaxy sample shows no such trend in the X-rays. This trend with the color could be related to the gas content in these merger systems.
The optical AGN fraction shows no clear dependence on the galaxy color given the error bars although post-mergers with intermediate colors (g-r = 0.6-0.8) may have a slightly higher optical AGN fraction.
The IR AGN fraction in post-mergers shows a similar dependence on the color as the X-ray AGN fraction such that bluer post-merger galaxies have a higher IR AGN fraction compared to redder galaxies. This is consistent with Hickox et al. 2009 finding that AGN identified in the mid-IR tend to be located in blue star-forming galaxies. The control sample shows a slight IR AGN excess for intermediate colors.


When constructing the control sample, we only controlled for the stellar mass and redshift. However, the environment of galaxies can affect the gas content and triggering of an AGN (Kim et al. 2020). Figure 12 (right) shows the dependence of the X-ray AGN fraction on the environment density in post-mergers and the control sample. The environment density for our galaxies is obtained from Baldry et al. 2006. We find that the X-ray AGN fraction in both post-merger and control galaxies is nearly independent of the environment. The optical and IR AGN fractions also show no dependence (or a very mild dependence) on the galaxy environment within errors. It should be noted that our sample does not probe the most massive clusters. Hence, we cannot rule out a dependence of the AGN fraction on the environment in the densest regions.
The color and stellar mass of our sample are key factors in determining the AGN fraction in both post-mergers and controls. Figure 13 shows the (g - r) color vs stellar mass diagram on the left and the specific SFR vs stellar mass diagram on the right for AGN identified in post-mergers (top) and controls (bottom). The gray contours are for the entire N23 SDSS 113K galaxy sample. X-ray-identified AGN are shown as blue crosses, optical AGN are shown as green open circles, IR AGN are shown as red open squares, and radio AGN are shown as yellow stars. The dashed lines in each plot show the demarcation between passive/red-sequence, green-valley, and star-forming/blue-cloud galaxies. We find that X-ray AGN are distributed throughout the color–mass and sSFR–mass space for both post-mergers and controls. The same is true for optical AGN. IR AGN are more likely to be located in star-forming/blue-cloud or green-valley galaxies. On the contrary, AGN identified in the radio tend to appear in the passive/red-sequence regions. This is consistent with Hickox et al. 2009 and numerous studies (Magliocchetti 2022 and references therein) which claim that radio AGN are more likely in massive, red galaxies where they are important in maintaining quenching. The mechanisms triggering radio AGN are expected to be related to the stellar mass of the galaxy (Magliocchetti 2022) and not external triggers.


IV.3 Dependence of the AGN Luminosities on Galaxy Properties
Figure 14 shows the distribution of the X-ray luminosities of AGN in post-mergers (red circles) and controls (black triangles) in bins of the (left) stellar mass, (middle) color, and (right) environment density. We find no dependence of the AGN luminosity on the stellar mass of the galaxy for both post-mergers and controls. The median X-ray luminosities in both post-mergers and their noninteracting controls are similar. This suggests that while mergers help trigger more AGN, the AGN properties might not depend on the triggering mechanism. There is a large scatter in X-ray luminosities. However, this could be driven by our smaller AGN sample for both post-mergers and control galaxies at large masses.
The X-ray AGN luminosity of post-mergers also shows no dependence on the galaxy color within errors although there are mild hints that it may increase with blue colors. The control galaxies show no dependence of the AGN luminosity on the galaxy color. Lastly, neither post-mergers nor controls show any dependence of the X-ray luminosity on the environment within our measurement errors. It should be noted that we cannot rule out the presence of strong dust obscuration, which could lead to an underestimate in the measured X-ray luminosities of our sources. This will be investigated in future work with NuSTAR (Harrison et al. 2013) observations.
V Summary
In this paper, we investigate the relationship between mergers and AGN in the nearby universe with 79 post-merger remnant galaxies and 233 control galaxies with X-ray imaging from Chandra or XMM.
We find that the X-ray AGN fraction in post-merger galaxies is , and it is 2.4 times higher than that in a mass- and redshift-matched control sample. The significance of this results is 6.5. The AGN fraction and excess obtained are sensitive to the AGN selection technique used. An AGN excess is seen using X-rays, optical, and mid-infrared AGN diagnostics but not in the radio. We find that the X-ray AGN fraction of post-merger remnants is independent of the stellar mass and galaxy environment but strongly depends on the galaxy color so that blue galaxies have higher X-ray AGN fractions. On the other hand, the X-ray AGN fraction in noninteracting control galaxies has a strong dependence on the galaxy mass, increasing with the stellar mass, but shows no dependence on the galaxy color or environment given our measurement errors. These trends strongly depend on the AGN wavelength diagnostics used. We find that probing low-luminosity AGN with deep X-ray observations provides a better constraint on the overall AGN fractions. Our work shows that deep X-ray data are essential to understanding the merger–AGN connection. We will be extending this work to lower-mass galaxies with log M∗/M and investigating quenching signatures in these merger remnants
in future papers.
Acknowledgement
Support for this work was provided by the National Aeronautics and Space Administration through Chandra Award Number 19700403 issued by the Chandra X-ray Center, which is operated by the Smithsonian Astrophysical Observatory for and on behalf of the National Aeronautics Space Administration under contract NAS8-03060. The scientific results reported in this article are based on observations made by the Chandra X-ray Observatory, data obtained from the Chandra Data Archive and the Chandra Source Catalog 2.0, and software provided by the Chandra X-ray Center (CXC) in the application packages CIAO.
This work was also based on observations obtained with XMM-Newton, an ESA science mission with instruments and contributions directly funded by ESA Member States and NASA. This research has made use of data obtained from the 4XMM XMM-Newton Serendipitous Source Catalog compiled by the 10 institutes of the XMM-Newton Survey Science Centre selected by ESA.
Coauthor Preethi Nair would also like to acknowledge support by the National Science Foundation under Grant No. 1616547. The NSF grant enabled the visual classification of the parent sample of galaxies used in this analysis. Any opinions, findings, and conclusions or recommendations expressed in this material are those of the author(s) and do not necessarily reflect the views of the National Science Foundation.
This publication makes use of data products from the Wide-field Infrared Survey Explorer, which is a joint project of the University of California, Los Angeles, and the Jet Propulsion Laboratory/California Institute of Technology, funded by the National Aeronautics and Space Administration. This research has made use of ALLWISE catalog from the NASA/IPAC Infrared Science Archive (IRSA), which is funded by the National Aeronautics and Space Administration and operated by the California Institute of Technology.
This publication makes use of the VLA FIRST catalog provided by the National Radio Astronomy Observatory, which is a facility of the National Science Foundation operated under cooperative agreement by Associated Universities, Inc.
This publication makes use of data from the Sloan Digital Sky Survey. Funding for the Sloan Digital Sky Survey has been provided by the Alfred P. Sloan Foundation, the U.S. Department of Energy Office of Science, and the Participating Institutions. SDSS acknowledges support and resources from the Center for High Performance Computing at the University of Utah. The SDSS website is www.sdss.org.
Appendix A Other optical diagnostics


The optical AGN diagnostic used in this work is introduced in Section 3, which is the [O III]/H vs [N II]/H BPT diagram. We have found that all BPT Seyferts and 45.8% of LINERs in post-mergers are identified as X-ray AGN by either Chandra or XMM. Here we compare our single BPT diagnostic to other optical AGN diagnostics. Figure 15 shows the combined BPT diagnostics (Kewley et al. 2006) for post-mergers in the upper panel and control galaxies in the lower panel. We applied a cut of S/N on all six emission lines ([O III], H, [N II], H, [S II], and [O I]). Galaxies below the Stasinska et al. 2006 dashed curve on the [NII]/H diagram and below the Kewley et al. 2006 solid curves on [S II]/H and [O I]/H diagrams are classified as star forming (blue). Galaxies between the dashed curve and the Kewley et al. 2001 solid curve on [NII]/H diagram are classified as composites (green). Galaxies above either one of the solid curves on these three diagrams are classified as optical AGN (Seyferts + LINERs). Seyferts (red) are classified as above either one of the division straight lines on [S II]/H or [O I]/H diagrams. The 79 post-mergers are classified into 21 Seyferts, 19 LINERs, 16 composites, and no star forming. The remaining 23 galaxies are unclassified due to a low S/N. Using the combined BPT diagnostics, the optical AGN (Seyferts + LINERs) fraction in post-mergers is . The 233 control galaxies are classified into 15 Seyferts, 29 LINERs, 21 composites, and 8 star forming. The remaining 160 galaxies have low S/N and are not classified by the BPT diagnostic. The optical AGN fraction in the control sample is , which implies an optical AGN excess of in post-mergers relative to control galaxies. Applying the equivalent width cut of EWHÅ , we obtained an optical AGN of in post-mergers and in control galaxies. This implies an AGN excess of 3.50.8. The AGN excess obtained with this method is higher than that obtained from the single [N II] BPT method. However, this method results in a large unclassified fraction in the sample compared to the single BPT method as we placed S/N cuts on two additional emission lines.


Another optical AGN diagnostic is the WHaN diagram (Cid Fernandes et al. 2011), which uses the H equivalent width vs [N II]/H emission line ratio. We applied a cut of S/N on H and [N II]. Pure star-forming galaxies (blue) are classified with log ([N II]/H and W(H) 3Å. Strong AGN (i.e., Seyferts; red) are classified with log ([N II]/H and W(H) 6Å. Weak AGN (brown) are classified with log ([N II]/H and W(H) between 3 and 6Å. Retired galaxies (green) are classified with W(H) 3Å. Passive galaxies (black) are classified with W(H) and W([N II]) 0.5Å. LINERs in this method are defined as the combination of weak AGN and retired galaxies. Figure 16 shows the WHaN diagnostic for post-mergers (left) and control galaxies (right). The 79 post-mergers are classified into 45 strong AGN, 6 weak AGN, 20 retired galaxies, 1 passive galaxy and 1 star-forming galaxy. The remaining 6 galaxies have a low S/N and are unclassified. The optical AGN (strong + weak AGN) fraction in post-mergers with this method is . The 233 control galaxies are classified into 34 strong AGN, 19 weak AGN, 87 retired galaxies, 11 star-forming galaxies, and 10 passive galaxies. The remaining 72 galaxies are unclassified due to a low S/N. The optical AGN fraction in the control sample is . The optical AGN excess is in post-mergers relative to control galaxies. This is consistent with the optical BPT AGN excess in post-mergers relative to control galaxies. In addition, the number of multiwavelength AGN is consistent no matter which optical diagnostic is used. However, 38.2% of the strong AGN classified by the WHaN diagram in post-mergers are X-ray non-AGN, unlike in the [N II]/H single BPT where all Seyfert post-mergers were X-ray detected. This suggests that the WHaN diagram may misclassify some non-AGN host galaxies as strong AGN.
In summary, we find a strong excess of AGN in post-mergers compared to control galaxies in all optical AGN diagnostics.
References
- Alonso et al. (2007) Alonso, M. S., Lambas, D. G., Tissera, P., & Coldwell, G. 2007, MNRAS, 375, 1017, doi: 10.1111/j.1365-2966.2007.11367.x
- Assef et al. (2013) Assef, R. J., Stern, D., Kochanek, C. S., et al. 2013, ApJ, 772, 26, doi: 10.1088/0004-637X/772/1/26
- Baldry et al. (2006) Baldry, I. K., Balogh, M. L., Bower, R. G., et al. 2006, MNRAS, 373, 469, doi: 10.1111/j.1365-2966.2006.11081.x
- Baldwin et al. (1981) Baldwin, J. A., Phillips, M. M., & Terlevich, R. 1981, PASP, 93, 5, doi: 10.1086/130766
- Barnes (1992) Barnes, J. E. 1992, ApJ, 393, 484, doi: 10.1086/171522
- Becker et al. (1994) Becker, R. H., White, R. L., & Helfand, D. J. 1994, in Astronomical Society of the Pacific Conference Series, Vol. 61, Astronomical Data Analysis Software and Systems III, ed. D. R. Crabtree, R. J. Hanisch, & J. Barnes, 165
- Becker et al. (1995) Becker, R. H., White, R. L., & Helfand, D. J. 1995, ApJ, 450, 559, doi: 10.1086/176166
- Bennert et al. (2008) Bennert, N., Canalizo, G., Jungwiert, B., et al. 2008, ApJ, 677, 846, doi: 10.1086/529068
- Bessiere et al. (2012) Bessiere, P. S., Tadhunter, C. N., Ramos Almeida, C., & Villar Martín, M. 2012, MNRAS, 426, 276, doi: 10.1111/j.1365-2966.2012.21701.x
- Best & Heckman (2012) Best, P. N., & Heckman, T. M. 2012, MNRAS, 421, 1569, doi: 10.1111/j.1365-2966.2012.20414.x
- Best et al. (2005) Best, P. N., Kauffmann, G., Heckman, T. M., & Ivezić, Ž. 2005, MNRAS, 362, 9, doi: 10.1111/j.1365-2966.2005.09283.x
- Binette et al. (1994) Binette, L., Magris, C. G., Stasińska, G., & Bruzual, A. G. 1994, A&A, 292, 13
- Blecha et al. (2018) Blecha, L., Snyder, G. F., Satyapal, S., & Ellison, S. L. 2018, MNRAS, 478, 3056, doi: 10.1093/mnras/sty1274
- Bower et al. (2006) Bower, R. G., Benson, A. J., Malbon, R., et al. 2006, MNRAS, 370, 645, doi: 10.1111/j.1365-2966.2006.10519.x
- Brinchmann et al. (2004) Brinchmann, J., Charlot, S., White, S. D. M., et al. 2004, MNRAS, 351, 1151, doi: 10.1111/j.1365-2966.2004.07881.x
- Choi et al. (2012) Choi, E., Ostriker, J. P., Naab, T., & Johansson, P. H. 2012, ApJ, 754, 125, doi: 10.1088/0004-637X/754/2/125
- Cid Fernandes et al. (2011) Cid Fernandes, R., Stasińska, G., Mateus, A., & Vale Asari, N. 2011, MNRAS, 413, 1687, doi: 10.1111/j.1365-2966.2011.18244.x
- Cisternas et al. (2013) Cisternas, M., Jahnke, K., & Cosmos Collaboration. 2013, in Astronomical Society of the Pacific Conference Series, Vol. 477, Galaxy Mergers in an Evolving Universe, ed. W. H. Sun, C. K. Xu, N. Z. Scoville, & D. B. Sanders, 173
- Cisternas et al. (2011) Cisternas, M., Jahnke, K., Inskip, K. J., et al. 2011, ApJ, 726, 57, doi: 10.1088/0004-637X/726/2/57
- Conselice (2006) Conselice, C. J. 2006, ApJ, 638, 686, doi: 10.1086/499067
- Constantin et al. (2009) Constantin, A., Green, P., Aldcroft, T., et al. 2009, ApJ, 705, 1336, doi: 10.1088/0004-637X/705/2/1336
- Cotini et al. (2013) Cotini, S., Ripamonti, E., Caccianiga, A., et al. 2013, MNRAS, 431, 2661, doi: 10.1093/mnras/stt358
- Croton et al. (2006) Croton, D. J., Springel, V., White, S. D. M., et al. 2006, MNRAS, 365, 11, doi: 10.1111/j.1365-2966.2005.09675.x
- Cutri & et al. (2014) Cutri, R. M., & et al. 2014, VizieR Online Data Catalog, II/328
- Davies et al. (2017) Davies, R. L., Groves, B., Kewley, L. J., et al. 2017, MNRAS, 470, 4974, doi: 10.1093/mnras/stx1559
- Dietrich et al. (2018) Dietrich, J., Weiner, A. S., Ashby, M. L. N., et al. 2018, MNRAS, 480, 3562, doi: 10.1093/mnras/sty2056
- Dopita & Sutherland (1996) Dopita, M. A., & Sutherland, R. S. 1996, ApJS, 102, 161, doi: 10.1086/192255
- Ellison et al. (2013) Ellison, S. L., Mendel, J. T., Patton, D. R., & Scudder, J. M. 2013, MNRAS, 435, 3627, doi: 10.1093/mnras/stt1562
- Ellison et al. (2011) Ellison, S. L., Patton, D. R., Mendel, J. T., & Scudder, J. M. 2011, MNRAS, 418, 2043, doi: 10.1111/j.1365-2966.2011.19624.x
- Ellison et al. (2019) Ellison, S. L., Viswanathan, A., Patton, D. R., et al. 2019, MNRAS, 487, 2491, doi: 10.1093/mnras/stz1431
- Evans et al. (2010) Evans, I. N., Primini, F. A., Glotfelty, K. J., et al. 2010, ApJS, 189, 37, doi: 10.1088/0067-0049/189/1/37
- Fabbiano (1989) Fabbiano, G. 1989, ARA&A, 27, 87, doi: 10.1146/annurev.aa.27.090189.000511
- Fabbiano (2006) —. 2006, ARA&A, 44, 323, doi: 10.1146/annurev.astro.44.051905.092519
- Gabor et al. (2009) Gabor, J. M., Impey, C. D., Jahnke, K., et al. 2009, ApJ, 691, 705, doi: 10.1088/0004-637X/691/1/705
- Gao et al. (2020) Gao, F., Wang, L., Pearson, W. J., et al. 2020, A&A, 637, A94, doi: 10.1051/0004-6361/201937178
- Gebhardt et al. (2000) Gebhardt, K., Bender, R., Bower, G., et al. 2000, ApJ, 539, L13, doi: 10.1086/312840
- Gehrels (1986) Gehrels, N. 1986, ApJ, 303, 336, doi: 10.1086/164079
- Glikman et al. (2015) Glikman, E., Simmons, B., Mailly, M., et al. 2015, ApJ, 806, 218, doi: 10.1088/0004-637X/806/2/218
- Goulding et al. (2018) Goulding, A. D., Greene, J. E., Bezanson, R., et al. 2018, PASJ, 70, S37, doi: 10.1093/pasj/psx135
- Grogin et al. (2005) Grogin, N. A., Conselice, C. J., Chatzichristou, E., et al. 2005, ApJ, 627, L97, doi: 10.1086/432256
- Harrison et al. (2013) Harrison, F. A., Craig, W. W., Christensen, F. E., et al. 2013, ApJ, 770, 103, doi: 10.1088/0004-637X/770/2/103
- HI4PI Collaboration et al. (2016) HI4PI Collaboration, Ben Bekhti, N., Flöer, L., et al. 2016, A&A, 594, A116, doi: 10.1051/0004-6361/201629178
- Hickox et al. (2009) Hickox, R. C., Jones, C., Forman, W. R., et al. 2009, ApJ, 696, 891, doi: 10.1088/0004-637X/696/1/891
- Hong et al. (2015) Hong, J., Im, M., Kim, M., & Ho, L. C. 2015, ApJ, 804, 34, doi: 10.1088/0004-637X/804/1/34
- Hopkins & Hernquist (2009) Hopkins, P. F., & Hernquist, L. 2009, ApJ, 698, 1550, doi: 10.1088/0004-637X/698/2/1550
- Hopkins et al. (2005) Hopkins, P. F., Hernquist, L., Cox, T. J., et al. 2005, ApJ, 630, 705, doi: 10.1086/432438
- Hopkins et al. (2008) Hopkins, P. F., Hernquist, L., Cox, T. J., & Kereš, D. 2008, ApJS, 175, 356, doi: 10.1086/524362
- Ishibashi & Courvoisier (2010) Ishibashi, W., & Courvoisier, T. J. L. 2010, A&A, 512, A58, doi: 10.1051/0004-6361/200913587
- Ji et al. (2014) Ji, I., Peirani, S., & Yi, S. K. 2014, A&A, 566, A97, doi: 10.1051/0004-6361/201423530
- Kauffmann et al. (2008) Kauffmann, G., Heckman, T. M., & Best, P. N. 2008, MNRAS, 384, 953, doi: 10.1111/j.1365-2966.2007.12752.x
- Kauffmann et al. (2003a) Kauffmann, G., Heckman, T. M., White, S. D. M., et al. 2003a, MNRAS, 341, 33, doi: 10.1046/j.1365-8711.2003.06291.x
- Kauffmann et al. (2003b) Kauffmann, G., Heckman, T. M., Tremonti, C., et al. 2003b, MNRAS, 346, 1055, doi: 10.1111/j.1365-2966.2003.07154.x
- Keel et al. (1985) Keel, W. C., Kennicutt, R. C., J., Hummel, E., & van der Hulst, J. M. 1985, AJ, 90, 708, doi: 10.1086/113779
- Kewley et al. (2001) Kewley, L. J., Dopita, M. A., Sutherland, R. S., Heisler, C. A., & Trevena, J. 2001, ApJ, 556, 121, doi: 10.1086/321545
- Kewley et al. (2006) Kewley, L. J., Groves, B., Kauffmann, G., & Heckman, T. 2006, MNRAS, 372, 961, doi: 10.1111/j.1365-2966.2006.10859.x
- Kim et al. (2020) Kim, M., Choi, Y.-Y., & Kim, S. S. 2020, MNRAS, 491, 4045, doi: 10.1093/mnras/stz3158
- Kocevski et al. (2012) Kocevski, D. D., Faber, S. M., Mozena, M., et al. 2012, ApJ, 744, 148, doi: 10.1088/0004-637X/744/2/148
- Kormendy & Ho (2013) Kormendy, J., & Ho, L. C. 2013, ARA&A, 51, 511, doi: 10.1146/annurev-astro-082708-101811
- Koss et al. (2012) Koss, M., Mushotzky, R., Treister, E., et al. 2012, ApJ, 746, L22, doi: 10.1088/2041-8205/746/2/L22
- Koss et al. (2010) Koss, M., Mushotzky, R., Veilleux, S., & Winter, L. 2010, ApJ, 716, L125, doi: 10.1088/2041-8205/716/2/L125
- Lackner et al. (2014) Lackner, C. N., Silverman, J. D., Salvato, M., et al. 2014, AJ, 148, 137, doi: 10.1088/0004-6256/148/6/137
- Lehmer et al. (2010) Lehmer, B. D., Alexander, D. M., Bauer, F. E., et al. 2010, ApJ, 724, 559, doi: 10.1088/0004-637X/724/1/559
- Letawe et al. (2010) Letawe, Y., Letawe, G., & Magain, P. 2010, MNRAS, 403, 2088, doi: 10.1111/j.1365-2966.2010.16244.x
- Lotz et al. (2008) Lotz, J. M., Jonsson, P., Cox, T. J., & Primack, J. R. 2008, MNRAS, 391, 1137, doi: 10.1111/j.1365-2966.2008.14004.x
- Magliocchetti (2022) Magliocchetti, M. 2022, A&A Rev., 30, 6, doi: 10.1007/s00159-022-00142-1
- Marian et al. (2019) Marian, V., Jahnke, K., Mechtley, M., et al. 2019, ApJ, 882, 141, doi: 10.3847/1538-4357/ab385b
- Martini (2004) Martini, P. 2004, in Coevolution of Black Holes and Galaxies, ed. L. C. Ho, 169. https://arxiv.org/abs/astro-ph/0304009
- Mateos et al. (2013) Mateos, S., Alonso-Herrero, A., Carrera, F. J., et al. 2013, MNRAS, 434, 941, doi: 10.1093/mnras/stt953
- McAlpine et al. (2020) McAlpine, S., Harrison, C. M., Rosario, D. J., et al. 2020, MNRAS, 494, 5713, doi: 10.1093/mnras/staa1123
- McConnell et al. (2012) McConnell, N. J., Ma, C.-P., Murphy, J. D., et al. 2012, ApJ, 756, 179, doi: 10.1088/0004-637X/756/2/179
- Mineo et al. (2012) Mineo, S., Gilfanov, M., & Sunyaev, R. 2012, MNRAS, 426, 1870, doi: 10.1111/j.1365-2966.2012.21831.x
- Nair & Abraham (2010) Nair, P. B., & Abraham, R. G. 2010, ApJS, 186, 427, doi: 10.1088/0067-0049/186/2/427
- Pillepich et al. (2019) Pillepich, A., Nelson, D., Springel, V., et al. 2019, MNRAS, 490, 3196, doi: 10.1093/mnras/stz2338
- Rovilos et al. (2014) Rovilos, E., Georgantopoulos, I., Akylas, A., et al. 2014, MNRAS, 438, 494, doi: 10.1093/mnras/stt2228
- Satyapal et al. (2014) Satyapal, S., Ellison, S. L., McAlpine, W., et al. 2014, MNRAS, 441, 1297, doi: 10.1093/mnras/stu650
- Schawinski et al. (2007) Schawinski, K., Thomas, D., Sarzi, M., et al. 2007, MNRAS, 382, 1415, doi: 10.1111/j.1365-2966.2007.12487.x
- Schaye et al. (2015) Schaye, J., Crain, R. A., Bower, R. G., et al. 2015, MNRAS, 446, 521, doi: 10.1093/mnras/stu2058
- Secrest et al. (2020) Secrest, N. J., Ellison, S. L., Satyapal, S., & Blecha, L. 2020, MNRAS, 499, 2380, doi: 10.1093/mnras/staa1692
- Shah et al. (2020) Shah, E. A., Kartaltepe, J. S., Magagnoli, C. T., et al. 2020, ApJ, 904, 107, doi: 10.3847/1538-4357/abbf59
- Silverman et al. (2011) Silverman, J. D., Kampczyk, P., Jahnke, K., et al. 2011, ApJ, 743, 2, doi: 10.1088/0004-637X/743/1/2
- Singh et al. (2013) Singh, R., van de Ven, G., Jahnke, K., et al. 2013, A&A, 558, A43, doi: 10.1051/0004-6361/201322062
- Somerville et al. (2008) Somerville, R. S., Hopkins, P. F., Cox, T. J., Robertson, B. E., & Hernquist, L. 2008, MNRAS, 391, 481, doi: 10.1111/j.1365-2966.2008.13805.x
- Springel et al. (2005) Springel, V., Di Matteo, T., & Hernquist, L. 2005, ApJ, 620, L79, doi: 10.1086/428772
- Stasinska et al. (2006) Stasinska, G., Cid Fernandes, R., Mateus, A., Sodre, Laerte, J., & Asari, N. V. 2006, Mon. Not. Roy. Astron. Soc., 371, 972, doi: 10.1111/j.1365-2966.2006.10732.x
- Steinborn et al. (2018) Steinborn, L. K., Hirschmann, M., Dolag, K., et al. 2018, MNRAS, 481, 341, doi: 10.1093/mnras/sty2288
- Treister et al. (2012) Treister, E., Schawinski, K., Urry, C. M., & Simmons, B. D. 2012, ApJ, 758, L39, doi: 10.1088/2041-8205/758/2/L39
- Tremonti et al. (2004) Tremonti, C. A., Heckman, T. M., Kauffmann, G., et al. 2004, ApJ, 613, 898, doi: 10.1086/423264
- Urrutia et al. (2008) Urrutia, T., Lacy, M., & Becker, R. H. 2008, ApJ, 674, 80, doi: 10.1086/523959
- Villforth et al. (2014) Villforth, C., Hamann, F., Rosario, D. J., et al. 2014, MNRAS, 439, 3342, doi: 10.1093/mnras/stu173
- Webb et al. (2020) Webb, N. A., Coriat, M., Traulsen, I., et al. 2020, A&A, 641, A136, doi: 10.1051/0004-6361/201937353
- Weigel et al. (2018) Weigel, A. K., Schawinski, K., Treister, E., Trakhtenbrot, B., & Sanders, D. B. 2018, MNRAS, 476, 2308, doi: 10.1093/mnras/sty383
- Weston et al. (2017) Weston, M. E., McIntosh, D. H., Brodwin, M., et al. 2017, MNRAS, 464, 3882, doi: 10.1093/mnras/stw2620
- Woods & Geller (2007) Woods, D. F., & Geller, M. J. 2007, AJ, 134, 527, doi: 10.1086/519381
- Wright et al. (2010) Wright, E. L., Eisenhardt, P. R. M., Mainzer, A. K., et al. 2010, AJ, 140, 1868, doi: 10.1088/0004-6256/140/6/1868
- Yan et al. (2013) Yan, L., Donoso, E., Tsai, C.-W., et al. 2013, AJ, 145, 55, doi: 10.1088/0004-6256/145/3/55
- Yan & Blanton (2012) Yan, R., & Blanton, M. R. 2012, ApJ, 747, 61, doi: 10.1088/0004-637X/747/1/61
- York et al. (2000) York, D. G., Adelman, J., Anderson, John E., J., et al. 2000, AJ, 120, 1579, doi: 10.1086/301513