Multi-stage reconnection powering a solar coronal jetJournal: ApJFacilities: SDO/AIA, Solar Orbiter EUISSW/IDL (Freeland & Handy 1998)
Abstract
Coronal jets are short-lived eruptive features commonly observed in polar coronal holes and are thought to play a key role in the transfer of mass and energy into the solar corona. We describe unique contemporaneous observations of a coronal blowout jet seen by the Extreme Ultraviolet Imager onboard the Solar Orbiter spacecraft (SO/EUI) and the Atmospheric Imaging Assembly onboard the Solar Dynamics Observatory (SDO/AIA). The coronal jet erupted from the south polar coronal hole, and was observed with high spatial and temporal resolution by both instruments. This enabled identification of the different stages of a breakout reconnection process producing the observed jet. We find bulk plasma flow kinematics of 100–200 km s-1 across the lifetime of its observed propagation, with a distinct kink in the jet where it impacted and was subsequently guided by a nearby polar plume. We also identify a faint faster feature ahead of the bulk plasma motion propagating with a velocity of 715 km s-1 which we attribute to untwisting of newly reconnected field lines during the eruption. A Differential Emission Measure (DEM) analysis using the SDO/AIA observations revealed a very weak jet signal, indicating that the erupting material was likely much cooler than the coronal passbands used to derive the DEM. This is consistent with the very bright appearance of the jet in the Lyman- passband observed by SO/EUI. The DEM was used to estimate the radiative thermal energy of the source region of the coronal jet, finding a value of ergs, comparable to the energy of a nanoflare.
I Introduction
Coronal jets are collimated ejections of plasma from the solar atmosphere that could escape into the heliosphere. Typically observed using extreme ultraviolet (EUV) (Alexander & Fletcher 1999; Nisticò et al. 2009; Chandrashekhar et al. 2014, e.g.,) or X-ray (Shibata et al. 1992; Shimojo et al. 1996; Cirtain et al. 2007; Sterling et al. 2015, e.g.,) observations, they are better observed in coronal holes, due to the lower background intensity making them easier to identify (Savcheva et al. 2007, e.g.,). They are the subject of detailed investigation, as they offer a mechanism for transferring mass and energy to the outer corona and solar wind (Shen 2021, cf.). They also represent an opportunity to study smaller scale evolution of the mechanisms involved in larger solar eruptions, with recent observations (Nisticò et al. 2009; Sterling et al. 2015, e.g.,) and simulations (Wyper et al. 2017; Wyper et al. 2018, e.g.,) suggesting that coronal jets can be interpreted as being produced by the eruption of mini-filaments via breakout reconnection. A detailed overview of observations and modelling of coronal jets can be found in the recent reviews by Raouafi et al. 2016 and Shen 2021.

Coronal jets are typically identified as being divided into two distinct types, “standard” and “blowout” jets (Moore et al. 2010, cf.), based on morphological behaviour. Standard jets follow the model originally proposed by Shibata et al. 1992, with a narrow spire that remains thin throughout the lifetime of the jet, a relatively dim source region, and no emission in the cooler 304 Å passband. In contrast, blowout jets initially behave as standard jets, with the spire subsequently broadening to match the width of the footpoints. Blowout jets have also been observed to produce emission in the 304 Å passband, with Moore et al. 2010 suggesting that reconnection as a result of an emerging bipole which drives the jet could release the overlying magnetic field and enable the observed surge (i.e., the eruption of cooler material). This cooler material has traditionally been identified using the 304 Å passband, but Alexander & Fletcher 1999 presented observations of a coronal jet made using the Lyman- 1216 Å passband from the Transition Region And Coronal Explorer (Handy et al. 1999, TRACE;). In this case, the jet produced bright emission in the Lyman- passband, and could be tracked at a cadence of 60 s.
The multiple coronal extreme ultraviolet (EUV) passbands provided by the Atmospheric Imaging Assembly (Lemen et al. 2012, AIA;) onboard the Solar Dynamics Observatory (Pesnell et al. 2012, SDO;) has enabled the development of multiple techniques to estimate plasma parameters such as density and temperature using differential emission measure (Aschwanden et al. 2013; Hannah & Kontar 2012; Hannah & Kontar 2013; Plowman et al. 2013; Cheung et al. 2015; Pickering & Morgan 2019, DEM; see, e.g., the codes developed by). This has enabled many plasma diagnostic studies of different solar phenomena, including coronal jets (Chen et al. 2013; Zhang & Ji 2014; Joshi et al. 2020, e.g.,). More recently, DEM analysis has also been used to probe the radiative thermal energy released during solar nanoflares, with Purkhart & Veronig 2022 finding an energy range of – erg for 30 SDO/AIA image series between 2011 and 2018. The high spatial and temporal resolution provided by SDO/AIA has also enabled a detailed investigation of the evolution of coronal jets (Morton et al. 2012b; Morton et al. 2012a; Chen et al. 2012, cf.). The High Resolution Imager (HRI) component of the Extreme Ultraviolet Imager (Rochus et al. 2020, EUI;) onboard the Solar Orbiter (Müller et al. 2020) spacecraft will enable much higher spatial and temporal resolution studies of solar phenomena in its 174 Å and Lyman- passbands. Already this is providing new insights into very small features associated with polar coronal jets (Mandal et al. 2022, e.g.,), offering sub-arcsecond imaging of these features.
In this work, we use a combination of observations from Solar Orbiter EUI and SDO/AIA to examine the initial evolution of a small scale coronal jet erupting from the southern polar coronal hole. The event is described in section II, with an analysis of the observations presented in section III before some conclusions are drawn in section IV.
II Observations and Data Analysis
The coronal jet discussed here erupted from the south pole of the Sun on 2021-Sept-14 beginning at 05:59:02 UT as observed by Solar Orbiter EUI11 1 Note that the distances of the individual spacecraft from the Sun meant that phenomena were observed at different times by the different spacecraft, so to avoid confusion, we will use the time at Earth throughout this discussion.. At the time, Solar Orbiter was located at 0.587 astronomical units from the Sun at an angle of 47.372 degrees behind the Earth, and was doing a calibration manoeuvre, pointing at the North and South Poles, and East and West limbs to enable cross-calibration of the different high-resolution telescopes. The erupting jet was observed by both the 174 Å and Lyman- passbands with an image scale of 0.492″ (1.028″) per pixel in the 174 Å (Lyman-) passbands, and a temporal resolution of 5 s (see top row of Figure 1). For the analysis described here, we used the calibrated level-2 EUI/HRI data from EUI Data Release 4.22 2 https://doi.org/10.24414/s5da-7e78
The jet was also well observed by SDO/AIA, with the eruption starting at 06:02:30 UT as observed near Earth. SDO/AIA has an image scale of 0.6″ per pixel at a 12 s cadence in each of the 7 EUV passbands (94, 131, 171, 193, 211, 304, 335 Å), with the data presented here processed using the standard aia_prep.pro routine contained within SolarSoftWare (Freeland & Handy 1998). The eruption was well observed by the 304, 171, and 193 Å passbands (with their temperature response functions peaking at T, , and respectively), and was also identifiable using the 211 Å passband (T) as shown in the middle and bottom rows of Figure 1, with no signal apparent within the 94, 131, or 335 Å passbands (T, , and respectively). Note that a full description of the response function for each of the AIA passbands can be found in Boerner et al. 2012.
III Results
The erupting jet is shown as observed using multiple passbands at 06:04:52 UT in Figure 1, with the temporal evolution of the jet shown in more detail in the associated animation movie_0.mp4. The jet has a clear “” style morphology (see e.g., Raouafi et al. 2016, for details), with each passband also showing an apparent kink in the jet following its initial eruption as indicated by the white arrows. Inspection of the temporal evolution of the jet eruption using the larger field of view provided by SDO/AIA suggests that this kinking is due to the erupting jet interacting with a nearby very faint polar plume, which deflects the initially laterally propagating jet. As observed by EUI/HRI, the initially narrow jet reverses its propagation in the direction parallel to the solar limb and starts to expand. This is apparent in both the 174 Å and Lyman- passbands, with the higher resolution of the 174 Å passband also suggesting a slight untwisting of the jet as it initially erupts.
This overall behaviour of the jet is also seen in the SDO/AIA passbands shown in Figure 1, with the different viewpoint and additional passbands providing additional information. From this viewpoint, the clear nonradial motion is consistent with its interpretation as a “” style jet. The jet also appears to be guided radially outward from the Sun following the kinked evolution (although the kinking is less pronounced here), with little to none of the spreading observed by EUI/HRI. This lack of spread in the jet in AIA images could be due to the line-of-sight effects. While the jet can be identified in the 193 Å and 211 Å passbands (observing plasma at 1–2 MK), it is clearest in the 171 Å and particularly the 304 Å passbands, suggesting that the feature is likely composed of cooler plasma, which is consistent with the clear identification of the jet in the EUI/HRI Lyman-alpha passband.
III.1 Initial evolution

The very high spatial and temporal cadence of the EUI/HRI 174 Å passband enables a detailed analysis of the initial stages of the jet eruption, as shown in Figure 2. Prior to the onset of the eruption, overarching loops above the coronal bright point can be identified, as shown in Figure 2a. Within 60 s, the reconnection process has begun, with the eruption of the mini-filament identifiable in Figure 2b. This mini-filament then interacts with the overlying loops to drive breakout reconnection as shown in the image 5 s later (Figure 2c). This can be seen as rapid disconnection and opening of the overarching loops.
The result of bi-directional flows induced by this breakout reconnection can be seen in the evolution of small plasmoid-like blobs draining from the reconnection site down the legs of the overarching loops to the solar surface (as indicated by the unidirectional white arrows in Figure 2d-e). Meanwhile the mini-filament continues to erupt, with its spine indicated by the bi-directional arrow in panels e-j of Figure 2. However, as it erupts, its legs start to stretch (Figure 2g) and subsequently break, producing bright side lobes (Figure 2h-i). This enables the eruption of more plasmoid material into the erupting jet (indicated by the red arrow in Figure 2h & i and then by the white arrow in Figure 2j-l) which then evolves out into the solar atmosphere.
In total, this process takes 140 s from the onset of the eruption to the erupting plasma escaping out into the outer corona, with the very high temporal and spatial resolution of EUI/HRI enabling a detailed analysis of the different reconnection stages of the initiation process. While the same process was also observed by the Lyman- passband, the lower spatial resolution and very high intensity of the plasma in this passband made it difficult to make a direct comparison of this small-scale behaviour. The difference between the two passbands can be seen in panels a & c of Figure 1, with the small-scale loop features identifiable in the 174 Å image (panel c) not as apparent in the Lyman- image (panel a).
III.2 Jet kinematics

Once the plasma from the jet had been ejected via the breakout reconnection process, the next step was to quantify its evolution. A series of distance-time stack plots were used to further examine the temporal evolution of the jet as shown in Figures 3 and 4 respectively. The initial evolution of the jet close to the origin was examined using observations from EUI/HRI as shown in Figure 3. The top row of Figure 3 shows individual snapshots of the initial stages of the erupting jet as observed by EUI/HRI 174 Å (panel a) and EUI/HRI Lyman- (panel b) at 06:03:48 UT. Panels c & d then show the distance-time stack plot along the white box indicated in panels a & b. The white fiducial lines here indicate that the jet had an initial velocity of 166 km s-1 as observed by both EUI/HRIEUV and EUI/HRILYA.
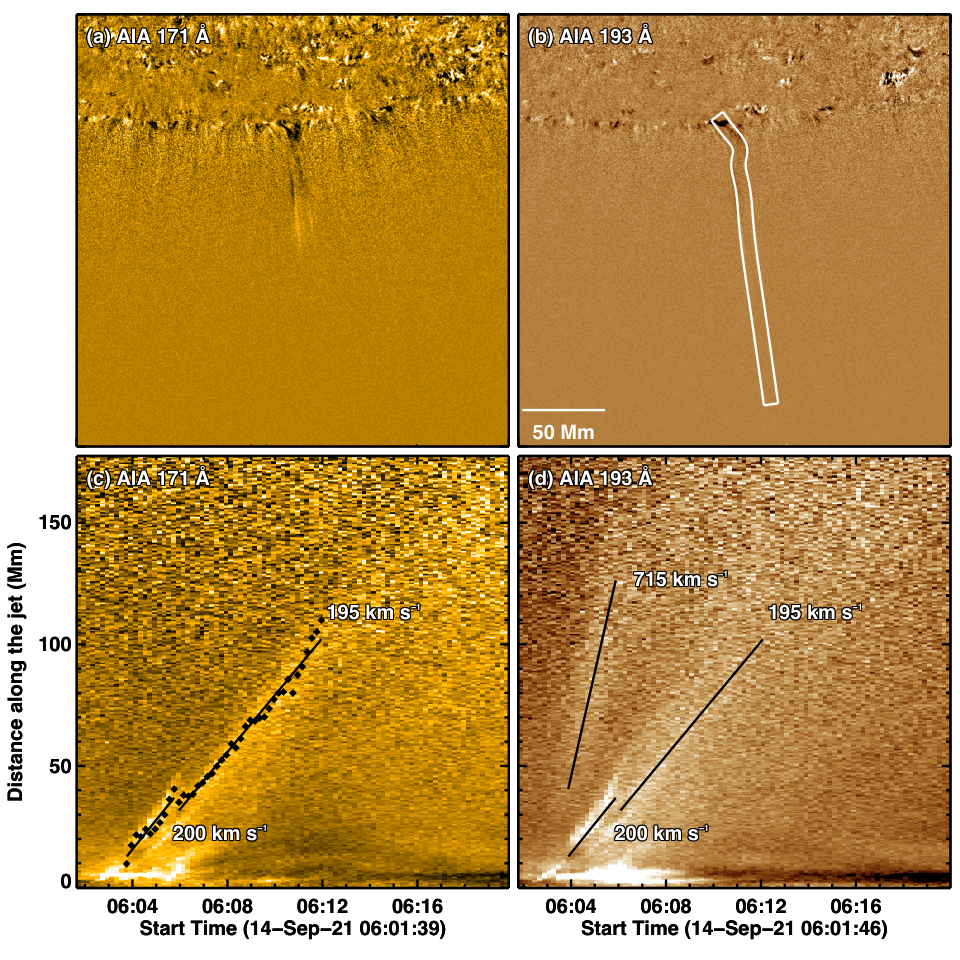
Following this initial evolution, the longer term evolution of the erupting jet was tracked using the larger field of view of SDO/AIA (see Figure 4). Here, the top row shows the evolution of the erupting jet, with the bottom row showing distance-time stackplots along the white region defined in panel b for the 171 Å (left column) and 193 Å (right column) passbands. The bright jet feature was then identified in the stackplots as the positions or points of the maximum intensity associated with the jet at each time-step (as shown with symbols in panel c for the 171 Å passband). These points were then fitted using a linear fit to derive the kinematics. This reveals a slight deceleration in the evolution of the jet as observed by both passbands, from 200 km s-1 close to the source to 195 km s-1 further out following the interaction with the nearby faint streamer.
Although care has been taken to try and ensure that the same feature was identified using the datasets from the different spacecraft, there may be several reasons why the derived kinematics differ slightly. The EUI/HRI observations are taken very close to the source of the erupting jet while the SDO/AIA observations cover a much longer distance and therefore timeframe. The angle of the evolution of the jet with respect to the plane of sky will also affect the kinematics derived using each instrument.
While both SDO/AIA passbands in Figure 4 show a feature propagating outward from the Sun with a fitted velocity of 200 km s-1, it is also possible to identify a very faint feature in the 193 Å passband with a velocity of 715 km s-1 propagating ahead of the jet. This feature is not very clear in the SDO/AIA observations presented here, and could not be easily identified in coronagraph images from the LASCO C2 coronagraph onboard the SOHO spacecraft, making it difficult to quantify. However, this feature is consistent with the previous observations by Cirtain et al. 2007 of two velocities associated with x-ray jets from a polar coronal hole. Pariat et al. 2015 subsequently suggested that an inclined solar jet could produce a standard jet followed by a helical jet due to the untwisting of newly reconnected magnetic field lines as the eruption evolves. This standard jet could then be observed as a wave travelling at a phase speed close to the local Alfvén speed (Cirtain et al. 2007, 800 km s-1 as measured in X-ray observations by), with the helical (or blowout) jet observed as a bulk plasma flow travelling at a fraction of the phase speed. The faint feature observed here using EUV observations can therefore be interpreted as the standard jet wave simulated by Pariat et al. 2015 and observed in X-rays by Cirtain et al. 2007.
III.3 Differential Emission Measure analysis

The evolution of the jet plasma was examined in more detail using a Differential Emission Measure (DEM) approach in order to quantify how the temperature and density of the jet plasma evolved with time. The DEM is defined as,
| (1) |
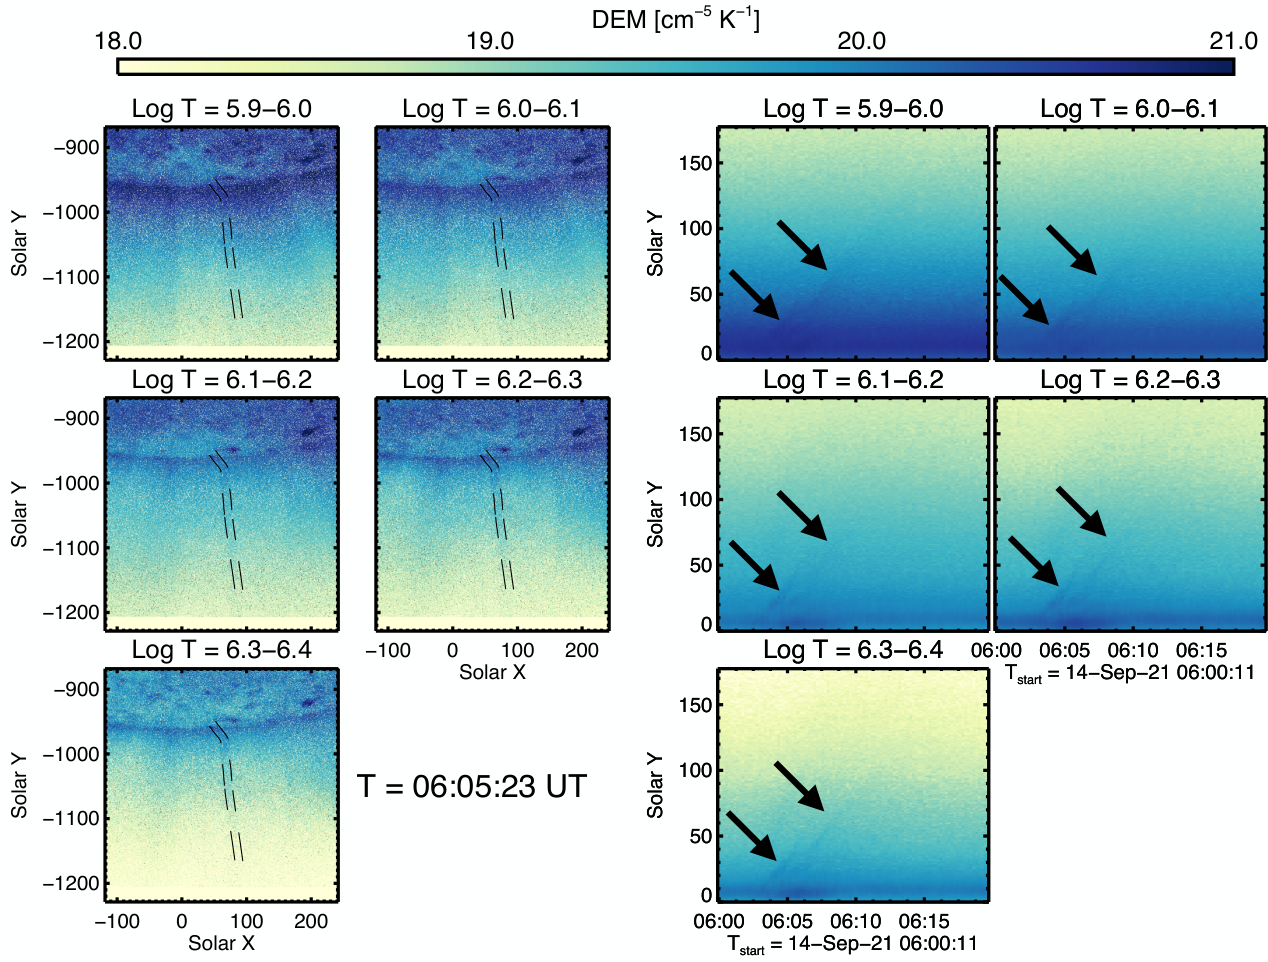
where is the electron number density and is the line of sight depth. Computing DEMs from observations is an ill-posed problem, and multiple techniques have been described to try and solve it using observations from SDO/AIA (see, e.g., Long et al. 2021, for more details). In this case, we used the Regularised Inversion technique developed by Hannah & Kontar 2012; Hannah & Kontar 2013 to derive the differential emission measure of the field of view shown in Figure 1. A selection of the resulting DEMs can be seen in Figure 5 for temperatures of – K in bins of K. Note that above this temperature it was not possible to identify any signature of the erupting jet feature. The left two columns in Figure 5 show the DEM images in each temperature bin at t UT, with the right two columns showing the temporal evolution of the DEM in each temperature bin for the region shown in Figure 4b used to calculate the kinematics of the jet eruption as observed by SDO/AIA. Although very faint, a signature of the jet eruption can be identified in the different DEM temperature bins shown here, with the feature identified by arrows in each DEM stackplot to help guide the eye. This faint feature matches the feature observed in Figure 4 propagating at a velocity of 200 km s-1, with no evidence of the faster feature identified in the 193 Å shown in Figure 4d.
To try and further understand the plasma evolution of the jet, the EM-weighted temperature and density of the field of view was estimated using the approach of Vanninathan et al. 2015; Long et al. 2019. The EM-weighted electron number density can be defined as,
| (2) |
where is the plasma scale height, while the DEM-weighted temperature can defined as,
| (3) |
(Cheng et al. 2012, see, e.g.,). The resulting temperature and number density stackplots along the jet region highlighted in Figure 4b are shown in panels a and b of Figure 6 respectively. The erupting jet can be identified (and is highlighted using arrows to help guide the eye), but is again very faint in both number density and temperature plots. A profile of both temperature and density along the white dashed line shown in Figure 6a & b is shown in black in panels c & d for temperature and number density respectively. In both cases the temporal evolution is very noisy, and a heavily smoothed line has been added in red to highlight the slight increase above the background corresponding to the passage of the jet feature.
III.4 Helical Morphology of the Jet and Link to Switchbacks
An apparent helical (or kink, twist) morphology of the jet material can be seen in panels a–d of Figure 1. Such morphologies in jets are not uncommon, as noted by e.g., Shimojo et al. 1996; Wang et al. 1998; Veselovsky et al. 1999; Jiang et al. 2007; Moore et al. 2015. They suggest the presence of helical or kinked magnetic field lines, similar to structures observed in erupting prominences. We note that the jet is also visible in the Lyman- HRI channel (Figure 1a, b), indicating that a part of the erupting material is at chromospheric or transition region temperatures (Canfield et al. 1996; Sterling et al. 2015, see e.g.,). As noted above, helical field lines in jets are usually interpreted as the result of interchange reconnection of large-scale open coronal hole field lines with small-scale closed field lines at the coronal base (Pariat et al. 2009).
The kinked magnetic field lines in jets may be linked to the magnetic field switchbacks that are frequently observed in the near-Sun solar wind by the Parker Solar Probe mission (Kasper et al. 2019; Bale et al. 2019, PSP;). Switchbacks represent significant deviations of the magnetic field from the nominal Parker spiral, which in extreme cases may result in the inversion of the radial component of the magnetic field. The link of coronal jets with switchbacks was suggested by Sterling & Moore 2020 who argued that slightly kinked magnetic field lines resulting from the interchange reconnection may evolve to switchbacks as they propagate in the heliosphere.
The size of the observed kinked jet in the transverse (i.e. perpendicular to the radial) direction can be estimated from Figure 1c to be around 6103 km. At this moment, the jet is located at 1.03 from the centre of the Sun. Assuming the radial expansion of structures propagating outwards, the transverse size of the corresponding feature at 35.7 (the distance of the first perihelion of Parker Solar Probe) would be around 7106 km. This is much larger than the transverse scale of switchbacks at this distance from the Sun, which is reported to be around 104 km (Horbury et al. 2020). However, Figure 1c shows that the jet does not look like a single kinked feature, but rather has a developed fine structure with many individual sub-features at scales down to a few HRI pixels, oriented at different directions with respect to the radial. If a kink has the minimal resolved transverse size of two HRI pixels (i.e. around 400 km at the time of our observations), then its radial expansion would lead to the switchback transverse size of around 5105 km at 35.7 . This size is still an order of magnitude larger than the maximal switchback size (not necessarily in the transverse direction) of 7104 km inferred by Horbury et al. 2020. This means that the origin of individual switchbacks in the corona cannot be resolved by HRI, even if non-radial structures at the resolved scales of the jet may suggest the presence of helical fields at even smaller scales. The situation will improve only slightly at the closest perihelion of Solar Orbiter around 0.284 au, as the linear spatial resolution of HRI observations will be only a factor two better than that of the observations taken at 0.587 au reported here.
Another important scale is that of switchback patches, which contain multiple smaller-scale switchbacks (Bale et al. 2021). Each switchback patch typically corresponds to the supergranulation scales of around 3∘–5∘ in heliographic longitude (Bale et al. 2021), which is a few times larger than the transverse size of our jet (around 0.5∘). The jet reported in this study therefore corresponds to an intermediate scale situated between the scales of individual switchbacks and the switchback patches.
IV Discussion & Conclusions
As part of its commissioning activities taking observations of the southern polar coronal hole on 2021-Sept-14, Solar Orbiter/EUI observed a small coronal hole jet eruption with very high spatial and temporal resolution. Despite the difference in spacecraft position, the jet was also well observed by SDO/AIA, enabling a multi-viewpoint, multi-thermal analysis of the eruption. In both cases, the jet was observed to initially erupt almost laterally, with a clear kink seen in the jet evolution as it impacted a nearby polar plume observed by both EUI/HRI and SDO/AIA (see movie_0.mp4 associated with Figure 1). The jet was then observed by SDO/AIA to evolve radially away from the Sun, while the jet appeared to reverse its propagation in the direction parallel to the solar limb while propagating outward from the Sun as observed by EUI/HRI.
The very high spatial and temporal resolution provided by EUI/HRI in the 174 Å passband enabled a detailed analysis of the initiation of the jet. As outlined in Figure 2, the jet formed as a result of breakout reconnection between the erupting mini-filament and a small overlying loop system. This resulted in the further stretching and reconnection along the erupting filament, with small plasmoid-like blobs visible flowing away from the site of the reconnection down the legs of the loop system. This reconnection opened the overlying magnetic field which then enabled the eruption of the jet itself. Although the process was also observed using the Lyman- passband, the lower resolution and bright nature of the plasma in this passband meant that it was not possible to discern any fine structure comparable to that observed using the 174 Å passband.
As observed in Figures 3 and 4, the jet displays slightly different kinematics when observed by SDO/AIA and EUI/HRI. Figure 3 shows the initial evolution of the jet observed close to the source prior to the interaction with the nearby polar plume as seen by EUI/HRI 174 Å and Lyman-, with Figure 4 showing the longer term evolution of the jet as observed by SDO/AIA. These figures suggest a constant linear velocity for the jet of 165-200 km s-1, with the slight differences between the observations from the two spacecraft most likely due to the different angle of observation, with the jet exhibiting different kinematics when propagating out of the plane of sky as seen from different perspectives. The jet was also best observed using the cooler passbands available from both SDO/AIA and EUI/HRI, with a very clear jet seen in both AIA 304 Å and HRI Lyman-, although it was possible to discern a fainter feature in the 171/174 Å, 193 Å, and 211 Å passbands. A very faint feature was also observed in the SDO/AIA 193 Å passband propagating away from the origin with a velocity of 715 km s-1 as shown in Figure 4. This is consistent with the previous observations in X-rays by Cirtain et al. 2007 and simulations of Pariat et al. 2015 of a wave travelling at a phase velocity close to the Alfvén speed ahead of bulk plasma motion in a coronal jet, and implies that the jet is the result of interchange reconnection between open and closed magnetic field in the corona, consistent both with the blowout jet interpretation, and the unique high resolution EUI/HRI observations in EUV of the breakout reconnection in the initial stages of the eruption, and the observations of an initial untwisting of the jet as it erupted. Although this behaviour could be linked to the switchbacks detected by PSP, the size of the kink observed here is much larger than the typical switchback size measured by Horbury et al. 2020.
While the jet can be clearly seen in the individual passbands shown in Figure 1, it was much more difficult to identify using the derived differential emission measure, as can be seen in Figure 5. The jet can be identified using the temperature bins shown in the figure, but no signal was observed in the temperature bins above 106.4 K. A further analysis of the emission measure weighted temperature and number density (as shown in Figure 6) show that a slight increase in both temperature and density could be identified associated with the passage of the jet, but it was very small in both cases. These observations, combined with the very clear presentation of the jet in the 304 Å passband observed by SDO/AIA and the Lyman- observed by EUI/HRI, indicate that the jet primarily consisted of cooler material which was below the threshold of the DEM calculated using SDO/AIA observations. This indicates that the jet was erupting chromospheric material, again consistent with a blowout jet interpretation.
However, the DEM derived from SDO/AIA can also be used to estimate the radiative thermal energy associated with the onset of the jet eruption. As discussed by Benz & Krucker 1999 and more recently by Purkhart & Veronig 2022, it is possible to estimate the radiative thermal energy released during a coronal brightening using the evolution of emission measure via the equation,
| (4) |
where is Boltzmann’s constant, is the temperature during the peak of the EM evolution, is the change in integrated emission measure relative to the pre-event value measured in cm-5, is the total line of sight thickness of the event, is the total area of the event, and is the filling factor, representing the difference between observed and actual volumes occupied by the emitting plasma. As this is difficult to accurately estimate, and does not measurably affect the estimated energy, we have assumed a filling factor of 1 (Parnell & Jupp 2000; Purkhart & Veronig 2022, cf.). The region chosen here as corresponding to the onset of the jet eruption is indicated by the blue square in Figure 1e, with the temporal evolution of the integrated emission measure in this region shown in Figure 6e. Note that due to the highly variable nature of the evolution of the emission measure, the was defined using the change between the start and peak of the smoothed red dashed line shown in Figure 6e. We also followed the lead of Purkhart & Veronig 2022, assuming a line of sight distance , after Benz & Krucker 1999. From equation 4, we derived a radiative thermal energy for the source region of the coronal jet of ergs, comparable to the energy of a nanoflare (Chitta et al. 2021, see e.g.). However, it is worth noting that this is most likely an underestimation of the true radiative thermal energy produced by the source region. The jet in this case erupted from very close to the limb, but still on-disk as observed by SDO/AIA, and this close proximity to the limb leads to an increased absorption of the EUV radiation along the line of sight to the observer.
These observations highlight the importance of high time cadence observations with very high spatial resolution when studying the evolution of small scale features in the solar atmosphere. The HRI/EUV observations of the erupting jet presented here show the different stages of the breakout reconnection process which led to the eruption of the jet in very fine detail, and reveal untwisting of the jet as it erupts, while the Lyman- observations show the cool nature of the erupting plasma. The additional point-of-view of Solar Orbiter is also very useful, as it highlights the interaction of the erupting jet with the nearby polar plume; behaviour that would have been missed if only observations from SDO/AIA were used to study the jet. However, the multiple passbands provided by SDO/AIA are vital for understanding the plasma diagnostics associated with the erupting jet, and for estimating the energy released during the eruption. The combination of observations from both SDO and Solar Orbiter will offer new insights into coronal jets, particularly as Solar Orbiter moves out of the solar ecliptic towards the poles.
References
- Alexander & Fletcher (1999) Alexander, D., & Fletcher, L. 1999, Sol. Phys., 190, 167, doi: 10.1023/A:1005213826793
- Aschwanden et al. (2013) Aschwanden, M. J., Boerner, P., Schrijver, C. J., & Malanushenko, A. 2013, Sol. Phys., 283, 5, doi: 10.1007/s11207-011-9876-5
- Bale et al. (2019) Bale, S. D., Badman, S. T., Bonnell, J. W., et al. 2019, Nature, 576, 237, doi: 10.1038/s41586-019-1818-7
- Bale et al. (2021) Bale, S. D., Horbury, T. S., Velli, M., et al. 2021, ApJ, 923, 174, doi: 10.3847/1538-4357/ac2d8c
- Benz & Krucker (1999) Benz, A. O., & Krucker, S. 1999, A&A, 341, 286
- Boerner et al. (2012) Boerner, P., Edwards, C., Lemen, J., et al. 2012, Sol. Phys., 275, 41, doi: 10.1007/s11207-011-9804-8
- Canfield et al. (1996) Canfield, R. C., Reardon, K. P., Leka, K. D., et al. 1996, ApJ, 464, 1016, doi: 10.1086/177389
- Chandrashekhar et al. (2014) Chandrashekhar, K., Morton, R. J., Banerjee, D., & Gupta, G. R. 2014, A&A, 562, A98, doi: 10.1051/0004-6361/201322408
- Chen et al. (2012) Chen, H.-D., Zhang, J., & Ma, S.-L. 2012, Research in Astronomy and Astrophysics, 12, 573, doi: 10.1088/1674-4527/12/5/009
- Chen et al. (2013) Chen, N., Ip, W.-H., & Innes, D. 2013, ApJ, 769, 96, doi: 10.1088/0004-637X/769/2/96
- Cheng et al. (2012) Cheng, X., Zhang, J., Saar, S. H., & Ding, M. D. 2012, ApJ, 761, 62, doi: 10.1088/0004-637X/761/1/62
- Cheung et al. (2015) Cheung, M. C. M., Boerner, P., Schrijver, C. J., et al. 2015, ApJ, 807, 143, doi: 10.1088/0004-637X/807/2/143
- Chitta et al. (2021) Chitta, L. P., Peter, H., & Young, P. R. 2021, A&A, 647, A159, doi: 10.1051/0004-6361/202039969
- Cirtain et al. (2007) Cirtain, J. W., Golub, L., Lundquist, L., et al. 2007, Science, 318, 1580, doi: 10.1126/science.1147050
- Freeland & Handy (1998) Freeland, S. L., & Handy, B. N. 1998, Sol. Phys., 182, 497, doi: 10.1023/A:1005038224881
- Handy et al. (1999) Handy, B. N., Acton, L. W., Kankelborg, C. C., et al. 1999, Sol. Phys., 187, 229, doi: 10.1023/A:1005166902804
- Hannah & Kontar (2012) Hannah, I. G., & Kontar, E. P. 2012, A&A, 539, A146, doi: 10.1051/0004-6361/201117576
- Hannah & Kontar (2013) —. 2013, A&A, 553, A10, doi: 10.1051/0004-6361/201219727
- Horbury et al. (2020) Horbury, T. S., Woolley, T., Laker, R., et al. 2020, ApJS, 246, 45, doi: 10.3847/1538-4365/ab5b15
- Jiang et al. (2007) Jiang, Y. C., Chen, H. D., Li, K. J., Shen, Y. D., & Yang, L. H. 2007, A&A, 469, 331, doi: 10.1051/0004-6361:20053954
- Joshi et al. (2020) Joshi, R., Chandra, R., Schmieder, B., et al. 2020, A&A, 639, A22, doi: 10.1051/0004-6361/202037806
- Kasper et al. (2019) Kasper, J. C., Bale, S. D., Belcher, J. W., et al. 2019, Nature, 576, 228, doi: 10.1038/s41586-019-1813-z
- Lemen et al. (2012) Lemen, J. R., Title, A. M., Akin, D. J., et al. 2012, Sol. Phys., 275, 17, doi: 10.1007/s11207-011-9776-8
- Long et al. (2019) Long, D. M., Jenkins, J., & Valori, G. 2019, ApJ, 882, 90, doi: 10.3847/1538-4357/ab338d
- Long et al. (2021) Long, D. M., Reid, H. A. S., Valori, G., & O’Kane, J. 2021, ApJ, 921, 61, doi: 10.3847/1538-4357/ac1cdf
- Mandal et al. (2022) Mandal, S., Chitta, L. P., Peter, H., et al. 2022, A&A, 664, A28, doi: 10.1051/0004-6361/202243765
- Moore et al. (2010) Moore, R. L., Cirtain, J. W., Sterling, A. C., & Falconer, D. A. 2010, ApJ, 720, 757, doi: 10.1088/0004-637X/720/1/757
- Moore et al. (2015) Moore, R. L., Sterling, A. C., & Falconer, D. A. 2015, ApJ, 806, 11, doi: 10.1088/0004-637X/806/1/11
- Morgan & Druckmüller (2014) Morgan, H., & Druckmüller, M. 2014, Sol. Phys., 289, 2945, doi: 10.1007/s11207-014-0523-9
- Morton et al. (2012a) Morton, R. J., Srivastava, A. K., & Erdélyi, R. 2012a, A&A, 542, A70, doi: 10.1051/0004-6361/201117218
- Morton et al. (2012b) Morton, R. J., Verth, G., McLaughlin, J. A., & Erdélyi, R. 2012b, ApJ, 744, 5, doi: 10.1088/0004-637X/744/1/5
- Müller et al. (2020) Müller, D., St. Cyr, O. C., Zouganelis, I., et al. 2020, A&A, 642, A1, doi: 10.1051/0004-6361/202038467
- Nisticò et al. (2009) Nisticò, G., Bothmer, V., Patsourakos, S., & Zimbardo, G. 2009, Sol. Phys., 259, 87, doi: 10.1007/s11207-009-9424-8
- Pariat et al. (2009) Pariat, E., Antiochos, S. K., & DeVore, C. R. 2009, ApJ, 691, 61, doi: 10.1088/0004-637X/691/1/61
- Pariat et al. (2015) Pariat, E., Dalmasse, K., DeVore, C. R., Antiochos, S. K., & Karpen, J. T. 2015, A&A, 573, A130, doi: 10.1051/0004-6361/201424209
- Parnell & Jupp (2000) Parnell, C. E., & Jupp, P. E. 2000, ApJ, 529, 554, doi: 10.1086/308271
- Pesnell et al. (2012) Pesnell, W. D., Thompson, B. J., & Chamberlin, P. C. 2012, Sol. Phys., 275, 3, doi: 10.1007/s11207-011-9841-3
- Pickering & Morgan (2019) Pickering, J., & Morgan, H. 2019, Sol. Phys., 294, 136, doi: 10.1007/s11207-019-1526-3
- Plowman et al. (2013) Plowman, J., Kankelborg, C., & Martens, P. 2013, ApJ, 771, 2, doi: 10.1088/0004-637X/771/1/2
- Purkhart & Veronig (2022) Purkhart, S., & Veronig, A. M. 2022, A&A, 661, A149, doi: 10.1051/0004-6361/202243234
- Raouafi et al. (2016) Raouafi, N. E., Patsourakos, S., Pariat, E., et al. 2016, Space Sci. Rev., 201, 1, doi: 10.1007/s11214-016-0260-5
- Rochus et al. (2020) Rochus, P., Auchère, F., Berghmans, D., et al. 2020, A&A, 642, A8, doi: 10.1051/0004-6361/201936663
- Savcheva et al. (2007) Savcheva, A., Cirtain, J., Deluca, E. E., et al. 2007, PASJ, 59, S771, doi: 10.1093/pasj/59.sp3.S771
- Shen (2021) Shen, Y. 2021, Proceedings of the Royal Society of London Series A, 477, 217, doi: 10.1098/rspa.2020.0217
- Shibata et al. (1992) Shibata, K., Ishido, Y., Acton, L. W., et al. 1992, PASJ, 44, L173
- Shimojo et al. (1996) Shimojo, M., Hashimoto, S., Shibata, K., et al. 1996, PASJ, 48, 123, doi: 10.1093/pasj/48.1.123
- Sterling & Moore (2020) Sterling, A. C., & Moore, R. L. 2020, ApJ, 896, L18, doi: 10.3847/2041-8213/ab96be
- Sterling et al. (2015) Sterling, A. C., Moore, R. L., Falconer, D. A., & Adams, M. 2015, Nature, 523, 437, doi: 10.1038/nature14556
- Vanninathan et al. (2015) Vanninathan, K., Veronig, A. M., Dissauer, K., et al. 2015, ApJ, 812, 173, doi: 10.1088/0004-637X/812/2/173
- Veselovsky et al. (1999) Veselovsky, I. S., Zhukov, A. N., Koutchmy, S., Delannée, C., & Delaboudinière, J. P. 1999, in ESA Special Publication, Vol. 446, 8th SOHO Workshop: Plasma Dynamics and Diagnostics in the Solar Transition Region and Corona, ed. J. C. Vial & B. Kaldeich-Schürmann, 675
- Wang et al. (1998) Wang, Y. M., Sheeley, N. R., J., Socker, D. G., et al. 1998, ApJ, 508, 899, doi: 10.1086/306450
- Wyper et al. (2017) Wyper, P. F., Antiochos, S. K., & DeVore, C. R. 2017, Nature, 544, 452, doi: 10.1038/nature22050
- Wyper et al. (2018) Wyper, P. F., DeVore, C. R., & Antiochos, S. K. 2018, ApJ, 852, 98, doi: 10.3847/1538-4357/aa9ffc
- Zhang & Ji (2014) Zhang, Q. M., & Ji, H. S. 2014, A&A, 567, A11, doi: 10.1051/0004-6361/201423698