Search for light dark matter with ionization signals in the PandaX-4T Experiment
Abstract
We report the search results of light dark matter through its interactions with shell electrons and nuclei, using the commissioning data from the PandaX-4T liquid xenon detector. Low energy events are selected to have an ionization-only signal between 60 to 200 photoelectrons, corresponding to a mean nuclear recoil energy from 0.77 to 2.54 keV and electronic recoil energy from 0.07 to 0.23 keV. With an effective exposure of 0.55 tonneyear, we set the most stringent limits within a mass range from 40 to 10 for point-like dark matter-electron interaction, 100 MeV/c2 to 10 GeV/c2 for dark matter-electron interaction via a light mediator, and 3.2 to 4 for dark matter-nucleon spin-independent interaction. For DM interaction with electrons, our limits are closing in on the parameter space predicted by the freeze-in and freeze-out mechanisms in the early Universe.
Dark matter (DM) direct detection experiments are being carried out worldwide to detect possible interactions between the DM and baryonic matter Liu et al. 2017; Undagoitia and Rauch 2015. DM particles within a mass range from about 5 to 10 have been extensively searched for via the recoil of atomic nucleus Tan et al. 2016; Aprile et al. 2018; Akerib et al. 2017a; Agnes et al. 2018; Ajaj et al. 2019; Agnese et al. 2014; Jiang et al. 2018; Abdelhameed et al. 2019; Amole et al. 2017; Meng et al. 2021. Such DM may have been naturally frozen-out in the early Universe and become the thermal relic Kolb and Turner 1990. Lighter DM particles are also well-motivated theoretically. In addition to the thermal freeze-out, they could also be produced slowly in non-equilibrium along the evolution of Universe (freeze-in) Hall et al. 2010. Detecting them with conventional techniques, however, becomes more difficult as the recoil energy is much suppressed. Many low threshold techniques have been developed in recent years, enabling experimental searches for the light DM scatterings with nuclei and with shell electrons Cheng et al. 2021; Essig et al. 2012a; Essig et al. 2012b; Aguilar-Arevalo et al. 2019; Emken et al. 2019; Essig et al. 2016; Essig et al. 2017a. In this letter, we report a dedicated low threshold search for the light DM particles with ionization-only signals using the commissioning data of PandaX-4T.
The PandaX-4T experiment Meng et al. 2021; Zhang et al. 2019; Qian et al. 2022; He et al. 2021; Chen et al. 2021; Zhao et al. 2021; Wang et al. 2021 is located in the B2 experimental hall of the China Jinping Underground Laboratory (CJPL). The central detector is a dual-phase Time Projection Chamber (TPC) containing an active cylindrical sensitive target with 3.7 of liquid xenon (LXe). An energy deposition in LXe produces prompt scintillation photons () and ionized electrons in the liquid. Ionized electrons are drifted under the electrical field defined by the cathode and gate grid located at the bottom and top of the LXe, respectively. They are extracted and amplified by a stronger field in between the gate and anode across the liquid level, producing electroluminescence photons () proportional to the number of ionized electrons. Both and signals are detected by two arrays of Hamamatsu R11410-23 photomultiplier tubes (PMTs) located at the top and bottom of the TPC Meng et al. 2021. For each scintillation photon and ionized electron being produced, the average detection efficiencies are measured to be 9% and 90%, respectively. Therefore, conventional requirement of - pairs inevitably leads to significant efficiency loss for low energy events. Conversely, ionization-only events open up a low energy window down to just a few ionized electrons.
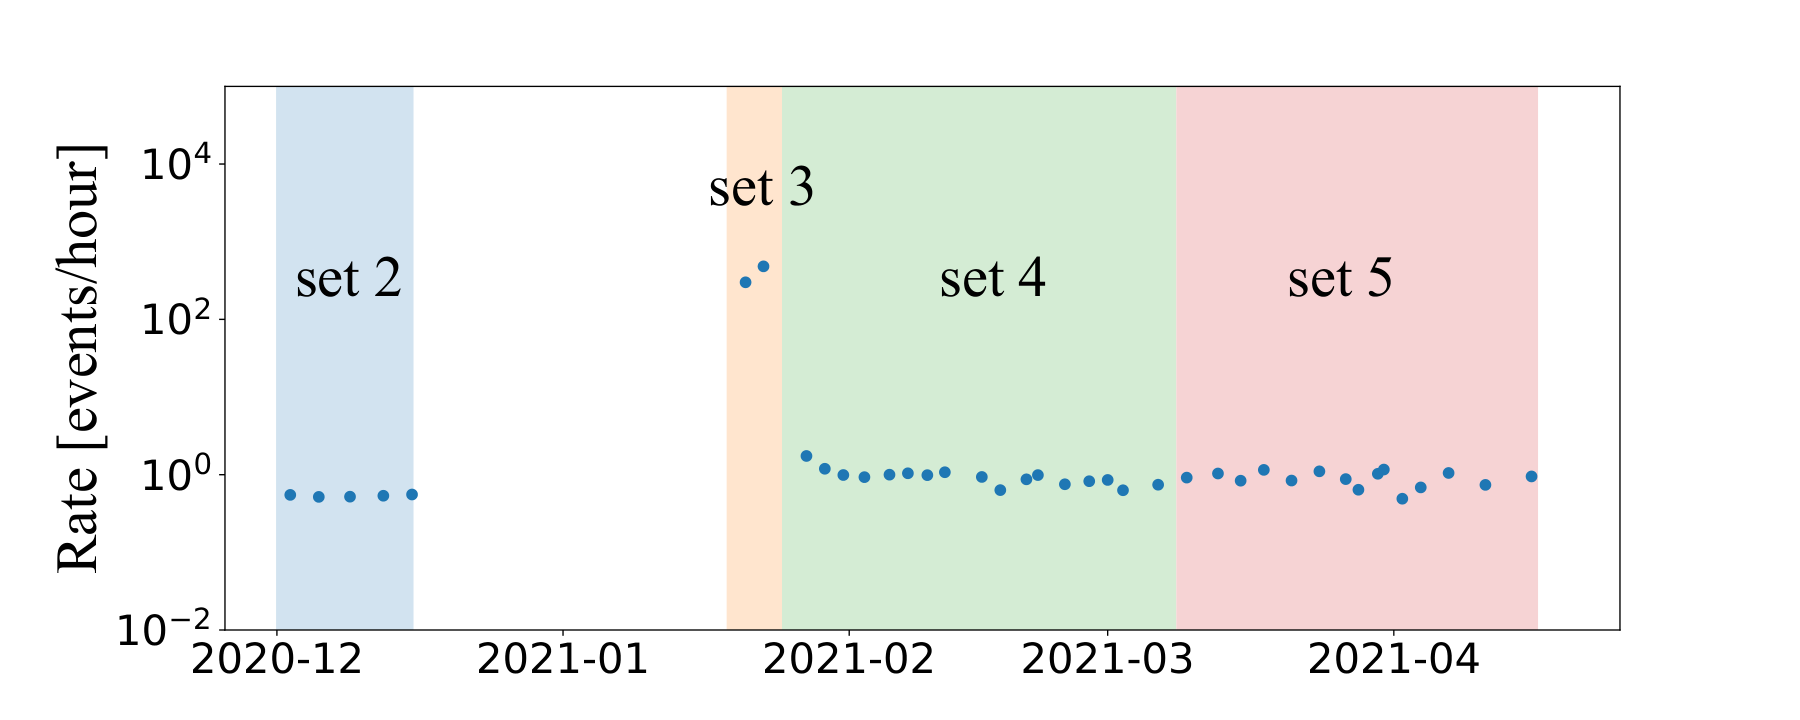
Similar to Ref. Ma et al., a blind analysis is performed on the sets 2 and 4-5 of the commissioning data of PandaX-4T Ma et al.. Data set 3 was removed due to the high micro-discharge noises (MD) from the electrodes. Events with unpaired (US2), i.e. no accompanying greater than 2 photoelectrons (PE), are defined as the candidates. The requirement on the accompanying has an efficiency of 90% for all the DM models probed in this analysis. Data of approximately eight days are randomly selected to validate the signal selection and background composition. The signal selection consists of three steps, the signal reconstruction, the data quality cuts, and the region-of-interest (ROI) selection. The signal reconstruction refers to the identification and reconstruction of the -like signals from the raw data. To correctly reconstruct the signal, PMT hits belonging to an -like signal are clustered by taking into account the diffusion of the electrons during their drift. Different from previous analyses Meng et al. 2021; Ma et al., the clustering algorithm in this analysis is modified to be solely based on the charge and width due to the lack of vertical position reconstruction. The data quality cuts are developed based on the calibration data to remove noises and unphysical events, including pile-ups of single-electron events, the background originated from electrodes, events happening in the gaseous region, and MD events. To collect enough statistics of small signals, the secondary s from the double scattering (DS) events of the 241Am-Be and DD calibration are selected. The secondary is required to precede the main of the DS events, in order to ensure the purity of the DS sample. Similar to Ref. Ma et al., the data quality cuts are defined based on the horizontal position reconstruction quality, the top-bottom charge ratio, the signal waveform shape, the veto PMT charge, and the afterglow veto. The data quality cuts (cut0) are further optimized by maximizing signal-to-background ratio, where the background is assumed to consist of solely the so-called cathode background (see later text). For the signal waveform shape cuts, in particular, a selection on S2 width with S2-dependent upper and lower boundaries is adopted, which suppresses the cathode background most significantly.
The ROI of this analysis is set to be between 60 to 200 PE. The lower boundary of the ROI is determined to avoid the apparent high background rate at very low , and the upper boundary is set so that the loss of the sensitivity to DM search is negligible (no more than 5% for all the DM models investigated). The “afterglow” veto cut Ma et al. is applied to remove the exposure time with high afterglow rate. The total effective live time of the selected US2 data is 64.7 days. The same radial cut as in Ref. Meng et al. 2021 is also applied, leading to a fiducial mass of tonnes, thus, a total effective exposure of 0.55 tonneyear.
For events located in the ROI, the signal efficiency, separated into the US2 reconstruction efficiency and data quality selection efficiency, is shown in Fig. 1. The US2 reconstruction efficiency is evaluated through dedicated waveform simulation (WS), as described in Ref. Ma et al.. It starts to drop below about 80 PE with an efficiency of about 90% at 60 PE, with negligible systematic uncertainty. The data quality selection efficiency is estimated using the DS and the WS samples Ma et al., and no significant dependence is observed. Therefore, the average of two methods is taken as the nominal value, and the standard deviation is taken as the systematic uncertainty (31%).
Prior to the unblinding of the data, three background compositions are evaluated. The electronic recoil (ER) background is primarily due to beta decays of the internal radioactivities such as tritium and 222Rn. The nuclear recoil (NR) background is produced by the solar 8B neutrino elastic scattering off xenon nuclei (CENS) and the neutron background. The nominal rates and energy spectra of these backgrounds are the same as those in Ref. Ma et al.. Due to the lack of , the US2 data are also contaminated by the background emerging from the radioactivities in the cathode or on its surface, exhibiting a signature of with large width due to diffusion effects 11 1 Such background can also emerge from the gate electrode, but is significantly suppressed by our data selection based on the width. To obtain features of the cathode background, tagged cathode events in - pairs with characteristic vertical positions are selected. For less than 100 PE, the distribution of the selected cathode events is found to be independent of , and is therefore taken as the shape of the US2 cathode background. The rate of the US2 cathode background is obtained by scaling the tagged cathode events with in the ROI. The scaling constant is the ratio between the US2 events and tagged cathode events in a side-band with from 200 to 350 PE and -width from 2.5 to 4.5 s. The systematic uncertainty is estimated to be 25%, by varying the side-band region.
| Nominal | Best-fit | |
|---|---|---|
| Cathode | 41.610.6 | 63.99.1 |
| MD | 6.9+9.0 | 17.75.3 |
| Solar | 10.83.7 | 11.73.6 |
| ER | 2.30.6 | 2.50.5 |
| Neutron | 0.10.1 | 0.10.1 |
| Total | 61.7 | 95.811.3 |
A two-step unblinding procedure is carried out on our data to ensure good control over background. In the first step, we define a set of loosened data quality cuts on the US2 width, shape, top/bottom charge ratio etc., and unblind the complementary events (cut1 data) between the loosened cut and cut0, which is more sensitive to instrumental background. The event distribution in cut1 is shown in Fig. 2. Shown on the right panel is the distribution of -width, which is particularly sensitive to cathode background, for events between 100 and 200 PE (nearly no MD contribution). The agreement between the background prediction and the data is good. At the very low- region below 80 PE, a clear excess is observed with a charge and width distributions consistent with the MD in set 3 (excluded already). The rate of the excess also varies with data-taking periods, 1.7 times higher in data sets 4-5 than that in set 2, indicating a residual level of MD after set 3. Therefore, a MD background component is added to the background model for sets 4-5 only, with the rate estimated from the difference between sets 4-5 and set 2 in an side-band region from 40 to 60 PE 22 2 Under cut1, s in set 2 are stretched due to a slightly different gain of this dataset., and the shape taken from set 3. The comparison between the cut1 data and background prediction is shown in the upper panel of Fig. 2. Our nominal MD background in S2 [60, 80] PE undershoots the observed cut1 rate by 130%, which may be consistent with a residual MD background component in set 2, or a constant DM signal degenerate with MD background. We assign +130% as an asymmetrical systematic uncertainty for the MD rate in sets 4-5.
The MD prediction under the final cut0 is then set by the MD expectation in Fig. 2 scaled by the ratio of events between cut0 and cut1 in data set 3. The obtained rate and the associated uncertainty of the MD background are listed in Table 1 (column “nominal”).
As in Refs. Meng et al. 2021; Ma et al., our NR signal model follow the construction of the NEST package Szydagis et al. 2018, with the parameters obtained from a fit to the PandaX-4T calibration data Meng et al. 2021, and extrapolate to our ROI (P4-NEST). The systematic uncertainty is dominated by the charge yield uncertainty in NEST Szydagis 2022 for a recoil energy below 5 keV NR energy. The ER energy scale in the lowest region of the ROI also has large uncertainty as the lowest ever calibration point in LXe is 0.186 keV Akerib et al. 2017c. Therefore, for the ER events, a more conservative constant- model Essig et al. 2017b is chosen as the nominal model. The ROI corresponds to the mean energy range from 0.77 to 2.54 keV for NRs (P4-NEST), and 0.07 to 0.23 keV for ERs (constant-). The solar , ER and neutron background can then be estimated under these models (Table 1). The surface background is negligible within the FV cut.
| Nuisance parameters | Stdev. | Estimated by | |
|---|---|---|---|
| Data sel. eff. | 0.31 | DS vs. WS | |
| Sig. model rate | NEST uncert. | ||
| Cathode bkg. rate | 0.25 | ROI side-band | |
| MD bkg. rate | cut1 data |
The second step unblinding happens after all background nominals in the ROI are set. In total 105 events are observed in cut0, shown in Fig. 3. Statistical interpretation of the US2 data is performed based on a two-sided profile likelihood ratio (PLR) method Baxter et al. 2021. The binned likelihood of this analysis is defined as:
| (1) |
where and are the observed and predicted events, respectively, in the -th bin in . , , , and are the nuisance parameters corresponding to the systematic uncertainties of the data selection efficiency, the DM signal rate, the cathode background rate, and the MD background rate, respectively, constrained by Gaussian terms (see also Table 2). The expected events can be written as:
| (2) | ||||
where , , , and are the nominal events for the DM signals, cathode background, MD background, and other background (solar , ER, and neutrons), respectively. The DM signal and background models for set 2 and sets 4-5 are generated separately according to their detector conditions and then summed up. The parameter is factored together with a fractional shape uncertainty which depends on actual DM signal spectrum, similar to Ref. Ma et al.. For example, for a point-like 200 MeV/c2 DM-electron interaction, varies from 1% to 37% from 60 to 200 PE. The background-only best-fit rates of the background components are summarized in Table. 1. An upward shift is observed in the cathode background, nevertheless within two standard deviations from the nominal, which is conservative in the case of setting exclusion limits. No significant excess is observed above expected background, therefore our data are cast into DM exclusion limits. The 2 upward shift in the fitted cathode background implies an underestimation of the background, but is nevertheless conservative in the case of limit setting. Likewise, our nominal MD background and its asymmetric uncertainty also lead to a more conservative limit.
Three benchmark models are considered in this analysis: the DM-electron elastic scatterings with a heavy mediator (the DM form factor ) and a light mediator (, where is the momentum transfer) Essig et al. 2017b, and the DM-nucleon spin-independent (SI) scattering. The exclusion limits on the scattering cross-sections at 90% C.L. are shown in Fig. 4 and Fig. 5. To set the scale, the limits are about 1.310-43 cm2 (3.5 GeV/c2) for the DM-nucleon SI scattering and 2.110-41 cm2 (200 MeV/c2) for DM-electron scattering with a heavy mediator. The obtained results have provided the most stringent constraints for the DM-electron interactions with mass in range of 40 MeV/c2 to 10 GeV/c2 with F=1, and 100 MeV/c2 to 10 GeV/c2 with F, and for DM-nucleon SI interactions in the DM mass range of 3.2 to 4 GeV/c2. Results with lower DM masses are not reported, as the sensitivity band grows significantly due to the large systematic uncertainty on the charge yields. Our exclusions on DM-electron interactions represent a significant step-forward in the field. Under the assumption of vector portal interactions (e.g. the dark photon as the mediator), our results challenge the freeze-out mechanism for DM mass range from 0.04 to 0.25 GeV/c2 with F=1, and are closing in on the freeze-in prediction with F, assuming such light DM provides the entire DM abundance.
In summary, a blind analysis using ionization-only data from the PandaX-4T commissioning run
is carried out to search for light DM interactions with xenon nuclei and atomic electrons.
We have lowered the threshold to 60 PE, equivalent to a mean NR energy of about 0.77 keV and ER energy of about 0.07 keV. All background components in the ROI are understood and well constrained.
With an effective exposure of 0.55 tonneyear, no significant excess is observed above background.
Thus, we have obtained the leading constraints on the DM-electron cross-sections with the DM mass in the range of 40 MeV/c2 to 10 GeV/c2 for a heavy mediator,
and 100 MeV/c2 to 10 GeV/c2 for a light mediator, respectively, and on the DM-nucleon SI cross-sections within the DM mass range from 3.2 to 4 GeV/c2.
PandaX-4T is taking more physics data and working to suppress the background further, aiming to further improve the sensitivity with a 6-tonne-year total exposure.
We would like to thank Matthew Szydagis for useful discussions concerning NEST model uncertainty. This project is supported in part by grants from National Natural Science Foundation of China (Nos. 12090061, 12005131, 11905128, 11925502, 12222505, 11835005), a grant from the Ministry of Science and Technology of China (No. 2016YFA0400301), and by the Office of Science and Technology, Shanghai Municipal Government (grant No. 18JC1410200). We thank supports from Double First Class Plan of the Shanghai Jiao Tong University. We also thank the sponsorship from the Hongwen Foundation in Hong Kong, Tencent Foundation in China, and Yangyang Development Fund. Finally, we thank the CJPL administration and the Yalong River Hydropower Development Company Ltd. for indispensable logistical support and other help.
References
- Liu et al. (2017) J. Liu, X. Chen, and X. Ji, Nature Phys. 13, 212 (2017).
- Undagoitia and Rauch (2015) T. M. Undagoitia and L. Rauch, Journal of Physics G: Nuclear and Particle Physics 43, 013001 (2015).
- Tan et al. (2016) A. Tan et al. (PandaX), Phys. Rev. D 93, 122009 (2016).
- Aprile et al. (2018) E. Aprile et al. (XENON), Phys. Rev. Lett. 121, 111302 (2018).
- Akerib et al. (2017a) D. Akerib et al. (LUX), Phys. Rev. Lett. 118, 021303 (2017a).
- Agnes et al. (2018) P. Agnes et al. (DarkSide), Phys. Rev. D 98, 102006 (2018).
- Ajaj et al. (2019) R. Ajaj et al. (DEAP), Phys. Rev. D 100, 022004 (2019).
- Agnese et al. (2014) R. Agnese et al. (SuperCDMS), Phys. Rev. Lett. 112, 041302 (2014).
- Jiang et al. (2018) H. Jiang et al. (CDEX), Phys. Rev. Lett. 120, 241301 (2018).
- Abdelhameed et al. (2019) A. Abdelhameed et al. (CRESST), Phys. Rev. D 100, 102002 (2019).
- Amole et al. (2017) C. Amole et al. (PICO), Phys. Rev. Lett. 118, 251301 (2017).
- Meng et al. (2021) Y. Meng et al. (PandaX), Phys. Rev. Lett. 127, 261802 (2021).
- Kolb and Turner (1990) E. W. Kolb and M. S. Turner, The Early Universe, Vol. 69 (1990).
- Hall et al. (2010) L. J. Hall, K. Jedamzik, J. March-Russell, and S. M. West, JHEP 03, 080, arXiv:0911.1120 [hep-ph] .
- Cheng et al. (2021) C. Cheng et al. (PandaX), Phys. Rev. Lett. 126, 211803 (2021).
- Essig et al. (2012a) R. Essig, J. Mardon, and T. Volansky, Phys. Rev. D 85, 076007 (2012a).
- Essig et al. (2012b) R. Essig, A. Manalaysay, J. Mardon, P. Sorensen, and T. Volansky, Phys. Rev. Lett. 109, 021301 (2012b).
- Aguilar-Arevalo et al. (2019) A. Aguilar-Arevalo et al. (DAMIC), Phys. Rev. Lett. 123, 181802 (2019).
- Emken et al. (2019) T. Emken, R. Essig, C. Kouvaris, and M. Sholapurkar, Journal of Cosmology and Astroparticle Physics 2019 (09), 070.
- Essig et al. (2016) R. Essig, M. Fernandez-Serra, J. Mardon, A. Soto, T. Volansky, and T.-T. Yu, JHEP 05, 046, arXiv:1509.01598 [hep-ph] .
- Essig et al. (2017a) R. Essig, T. Volansky, and T.-T. Yu, Phys. Rev. D 96, 043017 (2017a), arXiv:1703.00910 [hep-ph] .
- Zhang et al. (2019) H. Zhang et al. (PandaX), Sci. China Phys. Mech. Astron. 62, 31011 (2019).
- Qian et al. (2022) Z. Qian et al. (PandaX), Journal of High Energy Physics 147, 10.1007/JHEP06(2022)147 (2022).
- He et al. (2021) C. He, J. Liu, X. Ren, X. Shang, X. Wei, M. Wang, J. Yang, J. Yang, Y. Yang, G. Zhang, and Q. Zheng, Journal of Instrumentation 16 (12), T12015.
- Chen et al. (2021) X. Chen, C. Cheng, M. Fu, F. Giuliani, J. Liu, X. Lu, X. Ji, Z. Qian, H. Qiao, Q. Wang, J. Xia, P. Xie, Y. Yao, and H. Zhang, Journal of Instrumentation 16 (09), T09004.
- Zhao et al. (2021) L. Zhao, X. Cui, W. Ma, Y. Fan, K. Giboni, T. Zhang, J. Liu, and X. Ji, Journal of Instrumentation 16 (06), T06007.
- Wang et al. (2021) X. Wang, S. Li, Y. Ju, Z. Lei, J. Liu, X. Ji, X. Tang, and Y. Gou, Review of Scientific Instruments 92, 093905 (2021).
- (28) W. Ma et al. (PandaX), arXiv:2207.04883 .
- (29) Such background can also emerge from the gate electrode, but is significantly suppressed by our data selection based on the width.
- (30) Under cut1, s in set 2 are stretched due to a slightly different gain of this dataset.
- Aprile et al. (2019) E. Aprile et al. (XENON), Phys. Rev. Lett. 123, 251801 (2019).
- Agnes et al. (2022a) P. Agnes et al. (DarkSide-50), (2022a), arXiv:2207.11968 .
- Essig et al. (2017b) R. Essig, T. Volansky, and T.-T. Yu, Phys. Rev. D 96, 043017 (2017b).
- Abramoff et al. (2019) O. Abramoff et al. (SENSEI), Phys. Rev. Lett. 122, 161801 (2019).
- Aprile et al. (2021) E. Aprile et al. (XENON), Phys. Rev. Lett. 126, 091301 (2021).
- Akerib et al. (2017b) D. Akerib et al. (LUX), Phys. Rev. Lett. 118, 021303 (2017b).
- Agnes et al. (2022b) P. Agnes et al. (DarkSide-50), (2022b), arXiv:2207.11966 .
- Szydagis et al. (2018) M. Szydagis, J. Balajthy, J. Brodsky, J. Cutter, J. Huang, E. Kozlova, B. Lenardo, A. Manalaysay, D. McKinsey, M. Mooney, et al., Zenodo: Geneve, Switzerland (2018).
- Szydagis (2022) M. Szydagis, Bulletin of the American Physical Society (2022).
- Akerib et al. (2017c) D. S. Akerib et al. (LUX), Phys. Rev. D 96, 112011 (2017c), arXiv:1709.00800 [physics.ins-det] .
- Baxter et al. (2021) D. Baxter, I. Bloch, E. Bodnia, X. Chen, J. Conrad, P. Di Gangi, J. Dobson, D. Durnford, S. Haselschwardt, A. Kaboth, et al., The European Physical Journal C 81, 1 (2021).