iCardo: A Machine Learning based Smart Healthcare Framework for Cardiovascular Disease Prediction
Abstract
Cardiovsacular Disease is major threat to humans around the world due to difficulty of the diagnosis at early stage. Real-time access to medical records is helpful to improve the patient’s health in critical conditions. The point-of-care services and medication have become simpler with the use of efficient consumer electronics devices in a smart healthcare system. Cardiovascular disease is one of the critical illnesses which causes the heart failure and the early and prompt identification of CVD can lessen damage and prevent premature mortality. Machine learning has been used to predict cardiovascular disease (CVD) in the literature. The article explains choosing the best classifier model for the selected feature sets and the distinct feature sets selected using four feature selection models. The paper also compares seven different classifiers using each of the sixteen feature sets. Originally, the data had 56 attributes and 303 occurrences, of which 87 were in good health and the remainder had cardiovascular disease (CVD). Demographic characteristics, Symptom and Examination features, Electrocardiography (ECG) based features, and Laboratory and Echocardiography based features make up the four groups that comprise the data set’s overall features. Least Absolute Shrinkage and Selection Operator (LASSO), Tree-based algorithms, Chi-Square and Recursive Feature Elimination (RFE) have all been used to choose the four distinct feature sets, each containing five, ten, fifteen, and twenty features, respectively. Seven distinct classifiers have been trained and evaluated for each of the sixteen feature sets. To determine the most effective blend of feature set and model, a total of 112 models have been trained, tested, and their performance metrics have been compared. A Support Vector Machine (SVM) classifier with fifteen chosen features is shown to be the best in terms of overall accuracy. The healthcare data has been maintained in the cloud and would be accessible to patients, caretakers, and healthcare providers through integration with the Internet of Medical Things (IoMT) enabled smart healthcare. Subsequently, the most appropriate feature for CVD prediction is chosen by feature selection model that is later utilised to calibrate the system, and the proposed framework can be utilised to anticipate CVD.
Keywords Smart Healthcare, Healthcare Cyber-Physical Systems, Internet-of-Medical-Things (IoMT), Cardiovascular Disease, Heart Failure, Machine Learning
1 Introduction
The advancement of healthcare technology has allowed the development of effective Healthcare Cyber-Physical Systems (H-CPS) which integrates electronic health records (EHR), with artificial intelligence (AI) for smart healthcare management. The data from the healthcare sensors have allowed monitoring of the patient’s condition through the integration of the Internet of Medical Things (IoMT). In [1], the intelligent feedback system through wearable sensors in healthcare, allows efficient decision-making for the point of care service. Disease diagnosis through remote monitoring is one of the most important components of smart healthcare [2, 3]. Cardiovascular Disease (CVD) is the leading cause of premature death worldwide, and the early stage of diagnosis through smart healthcare would allow for reducing mortality.
According to the World Health Organization (WHO), Cardiovascular Diseases (CVDs) account for 33 % of overall fatalities all over the world [4][5]. The early detection of CVD would be helpful to have preventative measures for minimum premature mortality. In the past, various machine-learning models were attempted for automated detection of CVD [6, 7, 8, 9]. The models would allow for providing an intelligent preventive healthcare mechanism. Such an automated system is capable of integration with smart healthcare, which plays a vital role in the quality of life improvement [10, 11]. The portable medical equipment, such as patches, badges, rings, bracelets, and wrist devices, have offered simpler methods for everyday health monitoring [12, 13, 14]. A novel non-invasive device to measure the amount of glucose and insulin delivery system for smart healthcare applications is proposed in [15, 16]. In the field of smart healthcare, physiological signal monitoring is crucial, and various systems have been developed with the aid of electrocardiography (ECG), photoplethysmography (PPG), and electroencephalography (EEG) monitoring [17][18][19]. Arrhythmia identification [20], heart rate monitoring and chronic heart failure prediction are some applications of ECG monitoring [21]. The patient’s medical history and the outcomes of diagnostic tests are frequently kept on file in the Electronic Health Record (EHR) system of the relevant diagnostic institution or hospital, along with the ECG recordings. The hybrid CVD prediction model can be paired with a cloud or server that extracts traits from the EHR and selects the ones important for CVD prediction. The model can make predictions and select the key qualities on its own. The anticipated outcome could be given to the patient or the relevant clinician, and the conceptual diagram of the framework is shown in Figure 1.

Identifying the nominal sets of characteristics would aid in its precise prediction. Various feature selection methods are reviewed in [22, 23]. [24] proposed XG Boost model for early prediction of CVD and utilised the RF for feature selection. An early-stage cardiovascular disease might be difficult to diagnose due to the absence of particular symptoms. Several risk factors, including hypertension, diabetes, and arrhythmias, contribute to the illness. Angiography, echocardiography, and electrocardiography are well-recognized clinical tools for evaluating the risk of CVD. Although angiography is highly precise, it is intrusive and costly. Only cardiologists would be able to interpret echocardiograms and electrocardiography. This constraint has been eliminated by developing autonomous and efficient machine learning algorithms that can forecast the disease based on echocardiogram and electrocardiography characteristics, including demographic and physiological data. The applicability of machine learning methods, particularly Support Vector Machine (SVM) and boosting algorithms [25], for the prediction of CVD appears encouraging. [26] demonstrated that the EchoNet deep learning network can accurately analyze echocardiogram pictures to diagnose CVDs. However, evaluating a high number of characteristics at a time is not much required, which leads to large and complex model requirements. The paper includes 52 characteristics for CVD prediction from four distinct domains: demographic, ECG and laboratory, symptom and examination, and echocardiography, and determines the subset of features that can assist to have accurate CVD estimation.
The following is the paper’s structure: Section 2 examines a variety of previous publications and strategies for predicting CVDs. Section 3 describes the research gap and contribution of the paper, while section 4 provides an overview of the data along with a detailed technique. Section 5 contains findings, commentary, and a comparison of the performance of other models. It also verifies the model with a combined heart disease dataset. In the last section 6, conclude the article, and outline the future scope of the study.
2 Prior Works on CVD Prediction
Several notable machine-learning models for the classification of cardiovascular disease have been designed in the past few years. Few of them attempted to identify the most important factors for CVD prognosis, while others have worked towards minimising the number of features. Both techniques for improving CVD categorization are illustrated in Figure 2.

Various feature selection techniques, such as filter-wrapper-based, Infinite feature selection, LASSO, and Ridge, have been utilised to enhance CVD prediction [27][28][29]. However, [30] utilised forward feature inclusion and backward feature reduction to predict CVD. The related literature review is shown in Table 1 of the various feature selection for CVD.
| Study | Data set | Feature Selection Methods | Classification Model |
|---|---|---|---|
| Abdellatif et-al, 2022 [27] | Statlog and HD clinical records from UCI | Infinite feature selection (Inf-FS) | Improved weight RF (IWRF) optimized with Baysian optimization |
| Hasan et-al, 2021 [28] | Kaggle heart disease data set | Filter- wrapper embedded. | RF, SVM, KNN, NB, XGBoost |
| Segura et-al,2020 [31] | Sleep Heart Health study (SHSS) dataset | PCA and lowest p-value logistic regression | NB, Feed Forward Neural Network, SVM, RF |
| Marbaniang et al,2020 [32] | Cardiovascular disease data set from Kaggle | Added two features BP and BMI | KNN Naive Bayes, DT, RF, SVM and LDA |
| Panwar et-al,2020 [33] | PPG-BP dataset from Figshare | None | Cardio-Net (CNN based Model) |
| Panda et-al, 2019 [29] | Cleveland Heart Disease Dataset from UCI | LASSO and Ridge | RF, Extra Tree classifier, Gaussian NB, LB |
| Shilaskar et-al, 2013 [34] | Frank Ascunion 2010 dataset from UCI. | Forward feature inclusion Back-elimination Forward feature selection | SVM |
[35] claimed that systolic blood pressure, triglyceride blood glucose index, age, low-density lipoprotein-L/high-density lipoproteins-C, body adiposity index and body mass index are important features for the onset of CVD prediction. Similarly, [36] designed a CVD risk assessment model using Random Forest(RF) classifier for the eastern Chine population, Whereas [37] proposed improved CVD prediction accuracy using neural networks. [38] proposed an algorithm to calculate the strength score for the features used for CVD prediction. [39, 40] presented a study of CVD prediction using ML and Deep Learning. [41] also tried to classify CVD using K-nearest neighbour (K-NN) and multi-layer perceptron (MLP). [42] designed the SVM and LR-based ML model to identify the incident of CVD in the Kazakh Chinese population. Various machine learning algorithms were compared by [43] for CVD prediction, and the relation between diabetes and its influences on heart diseases has also been explored.
On chosen fifty MIT-BIH ECG entries, [44] presented a real-time CVD classification model capable of alerting the hospital through SMS/MMS or email in the event of an emergency. In contrast, [45] provided a comparative examination of the utilisation of different ML models for diverse healthcare applications. The authors proposed a logistic regression model for predicting the threat of cardiovascular disease and diabetes. In addition, they emphasised the significance of the ML approach for predicting serious illnesses related to CVD. [46] described several ML algorithms for the prognosis of heart illness and developed an ML-based intelligent predictive model for heart disease prediction utilising Cleveland and Hungarian heart disease data sets. In [25], the features of Coronary Computed Tomography Angiography (CCTA) images were also subjected to various Machine Learning (ML) algorithms for CAD classification, including Logistic Regression (LR), Linear Discriminant Analysis (LDA), Decision Tree (DT), Artificial Neural Network (ANN), Support Vector Machine (SVM), and K-Nearest Neighbour (KNN). The authors state that the SVM with a polynomial kernel is the best approach, where the model’s parameters were adjusted using the grid search method, and the resulting accuracy was 100%. [25] used a meta-analysis to demonstrate the critical role that machine learning algorithms play in helping clinicians evaluate data and select the best algorithm for the given data set. Additionally, authors have asserted that ML algorithm and Electronic Health Record (EHR) system integration is promising. This can also be employed in smart healthcare architecture to enhance the delivery of high-quality healthcare services [47]. cardiovascular disease mainly occurs when the heart cannot pump enough blood to the body’s organs which is known as Coronary Artery Disease (CAD). When the coronary artery that provides blood to the heart is clogged, the heart’s or cardiac muscles’ need for oxygen is unmet. Stenosis or atherosclerosis are the medical terms for heat-related illnesses. Artificial intelligence with machine learning models has been widely explored in healthcare, including heart disease prediction. In [48], the possible application of artificial intelligence to predicting cardiovascular illness was considered. The mHealth and telemedicine have a great potential to educate clinicians through artificial intelligence techniques and help to have personalised smart healthcare. A review paper that concisely explains the many applications of AI in the topic above is published in [49].
3 Research Gaps and Novel Contribution
3.1 Research Question Addressed in the current Paper
Still, cardiologists can only diagnose cardiovascular disease after invasive and expensive testing. In the era of smart healthcare and telemedicine, the application of machine learning in CVD diagnosis can be beneficial at an early stage. Despite this, it is still difficult to achieve its clinical performance standards.
For every machine learning model to be generalizable, two elements are essential. The set of input features comes first, followed by the volume of training data.
Giving the model a tonne of features does not necessarily improve performance [50]. However, it may lead to more complex models and requires large resources. Therefore, the main challenges for Machine Learning techniques in CVD predictions are:
(1) how to choose the appropriate set of features to classify CVD ?
(2) which is a suitable machine learning classifier for selected features?
3.2 iCardo: Proposed CVD Prediction Model
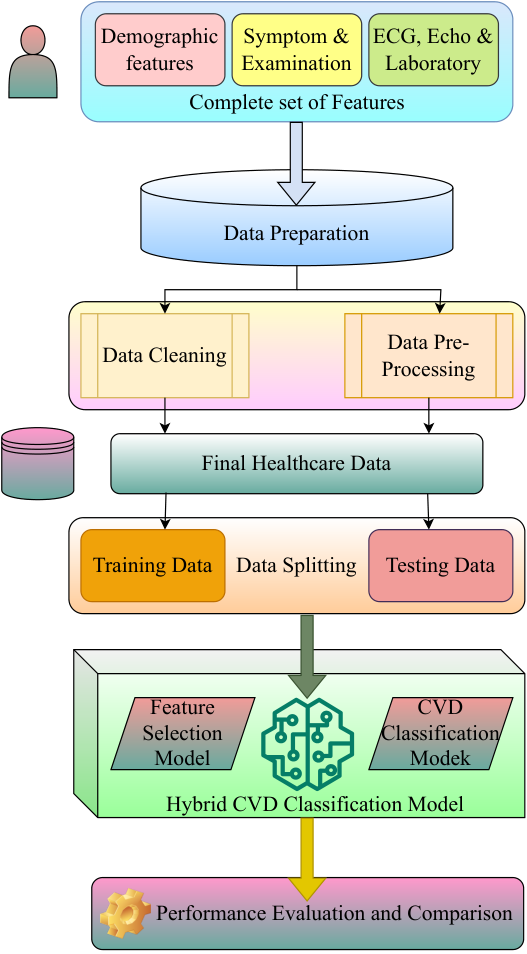
To address the above challenges, we proposed a hybrid machine learning model called iCardo in the current paper that first selects appropriate sets of features from the database and later utilizes those features for CVD classification. The proposed classification model can also be integrated with a smart healthcare framework. Here, in this proposed study, the optimal model for particular feature sets for cardiovascular prediction is investigated. The original data accounted for characteristics from several fields, including demographic, ECG, symptom and assessment, laboratory, and echo features. Four feature selection approaches, Least Absolute Shrinkage and Selection Operator (LASSO), Recursive Feature Elimination (RFE), Chi-Square, and Tree-based model, have been used to pick the pertinent subset of features. Later, there are 16 different feature sets obtained through several machine learning classifiers such as Support Vector Machine (SVM), Logistic Regression (LR), Adda Boost, XG-Boost, Naive Bayes, K-Nearest neighbour (KNN), and simple artificial neural network (ANN) and overall 112 models have been assessed. The performance is measured and subsequently compared to discover the best fit for the prediction of CVD.
3.3 Significance of Proposed Solution
The significance of the proposed solution are as follow:
- •
Several feature selection models have been trained to select more appropriate features for CVD prediction
- •
The classification models are trained with the selected set of features for CVD classification
- •
The performance of the hybrid classification model is presented through comparative analysis
- •
The performance of the proposed model is validated with the help of four publicly available data-sets
- •
The present work would allow to have preventive healthcare mechanisms through a smart healthcare framework
4 CVD Prediction using Hybrid Machine Learning Model
4.1 Data set
Z Alizadeh Sani data set [51], [52], and [53] are retrieved from the Machine Learning Repository of UCI and utilised in this study. There are 303 individuals in the dataset, 216 of whom have coronary artery disease. There are 54 properties in this set of information, including ECG, symptom and examination, laboratory and echo, and demographic aspects. Table 2 contains a list of these traits along with their range and category.
| Features Name | Range | Feature Type | |
|---|---|---|---|
| f1 | age | 48-120 | Demographic |
| f2 | Sex | Female, male | Demographic |
| f3 | Diabetes mellitus (DM) | 30-86 | Demographic |
| f4 | Ex-smoker | No, yes | Demographic |
| f5 | Current smoker | No, yes | Demographic |
| f6 | Hyper tension (HTN) | No, yes | Demographic |
| f7 | Family history (FH) | No, yes | Demographic |
| f8 | Body mass index (BMI) (Kg/m2) | 18-41 | Demographic |
| f9 | Dyslipidemia (DLP) | No, yes | Demographic |
| f10 | Airway Disease | No, yes | Demographic |
| f11 | Chronic Renal Failure (CRF) | No, yes | Demographic |
| f12 | Cerebrovascular Accident (CVA) | No, yes | Demographic |
| f13 | Congestive Heart Failure (CHF) | 0 No, yes | Demographic |
| f14 | Obesity | Yes, if MBI 25, No-otherwise | Demographic |
| f15 | Thyroid Disease | No, yes | Demographic |
| f16 | Edema | No, yes | Symptom and examination |
| f17 | Systolic murmur | No, yes | Symptom and examination |
| f18 | Typical Chest Pain | No, yes | Symptom and examination |
| f19 | Atypical | No, yes | Symptom and examination |
| f20 | Weak peripheral pulse | No, yes | Symptom and examination |
| f21 | Exertional Chest Pain (Exertional CP) | No, yes | Symptom and examination |
| f22 | Nonanginal CP | No, yes | Symptom and examination |
| f23 | Dyspnea | No, yes | Symptom and examination |
| f24 | Lung Rales | No, yes | Symptom and examination |
| f25 | Diastolic murmur | No, yes | Symptom and examination |
| f26 | low Threshold angina (Low Th Ang) | No, yes | Symptom and examination |
| f27 | Blood Pressure (BP) (mmHg) | 90-190 | Symptom and examination |
| f28 | Function Class | 1,2,3,4 | Symptom and examination |
| f29 | Pulse Rate (PR) (ppm) | 50-110 | Symptom and examination |
| f30 | ST Elevation | No, yes | ECG |
| f31 | Poor R Wave Progression (Poor R Progression) | No, yes | ECG |
| f32 | T inversion | No, yes | ECG |
| f33 | Q Wave | No, yes | ECG |
| f34 | LVH (Left Ventricular Hypertrophy) | No, Yes | ECG |
| f35 | ST Depression | No, yes | ECG |
| f36 | Rhythm | Sin, AF | ECG |
| f37 | Lymph (Lymphocyte) (%) | 7-60 | Laboratory and echo |
| f38 | K (Potassium) (mEq/lit) | 3.0-6.6 | Laboratory and echo |
| f39 | Valvular Heart Disease (VHD) | Normal, Mild, Moderate, Severe | Laboratory and echo |
| f40 | Blood Urea Nitrogen (BUN) (mg/dl) | 6-52 | Laboratory and echo |
| f41 | Creatine (Cr) (mg/dl) | 0.5-2.2 | Laboratory and echo |
| f42 | Low density lipoprotein (LDL) (mg/dl) | 18-232 | Laboratory and echo |
| f43 | Triglyceride (TG) (mg/dl) | 37- 1050 | Laboratory and echo |
| f44 | Erythrocyte Sedimentation rate (ESR) (mm/h) | 1-90 | Laboratory and echo |
| f45 | Neutrophil (Neut) (%) | 32-89 | Laboratory and echo |
| f46 | High density lipoprotein (HDL) (mg/dl) | 15-111 | Laboratory and echo |
| f47 | Haemoglobin (HB) (g/dl) | 8.9-17.6 | Laboratory and echo |
| f48 | Platelet (PLT) (1000/ml) | 25-742 | Laboratory and echo |
| f49 | Fasting Blood Sugar (FBS) (mg/dl) | 62- 400 | Laboratory and echo |
| f50 | Sodium (Na) (mEq/lit) | 128- 156 | Laboratory and echo |
| f51 | Regional Wall Motion Abnormality (Region with RWMA) | 0,1,2,3,4 | Laboratory and echo |
| f52 | Ejection Fraction (EF) | 15,60 | Laboratory and echo |
| f53 | White Blood Cell (WBC) (cells/ml) | 3700-18000 | Laboratory and echo |
| f54 | Bundle Branch Block(BBB) | No, LBBB, RBBB | Laboratory and echo |
| f55 | Weight | 48 - 120 | Demographic |
| f56 | Length | 140-188 | Demographic |
4.2 Procedure
To forecast CVDs, a mixed machine learning approach is suggested. It is divided into two stages: the feature selection stage and the categorization step. The classification stage uses seven different classification models, including Logistic Regression (LR), Support Vector Machine (SVM), Adda Boost, XG-Boost, K-Nearest Neighbor (KNN), Naive Bayes, and one simple artificial neural network. The first stage uses four feature selection models that use RFE, Chi-square, LASSO, and tree-based methods. At the first stage, each feature selection model produces four feature sets with 10, 15, 20, and 25 features. At the first step, a total of 16 feature sets are created, which are mentioned in Table 3. Seven categorization methods have subsequently been used for performance evaluation. To choose the most precise model for CVD prediction, the accomplishment of each model is compared. The list of each model’s performance metrics is reported in Table 4.
| RFE | LASSO | Chi-Square | Tree-based | |||||||||||||
| Features | 1R | 2R | 3R | 4R | 1L | 2L | 3L | 4L | 1C | 2C | 3C | 4C | 1T | 2T | 3T | 4T |
| f1 | ✓ | ✓ | ✓ | ✓ | ✓ | ✓ | ✓ | ✓ | ✓ | ✓ | ✓ | |||||
| f2 | ✓ | ✓ | ||||||||||||||
| f3 | ✓ | ✓ | ✓ | ✓ | ✓ | ✓ | ✓ | ✓ | ✓ | ✓ | ✓ | ✓ | ||||
| f4 | ||||||||||||||||
| f5 | ✓ | ✓ | ✓ | ✓ | ✓ | |||||||||||
| f6 | ✓ | ✓ | ✓ | ✓ | ✓ | ✓ | ✓ | ✓ | ✓ | ✓ | ✓ | ✓ | ✓ | |||
| f7 | ✓ | ✓ | ✓ | ✓ | ✓ | |||||||||||
| f8 | ✓ | ✓ | ✓ | ✓ | ||||||||||||
| f9 | ||||||||||||||||
| f10 | ✓ | ✓ | ✓ | ✓ | ||||||||||||
| f11 | ✓ | ✓ | ✓ | |||||||||||||
| f12 | ||||||||||||||||
| f13 | ✓ | ✓ | ✓ | ✓ | ||||||||||||
| f14 | ||||||||||||||||
| f15 | ||||||||||||||||
| f16 | ✓ | |||||||||||||||
| f17 | ✓ | |||||||||||||||
| f18 | ✓ | ✓ | ✓ | ✓ | ✓ | ✓ | ✓ | ✓ | ✓ | ✓ | ✓ | ✓ | ✓ | ✓ | ✓ | ✓ |
| f19 | ✓ | ✓ | ✓ | ✓ | ✓ | ✓ | ✓ | ✓ | ✓ | ✓ | ✓ | ✓ | ✓ | ✓ | ✓ | |
| f20 | ✓ | ✓ | ✓ | ✓ | ✓ | ✓ | ||||||||||
| f21 | ||||||||||||||||
| f22 | ✓ | ✓ | ✓ | ✓ | ✓ | ✓ | ✓ | ✓ | ✓ | ✓ | ✓ | ✓ | ||||
| f23 | ✓ | ✓ | ✓ | ✓ | ✓ | |||||||||||
| f24 | ✓ | ✓ | ✓ | ✓ | ||||||||||||
| f25 | ✓ | ✓ | ✓ | ✓ | ✓ | ✓ | ✓ | ✓ | ✓ | ✓ | ✓ | |||||
| f26 | ✓ | |||||||||||||||
| f27 | ✓ | ✓ | ✓ | ✓ | ✓ | ✓ | ✓ | ✓ | ✓ | |||||||
| f28 | ✓ | ✓ | ✓ | ✓ | ✓ | |||||||||||
| f29 | ✓ | ✓ | ✓ | ✓ | ✓ | |||||||||||
| f30 | ✓ | ✓ | ✓ | ✓ | ✓ | ✓ | ||||||||||
| f31 | ✓ | ✓ | ✓ | ✓ | ✓ | ✓ | ✓ | ✓ | ||||||||
| f32 | ✓ | ✓ | ✓ | ✓ | ✓ | ✓ | ✓ | ✓ | ✓ | ✓ | ✓ | ✓ | ||||
| f33 | ✓ | ✓ | ✓ | ✓ | ✓ | ✓ | ✓ | ✓ | ✓ | |||||||
| f34 | ||||||||||||||||
| f35 | ✓ | ✓ | ✓ | ✓ | ✓ | ✓ | ||||||||||
| f36 | ||||||||||||||||
| f37 | ✓ | ✓ | ✓ | |||||||||||||
| f38 | ✓ | ✓ | ✓ | ✓ | ✓ | ✓ | ✓ | ✓ | ||||||||
| f39 | ||||||||||||||||
| f40 | ✓ | ✓ | ✓ | |||||||||||||
| f41 | ✓ | ✓ | ✓ | |||||||||||||
| f42 | ✓ | ✓ | ||||||||||||||
| f43 | ✓ | ✓ | ✓ | ✓ | ✓ | ✓ | ||||||||||
| f44 | ✓ | ✓ | ✓ | ✓ | ✓ | ✓ | ✓ | |||||||||
| f45 | ✓ | ✓ | ||||||||||||||
| f46 | ✓ | ✓ | ✓ | |||||||||||||
| f47 | ✓ | ✓ | ||||||||||||||
| f48 | ✓ | ✓ | ✓ | ✓ | ||||||||||||
| f49 | ✓ | ✓ | ✓ | ✓ | ✓ | ✓ | ✓ | ✓ | ✓ | |||||||
| f50 | ✓ | |||||||||||||||
| f51 | ✓ | ✓ | ✓ | ✓ | ✓ | ✓ | ✓ | ✓ | ✓ | ✓ | ✓ | ✓ | ✓ | ✓ | ✓ | |
| f52 | ✓ | ✓ | ✓ | ✓ | ✓ | ✓ | ✓ | ✓ | ✓ | |||||||
| f53 | ✓ | ✓ | ||||||||||||||
| f54 | ✓ | ✓ | ✓ | |||||||||||||
| f55 | ✓ | ✓ | ||||||||||||||
| f56 | ✓ | |||||||||||||||
4.3 Simulation
Sklearn is utilised for the complete performance metric evaluation, while Python 3.0 is used for feature extraction, model training, and model testing. Pandas are used to assist in importing and pre-processing data. MinMax scalar is employed to standardise or normalise the data [54]. In addition, Label Encoding is carried out to manage the values, which are alphanumeric and string. Using seaborn and matplot lib, the data and outcomes are visualised through various plots.
5 Experimental Results
This section compares the outcomes of several categorization models using various input characteristics. First, all 56 characteristics of the Z Alizadeh Sani dataset are used with machine learning classifiers, and feature selection approaches. The 10, 15, 20, and 25 features are then extracted using the RFE, LASSO, Chi-Square, and Tree-Based algorithms. Further, each set of features is retrieved using one of the feature selection methods, and every classifier is trained and evaluated. Table 4 lists the performance indicators for each situation.
5.1 Feature Selection
The original dataset comprises 56 characteristics from several categories i.e demographic features, feature-based on symptoms and examinations, feature-based on electrocardiograms, feature-based on lab tests, and feature-based on echocardiography that may be utilised to produce illness outcomes. This dataset offers a wide variety of features, which makes it better suited for testing feature selection methods. Four feature selection models, given in Table 3, are used to choose a total of sixteen feature sets.
| Models | 10 feature set | 15 feature set | 20 feature set | 25 feature set | |||||||||||||
| Accuracy | Precision | Recall | F1 score | Accuracy | Precision | Recall | F1 score | Accuracy | Precision | Recall | F1 score | Accuracy | Precision | Recall | F1 score | ||
| SVM | RFE | 87.91 | 89 | 64 | 74 | 92.21 | 84 | 84 | 84 | 92.21 | 84 | 84 | 84 | 92.31 | 85 | 88 | 86 |
| Lasso | 91.2 | 90 | 76 | 83 | 90.11 | 90 | 72 | 80 | 91.2 | 90 | 76 | 83 | 90.11 | 86 | 76 | 81 | |
| Chi-Square | 89 | 86 | 72 | 78 | 92.31 | 95 | 76 | 84 | 91.21 | 95 | 72 | 82 | 92.31 | 95 | 76 | 84 | |
| Tree based | 91.21 | 87 | 76 | 83 | 91.21 | 87 | 80 | 83 | 83.51 | 71 | 68 | 69 | 81.31 | 67 | 64 | 65 | |
| XG-Boost | RFE | 85.7 | 83 | 60 | 70 | 87.9 | 82 | 72 | 77 | 91.2 | 90 | 76 | 83 | 91.2 | 95 | 72 | 82 |
| Lasso | 89 | 89 | 68 | 77 | 86.8 | 88 | 60 | 71 | 87.9 | 85 | 68 | 76 | 86.8 | 84 | 64 | 73 | |
| Chi-Square | 91.2 | 90 | 76 | 83 | 92.3 | 95 | 76 | 84 | 91.2 | 90 | 76 | 83 | 92.3 | 95 | 76 | 84 | |
| Tree based | 90.1 | 94 | 68 | 79 | 90.1 | 90 | 72 | 80 | 90.1 | 90 | 72 | 80 | 89 | 86 | 72 | 78 | |
| Adda Boost | RFE | 81.32 | 89 | 85 | 87 | 85.7 | 92.2 | 88.06 | 90 | 81.32 | 90.62 | 84.06 | 87.21 | 83.52 | 92.19 | 85.51 | 88.73 |
| Lasso | 86.61 | 90.62 | 87.87 | 89.23 | 85.7 | 93.75 | 86.95 | 90.22 | 85.71 | 90.62 | 89.23 | 89.92 | 90.11 | 96.87 | 89.85 | 93.33 | |
| Chi-Square | 86.81 | 92.18 | 89.39 | 90.76 | 86.81 | 90.62 | 90.62 | 90.62 | 87.91 | 92.18 | 90.77 | 91.47 | 84.61 | 89.06 | 89.06 | 89.06 | |
| Tree based | 86.81 | 93.75 | 88.23 | 90 | 85.71 | 92.18 | 88.05 | 90.07 | 82.41 | 89.06 | 86.36 | 87.69 | 84.61 | 96.87 | 83.78 | 89.85 | |
| Log. Reg. | RFE | 83.52 | 73 | 70 | 72 | 87.91 | 79 | 81 | 80 | 86.81 | 80 | 74 | 77 | 85.71 | 77 | 74 | 75 |
| Lasso | 89.01 | 81 | 81 | 81 | 86.81 | 80 | 74 | 77 | 89.01 | 84 | 78 | 81 | 90 | 88 | 78 | 82 | |
| Chi-Square | 87.91 | 79 | 81 | 80 | 89.01 | 84 | 78 | 81 | 87 | 81 | 78 | 79 | 86.81 | 80 | 74 | 77 | |
| Tree based | 84.62 | 76 | 70 | 73 | 85.71 | 77 | 74 | 75 | 72.53 | 56 | 37 | 44 | 75.82 | 63 | 44 | 52 | |
| KNN | RFE | 82.42 | 70 | 70 | 70 | 84.62 | 78 | 67 | 72 | 83.52 | 75 | 67 | 71 | 81.32 | 71 | 63 | 67 |
| Lasso | 76.92 | 71 | 37 | 49 | 74.73 | 67 | 30 | 41 | 72.53 | 58 | 26 | 36 | 72.53 | 67 | 15 | 24 | |
| Chi-Square | 85.71 | 79 | 70 | 75 | 78.02 | 67 | 52 | 58 | 74.73 | 62 | 37 | 47 | 70.33 | 50 | 22 | 31 | |
| Tree based | 70.33 | 50 | 19 | 27 | 69.23 | 43 | 11 | 18 | 67.03 | 20 | 4 | 6 | 67.03 | 20 | 2 | 6 | |
| Naive Bayes | RFE | 82.41 | 72 | 63 | 68 | 52.75 | 39 | 100 | 56 | 52.75 | 39 | 100 | 56 | 57.14 | 41 | 96 | 57 |
| Lasso | 87.01 | 81 | 78 | 79 | 85.71 | 75 | 78 | 76 | 72.53 | 52 | 100 | 68 | 62.44 | 44 | 96 | 60 | |
| Chi-Square | 51.25 | 38 | 100 | 55 | 53.85 | 39 | 100 | 56 | 61.54 | 43 | 96 | 60 | 61.54 | 43 | 96 | 60 | |
| Tree based | 87.91 | 75 | 89 | 81 | 84.62 | 72 | 78 | 75 | 84.62 | 72 | 78 | 75 | 81.32 | 68 | 70 | 69 | |
| ANN | RFE | 82.41 | 61 | 77 | 68 | 82.41 | 65 | 65 | 65 | 81.32 | 79 | 54 | 64 | 80.22 | 62 | 81 | 70 |
| Lasso | 87.91 | 76 | 73 | 74 | 79.12 | 60 | 96 | 74 | 81.31 | 68 | 54 | 60 | 76.92 | 56 | 72 | 63 | |
| Chi-Square | 87.91 | 82 | 79 | 81 | 86.81 | 81 | 76 | 79 | 82.41 | 80 | 71 | 75 | 83.51 | 86 | 48 | 62 | |
| Tree based | NA | NA | NA | 73.62 | 73.62 | 37 | 48 | 30 | 80.22 | 59 | 83 | 69 | 71.42 | 0 | 0 | 0 | |
5.2 Performance Comparison
A comparison has been performed regarding the overall accuracy of the models. The 15 feature sets are chosen using the Chi-square model and the 25 feature sets produced using RFE and the Chi-square model have the best SVM accuracy, which is 92.31 %. SVM, however, performs better in terms of complexity and resource usage [55]. For the same 15 characteristics of the Chi-square model, the accuracy, recall, and F1-score are 95 %, 76 %, and 81 %, respectively. Precision is crucial in addition to overall accuracy since it indicates what percentage of a positive forecast is accurate [56]. With the 25 features obtained using the tree-based feature selection model, Adda Boost has the highest precision, which is 96.87 %, however, adaptive boosting is a more sophisticated technique and requires more resources. With the Chi-square model-derived set of 15, 20, and 25 features, SVM likewise produces high accuracy, which is 95%. Figure 5, 6, 7 and 8 display the performance of various machine learning models on feature sets chosen using various feature selection algorithms.


The ratio of accurately anticipated positives to all actual positives is provided by the recall, true positive rate, sensitivity, or hit rate. For 10 feature sets chosen by the Chi-square model, 15 feature sets chosen by the RFE and Chi-square model, and 20 feature sets chosen by the RFE and LASSO model, the value of recall for Naive Bayes is greatest, being 100% for each of these feature sets. The model’s approach is based on the fact that each character is independent of the others, which is not quite true in this case. For instance, ageing affects hypertension (HTN). Similar to this, diabetes mellitus (DM) may be inherited, develop from obesity, or both, and may contribute to congestive heart failure (CHF). The SVM classifier can be suggested for predicting cardiovascular disease based on the aforementioned justifications.


The confusion matrix is one of the finest ways to evaluate a classification model’s effectiveness [57]. Figure 9 displays the bar graph of the confusion matrix for several machine learning models. SVM classifiers with RFE feature selection models often provide the highest level of accuracy for CVD classification.

5.3 Validation
Four data sets, Cleveland, Hungarian, Switzerland, and Long Beach, VA have been combined to validate the performance of the suggested model. There are thirteen features in the dataset, including serum cholesterol level (chol), age, sex, maximum heart rate (thalach), chest pain (cp), exercise-induced angina (exang), resting blood pressure (trestbps), fasting blood sugar (fbs), resting ECG result (restecg), the slope of the peak exercise ST segment (slope), ST depression caused by exercise relative to rest (oldpeak), number of major vessels (0-3) coloured by flouroscopy (ca) (thal). The combined data is run through an SVM model, which produced an accuracy of 78%; however, when the data is run through the suggested model, the accuracy is increased to 83%. Table 5 compares several techniques based on CVD classification accuracy.
| Previous Work | Data | Technique | Accuracy | ||
| Babi et-al, 2017 [58] | Cleveland, Hungarian, Switzerland and | Neural Networks | 89.93 | ||
| Long Beach VA, and South | |||||
| Africa Heart Disease data | SVM | 73.70 | |||
| Z-Alizadeh Sani Dataset | SVM | 86.67 | |||
| Haq et-al, 2018 [59] | Cleveland heart disease | Hybrid Intelligent System | 89 & 88 | ||
| Mohan et-al, 2019 [60] | Cleveland dataset |
|
88.70 | ||
| Ali et-al, 2019 [61] | Cleveland heart disease database | Stacked SVM based expert system | 91.11 | ||
| Hashi et-ql, 2020 [62] | Cleveland Heart Disease dataset | Hyper-parameter Tuned SVM | 89.23 | ||
| Spencer et-al, 2020 [63] | Combination of four data set | BayesNet | 85.00 | ||
| (Cleveland, Long-Beach-VA, Hungarian | |||||
| and Switzerland dataset) | |||||
| data set 2016 | Framework LR and SVM | ||||
| Dissanayake et-al, 2021 [64] | Cleveland Heart Disease dataset | Decision Tree | 88.52 | ||
| Pal et-al, 2022 [41] | CVD data from UCI | K-NN, MLP | 73.77, 82.47 | ||
| Proposed | Z-Alizadeh Sani data | SVM with RFE | 92.31 | ||
| Combined heart disease dataset | SVM (without feature selection) | 78.00 | |||
| Cleveland, Switzerland, Hungarian, | SVM with RFE | 82.10 | |||
| and Long-beach-VA |
6 Conclusion
The early identification of heart disease can help for preventing premature death through effective treatment. The analysis of several characteristics for CVD prediction using ML models is presented in this paper. With the best accuracy of 92.31%, SVM surpasses all other ML models for all feature sets, and this is accomplished by using 15 and 25 feature sets chosen by chi-square models and 25 feature sets chosen by RFE models, respectively. The chi-square model is discovered to be the best for feature selection. Overall, it can be claimed that SVM with RFE is the most effective method for classifying CVDs. In future research, we will try to evaluate the proposed hybrid model with a bigger data set with a vast range of features. We will also consider the integration of the proposed model with Electronic Health Records through Internet-of-Medical Things (IoMT) platform. It would allow to have remote monitoring of critical condition of CVD patient for smart healthcare management.
References
- [1] Shah Haque, Syed Aziz, and Mustafizur Rahman. Review of cyber-physical system in healthcare. International Journal of Distributed Sensor Networks, 2014:20, 04 2014.
- [2] Jyoti Srivastava, Sidheswar Routray, Sultan Ahmad, and Mohammad Maqbool Waris. Internet of medical things (IoMT)-Based smart healthcare system: Trends and progress. Comput Intell Neurosci, 2022:7218113, July 2022.
- [3] Ruby Dwivedi, Divya Mehrotra, and Shaleen Chandra. Potential of internet of medical things (IoMT) applications in building a smart healthcare system: A systematic review. Journal of Oral Biology and Craniofacial Research, 12(2):302–318, 2022.
- [4] World health organisation. Online; accessed 22-May-2022.
- [5] World heart federation. Online; accessed 22-May-2022.
- [6] Mohamed Hammad, Abdullah M Iliyasu, Abdulhamit Subasi, Edmond SL Ho, and Ahmed A Abd El-Latif. A multitier deep learning model for arrhythmia detection. IEEE Transactions on Instrumentation and Measurement, 70:1–9, 2020.
- [7] Sumaiya Shomaji, Parisa Dehghanzadeh, Alex Roman, Domenic Forte, Swarup Bhunia, and Soumyajit Mandal. Early detection of cardiovascular diseases using wearable ultrasound device. IEEE Consumer Electronics Magazine, 8(6):12–21, 2019.
- [8] Ping Wu, Riccardo MG Ferrari, Yichao Liu, and Jan-Willem Van Wingerden. Data-driven incipient fault detection via canonical variate dissimilarity and mixed kernel principal component analysis. IEEE Transactions on Industrial Informatics, 17(8):5380–5390, 2020.
- [9] Rajkumar Gangappa Nadakinamani, A. Reyana, Sandeep Kautish, A. S. Vibith, Yogita Gupta, Sayed F. Abdelwahab, and Ali Wagdy Mohamed. Clinical data analysis for prediction of cardiovascular disease using machine learning techniques. Computational Intelligence and Neuroscience, 2022:2973324, Jan 2022.
- [10] Amit M. Joshi, Prateek Jain, Saraju P. Mohanty, and Navneet Agrawal. iGLU 2.0: A new wearable for accurate non-invasive continuous serum glucose measurement in iomt framework. IEEE Transactions on Consumer Electronics, 66(4):327–335, 2020.
- [11] Geetanjali Sharma and Amit M Joshi. SzHNN: a novel and scalable deep convolution hybrid neural network framework for schizophrenia detection using multichannel eeg. IEEE Transactions on Instrumentation and Measurement, 71:1–9, 2022.
- [12] Himanshu Thapliyal, Vladislav Khalus, and Carson Labrado. Stress detection and management: A survey of wearable smart health devices. IEEE Consumer Electronics Magazine, 6(4):64–69, 2017.
- [13] Sibi C. Sethuraman, Pranav Kompally, Saraju P. Mohanty, and Uma Choppali. Mywear: A novel smart garment for automatic continuous vital monitoring. IEEE Transactions on Consumer Electronics, 67(3):214–222, 2021.
- [14] Prasenjit Maji, Hemanta Kumar Mondal, Arka Prava Roy, Soumyajit Poddar, and Saraju P. Mohanty. ikardo: An intelligent ECG device for automatic critical beat identification for smart healthcare. IEEE Transactions on Consumer Electronics, 67(4):235–243, 2021.
- [15] Amit M Joshi, Prateek Jain, and Saraju P Mohanty. iGLU 3.0: a secure noninvasive glucometer and automatic insulin delivery system in iomt. IEEE Transactions on Consumer Electronics, 68(1):14–22, 2022.
- [16] Prateek Jain, Amit M Joshi, and Saraju P Mohanty. iGLU 1.1: towards a glucose-insulin model based closed loop iomt framework for automatic insulin control of diabetic patients. In 2020 IEEE 6th World Forum on Internet of Things (WF-IoT), pages 1–6. IEEE, 2020.
- [17] Geetanjali Sharma, Abhishek Parashar, and Amit M Joshi. DepHNN: a novel hybrid neural network for electroencephalogram (EEG)-based screening of depression. Biomedical signal processing and control, 66:102393, 2021.
- [18] Jun-Liang Lin, Hsien-Chieh Liu, Yu-Ting Tai, Hsin-Hsien Wu, Shuo-Jen Hsu, Fu-Shan Jaw, and You-Yin Chen. The development of wireless sensor network for ECG monitoring. Conf Proc IEEE Eng Med Biol Soc, 2006:3513–3516, 2006.
- [19] Nilanjan Dey, Amira S. Ashour, Fuqian Shi, Simon James Fong, and R. Simon Sherratt. Developing residential wireless sensor networks for ECG healthcare monitoring. IEEE Transactions on Consumer Electronics, 63(4):442–449, 2017.
- [20] Shuenn-Yuh Lee, Peng-Wei Huang, Ming-Chun Liang, Jia-Hua Hong, and Ju-Yi Chen. Development of an arrhythmia monitoring system and human study. IEEE Transactions on Consumer Electronics, 64(4):442–451, 2018.
- [21] Dhruv R. Seshadri, Ryan T. Li, James E. Voos, James R. Rowbottom, Celeste M. Alfes, Christian A. Zorman, and Colin K. Drummond. Wearable sensors for monitoring the physiological and biochemical profile of the athlete. NPJ Digital Medicine, 2(1):72, Jul 2019.
- [22] Nicholas Pudjihartono, Tayaza Fadason, Andreas W. Kempa-Liehr, and Justin M. O’Sullivan. A review of feature selection methods for machine learning-based disease risk prediction. Frontiers in Bioinformatics, 2, 2022.
- [23] Jianyu Miao and Lingfeng Niu. A survey on feature selection. Procedia Computer Science, 91:919–926, 12 2016.
- [24] Tamanna Yesmin Rashme, Linta Islam, Sohely Jahan, and Ayesha Aziz Prova. Early prediction of cardiovascular diseases using feature selection and machine learning techniques. In 2021 6th International Conference on Communication and Electronics Systems (ICCES), pages 1554–1559, 2021.
- [25] Sripal Bangalore Chayakrit Krittanawong1, Hafeez Ul Hassan Virk. Machine learning prediction in cardiovascular diseases: a meta-analysis. Scientific Reports, 10:2045–2322, 9 2020.
- [26] Amirata Ghorbani, David Ouyang, Abubakar Abid, Bryan He, Jonathan H Chen, Robert A Harrington, David H Liang, Euan A Ashley, and James Y Zou. Deep learning interpretation of echocardiograms. NPJ digital medicine, 3(1):1–10, 2020.
- [27] Abdallah Abdellatif, Hamdan Abdellatef, Jeevan Kanesan, Chee-Onn Chow, Joon Huang Chuah, and Hassan Muwafaq Gheni. Improving the heart disease detection and patients survival using supervised infinite feature selection and improved weighted random forest. IEEE Access, 10:67363–67372, 2022.
- [28] Yukun Bao Najmul Hasan. Comparing different feature selection algorithms for cardiovascular disease prediction. Health and Technology, 11:49–52, 01 2021.
- [29] Debjani Panda, Ratula Ray, Azian Azamimi Abdullah, and Satya Ranjan Dash. Predictive systems: Role of feature selection in prediction of heart disease. Journal of Physics: Conference Series, 1372(1):012074, nov 2019.
- [30] Swati Shilaskar and Ashok Ghatol. Feature selection for medical diagnosis: Evaluation for cardiovascular diseases. Expert Systems with Applications, 40(10):4146–4153, 2013.
- [31] B. P. Marquez M. R. Segura, O. Nicolis and J. Carrillo Azocar. Predicting cardiovascular disease by combining optimal feature selection methods with machine learning. In 2020 39th International Conference of the Chilean Computer Science Society (SCCC), pages 1–8, 2020.
- [32] Ibashisha A. Marbaniang, Nurul Amin Choudhury, and Soumen Moulik. Cardiovascular disease (CVD) prediction using machine learning algorithms. In 2020 IEEE 17th India Council International Conference (INDICON), pages 1–6, 2020.
- [33] Madhuri Panwar, Arvind Gautam, Rashi Dutt, and Amit Acharyya. Cardionet: Deep learning framework for prediction of CVD risk factors. In 2020 IEEE International Symposium on Circuits and Systems (ISCAS), pages 1–5, 2020.
- [34] Swati Shilaskar and Ashok Ghatol. Feature selection for medical diagnosis: Evaluation for cardiovascular diseases. Expert Systems with Applications, 40(10):4146–4153, 2013.
- [35] Xin Qian, Yu Li, Xianghui Zhang, Heng Guo, Jia He, Xinping Wang, Yizhong Yan, Jiaolong Ma, Rulin Ma, and Shuxia Guo. A cardiovascular disease prediction model based on routine physical examination indicators using machine learning methods: A cohort study. Frontiers in cardiovascular medicine, 9, 2022.
- [36] Li Yang, Haibin Wu, Xiaoqing Jin, Pinpin Zheng, Shiyun Hu, Xiaoling Xu, Wei Yu, and Jing Yan. Study of cardiovascular disease prediction model based on random forest in eastern china. Scientific Reports, 10(1):5245, Mar 2020.
- [37] Syed Nawaz Pasha, Dadi Ramesh, Sallauddin Mohmmad, A. Harshavardhan, and Shabana. Cardiovascular disease prediction using deep learning techniques. IOP Conference Series: Materials Science and Engineering, 981(2):022006, dec 2020.
- [38] Armin Yazdani, Kasturi Dewi Varathan, Yin Kia Chiam, Asad Waqar Malik, and Wan Azman Wan Ahmad. A novel approach for heart disease prediction using strength scores with significant predictors. BMC Medical Informatics and Decision Making, 21(1):194, Jun 2021.
- [39] M. Swathy and K. Saruladha. A comparative study of classification and prediction of cardio-vascular diseases (CVD) using machine learning and deep learning techniques. ICT Express, 8(1):109–116, 2022.
- [40] Malathi S, Arockia Raj Y, Abhishek Kumar, V D Ashok Kumar, Ankit Kumar, Elangovan D, V D Ambeth Kumar, Chitra B, and a Abirami. Prediction of cardiovascular disease using deep learning algorithms to prevent covid 19. Journal of Experimental and Theoretical Artificial Intelligence, 0(0):1–15, 2021.
- [41] Madhumita Pal, Smita Parija, Ganapati Panda, Kuldeep Dhama, and Ranjan K Mohapatra. Risk prediction of cardiovascular disease using machine learning classifiers. Open Med (Wars), 17(1):1100–1113, jun 2022.
- [42] Yunxing Jiang, Xianghui Zhang, Rulin Ma, Xinping Wang, Jiaming Liu, Mulatibieke Keerman, Yizhong Yan, Jiaolong Ma, Yanpeng Song, Jingyu Zhang, Jia He, Shuxia Guo, and Heng Guo. Cardiovascular disease prediction by machine learning algorithms based on cytokines in kazakhs of china. Clin Epidemiol, 13:417–428, jun 2021.
- [43] Rubini Pe, C Subasini, A Katharine, V Kumaresan, S Gowdhamkumar, and T Nithya. A cardiovascular disease prediction using machine learning algorithms. Annals of the Romanian Society for Cell Biology, 25:904–912, 01 2021.
- [44] Fahim Sufi and Ibrahim Khalil. Diagnosis of cardiovascular abnormalities from compressed ECG: a data mining-based approach. IEEE Transactions on Information Technology in Biomedicine, 15(1):33–39, 2011.
- [45] Aqsa Rahim, Yawar Rasheed, Farooque Azam, Muhammad Waseem Anwar, Muhammad Abdul Rahim, and Abdul Wahab Muzaffar. An integrated machine learning framework for effective prediction of cardiovascular diseases. IEEE Access, 9:106575–106588, 2021.
- [46] Maqsood Hayat Yar Muhammad, Muhammad Tahir and Kil To Chong. Early and accurate detection and diagnosis of heart disease using intelligent computational model. Scientific Reports, 10:2045–2322, 2020.
- [47] Amit M Joshi, Prateek Jain, and Saraju P Mohanty. Secure-iGLU: A secure device for noninvasive glucose measurement and automatic insulin delivery in iomt framework. In 2020 IEEE Computer Society Annual Symposium on VLSI (ISVLSI), pages 440–445. IEEE, 2020.
- [48] Guang-Yao Zang Yang Yan, Jia-Wen Zhang and Jun Pu. The primary use of artificial intelligence in cardiovascular diseases: what kind of potential role does artificial intelligence play in future medicine. Journal of geriatric cardiology: JGC, 16,8:585–591, 2019.
- [49] Wael Saade et-al Silvia Romiti, Mattia Vinciguerra. Artificial intelligence (ai) and cardiovascular diseases: An unexpected alliance. Cardiology Research and Practice, Hindawi, 2020.
- [50] Sidharth Pancholi and Amit M Joshi. Intelligent upper-limb prosthetic control (iULP) with novel feature extraction method for pattern recognition using emg. Journal of Mechanics in Medicine and Biology, 21(06):2150043, 2021.
- [51] Zeinab Arabasadi, Roohallah Alizadehsani, Mohamad Roshanzamir, Hossein Moosaei, and Ali Asghar Yarifard. Computer aided decision making for heart disease detection using hybrid neural network-genetic algorithm. Computer Methods and Programs in Biomedicine, 141:19–26, 2017.
- [52] Roohallah Alizadehsani, Jafar Habibi, Mohammad Javad Hosseini, Hoda Mashayekhi, Reihane Boghrati, Asma Ghandeharioun, Behdad Bahadorian, and Zahra Alizadeh Sani. A data mining approach for diagnosis of coronary artery disease. Computer Methods and Programs in Biomedicine, 111(1):52–61, 2013.
- [53] Roohallah Alizadehsani, Mohammad Hossein Zangooei, Mohammad Javad Hosseini, Jafar Habibi, Abbas Khosravi, Mohamad Roshanzamir, Fahime Khozeimeh, Nizal Sarrafzadegan, and Saeid Nahavandi. Coronary artery disease detection using computational intelligence methods. Knowledge-Based Systems, 109:187–197, 2016.
- [54] Pranali Kokate, Sidharth Pancholi, and Amit M Joshi. Classification of upper arm movements from EEG signals using machine learning with ica analysis. arXiv preprint arXiv:2107.08514, 2021.
- [55] Amit M Joshi, Kordana Divya, Hemlata Chhajed, and Rakam Sai Kamal. FPGA implementation of multivariate support vector regression for non-invasive blood glucose estimation using IoMT framework. In IoT Applications for Healthcare Systems, pages 77–90. Springer, 2022.
- [56] Nidhi Sinha and AMIT MAHESH JOSHI. Predicting the presence of left ventricular hypertrophy using este’s criteria with support vector machine. Research Square preprint, 2022.
- [57] Sidharth Pancholi and Amit M Joshi. Novel time domain based upper-limb prosthesis control using incremental learning approach. arXiv preprint arXiv:2109.04194, 2021.
- [58] František Babič, Jaroslav Olejár, Zuzana Vantová, and Ján Paralič. Predictive and descriptive analysis for heart disease diagnosis. In 2017 federated conference on computer science and information systems (fedcsis), pages 155–163. IEEE, 2017.
- [59] Muhammad Hammad Memon et-al Amin Ul Haq, Jian Ping Li. A hybrid intelligent system framework for the prediction of heart disease using machine learning algorithms. Mobile Information Systems Hindawi, 1574-017X:2045–2322, 2018.
- [60] Senthilkumar Mohan, Chandrasegar Thirumalai, and Gautam Srivastava. Effective heart disease prediction using hybrid machine learning techniques. IEEE Access, 7:81542–81554, 2019.
- [61] Liaqat Ali, Awais Niamat, Javed Ali Khan, Noorbakhsh Amiri Golilarz, Xiong Xingzhong, Adeeb Noor, Redhwan Nour, and Syed Ahmad Chan Bukhari. An optimized stacked support vector machines based expert system for the effective prediction of heart failure. IEEE Access, 7:54007–54014, 2019.
- [62] Emrana Kabir Hashi and Md. Shahid Uz Zaman. Developing a hyperparameter tuning based machine learning approach of heart disease prediction. Journal of Applied Science and Process Engineering, 7(2), 2020.
- [63] Robinson Spencer, Fadi Thabtah, Neda Abdelhamid, and Michael Thompson. Exploring feature selection and classification methods for predicting heart disease. Digital health, 6:2055207620914777, 2020.
- [64] Kaushalya Dissanayake and Md Gapar Md Johar. Comparative study on heart disease prediction using feature selection techniques on classification algorithms. Applied Computational Intelligence and Soft Computing, 2021.
About the Authors’
![[Uncaptioned image]](2212.08022v1/Images/nidhisinha.jpg) Nidhi Sinha(Member, IEEE) is a research scholar in Electronics and Communication Department at MNIT Jaipur, Rajasthan, and doing her research in field of Early detection of Cardiovascular Failure using Machine Learning and AI. She is also working as Data Scientist at Konverge.AI, Pune (remotely). She has experience in the Machine Learning and Artificial Intelligence project deployment as well as in the field of solar cell design and has published research papers in International Journals and Conferences.
Nidhi Sinha(Member, IEEE) is a research scholar in Electronics and Communication Department at MNIT Jaipur, Rajasthan, and doing her research in field of Early detection of Cardiovascular Failure using Machine Learning and AI. She is also working as Data Scientist at Konverge.AI, Pune (remotely). She has experience in the Machine Learning and Artificial Intelligence project deployment as well as in the field of solar cell design and has published research papers in International Journals and Conferences.
![[Uncaptioned image]](2212.08022v1/Images/teena.png) Teena Jangid has completed her post-graduation in VLSI-Design from MNIT Jaipur, Rajasthan. She has done research in the field of Early detection of Cardiovascular Failure using Machine learning and AI. She is currently working as Design Verification Engineer at MeyvnSystems Pvt Ltd.
Teena Jangid has completed her post-graduation in VLSI-Design from MNIT Jaipur, Rajasthan. She has done research in the field of Early detection of Cardiovascular Failure using Machine learning and AI. She is currently working as Design Verification Engineer at MeyvnSystems Pvt Ltd.
![[Uncaptioned image]](2212.08022v1/Images/amitjoshi.png) Dr. Amit M. Joshi (Senior Member, IEEE) completed his M.Tech and PhD from NIT, Surat, in 2009 and 2015, respectively. He is currently an Assistant Professor at Malaviya National Institute of Technology, Jaipur (MNIT Jaipur) since July 2013. His area of specialization is Biomedical signal processing, Smart healthcare, VLSI DSP Systems, and embedded system design. He is a senior member of IEEE, IETE and a member of IEEE. He has published 100+ research articles in excellent peer-reviewed international journals/conferences and six book chapters. He has a total of 1000+ google scholar citations, an i10 index of 33, and an H-index of 17. He served as a reviewer of technical journals such as IEEE Transactions IEEE Access, Springer, and Elsevier and as a Technical Programme Committee member for IEEE conferences (iSES, ICCE, ISVLSI, VDAT). He also received the honour of a UGC Travel fellowship, the SERB DST Travel grant award, and a CSIR fellowship and also attended well-known IEEE Conferences TENCON-16, TENCON-17, ISCAS-18, MENACOMM-19, etc. across the world. He has also served as Mentor for IEEE Engineering in Medicine and Biology Society student mentorship program 2021. He has supervised 4 PhD thesis and 26 M.Tech projects, and 17 B.Tech projects in Biomedical Signal Processing, VLSI/Embedded Systems.
Dr. Amit M. Joshi (Senior Member, IEEE) completed his M.Tech and PhD from NIT, Surat, in 2009 and 2015, respectively. He is currently an Assistant Professor at Malaviya National Institute of Technology, Jaipur (MNIT Jaipur) since July 2013. His area of specialization is Biomedical signal processing, Smart healthcare, VLSI DSP Systems, and embedded system design. He is a senior member of IEEE, IETE and a member of IEEE. He has published 100+ research articles in excellent peer-reviewed international journals/conferences and six book chapters. He has a total of 1000+ google scholar citations, an i10 index of 33, and an H-index of 17. He served as a reviewer of technical journals such as IEEE Transactions IEEE Access, Springer, and Elsevier and as a Technical Programme Committee member for IEEE conferences (iSES, ICCE, ISVLSI, VDAT). He also received the honour of a UGC Travel fellowship, the SERB DST Travel grant award, and a CSIR fellowship and also attended well-known IEEE Conferences TENCON-16, TENCON-17, ISCAS-18, MENACOMM-19, etc. across the world. He has also served as Mentor for IEEE Engineering in Medicine and Biology Society student mentorship program 2021. He has supervised 4 PhD thesis and 26 M.Tech projects, and 17 B.Tech projects in Biomedical Signal Processing, VLSI/Embedded Systems.
![[Uncaptioned image]](2212.08022v1/Images/sarju.png) Saraju P. Mohanty (Senior Member, IEEE) received a bachelor’s degree (Honors) in electrical engineering from the Orissa University of Agriculture and Technology, Bhubaneswar, in 1995, the master’s degree in Systems Science and Automation from the Indian Institute of Science, Bengaluru, in 1999, and the Ph.D. degree in Computer Science and Engineering from the University of South Florida, Tampa, in 2003. He is a Professor with the University of North Texas. His research is in ”Smart Electronic Systems” which has been funded by National Science Foundations (NSF), Semiconductor Research Corporation (SRC), US Air Force, IUSSTF, and Mission Innovation. He has authored 450 research articles, 4 books, and invented 9 granted/pending patents. His Google Scholar h-index is 47 and i10-index is 203 with 10300 citations. He is a recipient of 14 best paper awards, Fulbright Specialist Award in 2020, IEEE Consumer Electronics Society Outstanding Service Award in 2020, the IEEE-CS-TCVLSI Distinguished Leadership Award in 2018, and the PROSE Award for Best Textbook in Physical Sciences and Mathematics category in 2016. He has delivered 15 keynotes and served on 13 panels at various International Conferences. He has been the Editor-in-Chief of the IEEE Consumer Electronics Magazine during 2016-2021 and currently serves on the editorial board of six journals/transactions.
Saraju P. Mohanty (Senior Member, IEEE) received a bachelor’s degree (Honors) in electrical engineering from the Orissa University of Agriculture and Technology, Bhubaneswar, in 1995, the master’s degree in Systems Science and Automation from the Indian Institute of Science, Bengaluru, in 1999, and the Ph.D. degree in Computer Science and Engineering from the University of South Florida, Tampa, in 2003. He is a Professor with the University of North Texas. His research is in ”Smart Electronic Systems” which has been funded by National Science Foundations (NSF), Semiconductor Research Corporation (SRC), US Air Force, IUSSTF, and Mission Innovation. He has authored 450 research articles, 4 books, and invented 9 granted/pending patents. His Google Scholar h-index is 47 and i10-index is 203 with 10300 citations. He is a recipient of 14 best paper awards, Fulbright Specialist Award in 2020, IEEE Consumer Electronics Society Outstanding Service Award in 2020, the IEEE-CS-TCVLSI Distinguished Leadership Award in 2018, and the PROSE Award for Best Textbook in Physical Sciences and Mathematics category in 2016. He has delivered 15 keynotes and served on 13 panels at various International Conferences. He has been the Editor-in-Chief of the IEEE Consumer Electronics Magazine during 2016-2021 and currently serves on the editorial board of six journals/transactions.