GCM Constraints on the Detectability of the CO2-CH4 Biosignature Pair on TRAPPIST-1e with JWST
Abstract
Terrestrial exoplanets such as TRAPPIST-1e will be observed in a new capacity with JWST/NIRSpec, which is expected to be able to detect CO2, CH4, and O2 signals, if present, with multiple co-added transit observations. The CO2-CH4 pair in particular is theorized to be a potential biosignature when inferred to be in chemical disequilibrium. Here, we simulate TRAPPIST-1e’s atmosphere using the ExoCAM General Circulation Model (GCM), assuming an optimistic haze-free, tidally locked planet with an aquaplanet surface, with varying atmospheric compositions from bar to 1 bar of partial CO2 pressure with 1 bar of background N2. We investigate cases both with and without a modern Earth-like CH4 mixing ratio to examine the effect of CO2 and CH4 on the transmission spectrum and climate state of the planet. We demonstrate that in the optimistic haze-free cloudy case, H2O, CO2, and CH4 could all be detectable in less than 50 transits within an atmosphere of 1 bar N2 and 10 mbar CO2 during JWST’s lifespan with NIRSpec as long as the noise floor is 10 ppm. We find that in these optimistic cases, JWST may be able to detect potential biosignature pairs such as CO2-CH4 in TRAPPIST-1e’s atmosphere across a variety of atmospheric CO2 content, and that temporal climate variability does not significantly affect spectral feature variability for NIRSpec PRISM.
(Accepted to ApJL, Dec. 9, 2022)
I Introduction
JWST is expected to have the capability to characterize the atmospheric composition of temperate rocky planets. In particular, the NIRSpec PRISM instrument will likely have the ability to identify spectral features in the atmospheres of temperate terrestrial exoplanets in as few as ten transits (Batalha et al. 2014; Batalha et al. 2018; Fauchez et al. 2019; Birkmann et al. 2022). NIRSpec’s broad wavelength range of m and moderate resolution of (Jakobsen et al. 2022) make it ideal for constraining spectral features of multiple habitability indicators and biosignatures including H2O, CO2, and CH4 (Fauchez et al. 2019). Simultaneous measurements with NIRSpec PRISM across a broad wavelength range, which would include multiple spectral features at different wavelengths, can enhance the signal-to-noise ratio of these species.
TRAPPIST-1 is an ultracool M8V dwarf star ( K) at a distance of twelve parsecs, with seven known planetary companions (Liebert & Gizis 2006; Gillon et al. 2016; Gillon et al. 2017). Of these, planets e, f, and g are all potentially within the habitable zone of their planet, although f and g would require atmospheres with a greenhouse gas complement beyond H2O, e.g., with CO2 and/or CH4, due to their lower received flux (Kasting et al. 1993; Kopparapu et al. 2013; Gillon et al. 2017; Lincowski et al. 2018). However, e has previously been shown to feasibly sustain some amount of liquid surface water under a much wider variety of atmospheric surface pressures than f or g (Turbet et al. 2018; Sergeev et al. 2022b), and is among the most likely known exoplanets to host surface liquid water (Wolf 2017). It will be observed throughout four transits with NIRSpec PRISM during JWST’s Cycle 1 (GTO 1331, PI: Lewis), which may be enough to partially characterize its atmosphere (Morley et al. 2017; Fauchez et al. 2019; Lustig-Yaeger et al. 2019), and may in the future be complemented by reflection and emission spectra from ELT (Lin & Kaltenegger 2022). JWST is expected to be able to view TRAPPIST-1e transiting a maximum of 85 times during its nominal 5.5 year lifetime (Lustig-Yaeger et al. 2019; Komacek et al. 2020). However, with the recent increase of JWST’s potential lifetime to 20 years (Rigby et al. 2022), TRAPPIST-1e may be viewable up to 320 times during transit, well past the required number of transits predicted to identify molecular spectral signatures (Lustig-Yaeger et al. 2019; Komacek et al. 2020).
TRAPPIST-1e has a near-Earth like radius and density, and receives 60% of Earth’s incident flux (Gillon et al. 2017). It is likely either tidally locked or in a higher-order orbital resonance (Turbet et al. 2018), with an orbital period of days (Gillon et al. 2017). TRAPPIST-1e may be an aquaplanet, as shown by Agol et al. 2021, which identified TRAPPIST-1e’s density as using transit-timing variations, and found that if iron makes up 25% of the total planetary mass, there should be a higher water mass fraction than Earth’s to account for the calculated density. Observations to date have only ruled out a hydrogen-rich atmosphere for TRAPPIST-1e, with a lack of strong spectral features observed with HST/WFC3 implying a terrestrial planet with a higher mean molecular weight atmosphere (de Wit et al. 2018). If TRAPPIST-1e is tidally locked and sustains surface liquid water, water vapor signal strength in transit spectroscopy may be dependent on cloud cover, as water clouds would flatten the spectral features by increasing the continuum height, requiring more transits to identify spectral features with certainty (Greene et al. 2016; Fauchez et al. 2019; Suissa et al. 2020; Mikal-Evans 2021).
It has been previously demonstrated that, similar to the O2CH4 biosignature pair (Krissansen-Totton et al. 2018b; Meadows et al. 2018), CO2CH4 could serve as a biosignature when seen in disequilibrium in a planetary atmosphere (Kleinböhl et al. 2018; Mikal-Evans 2021). Life could also drive the atmospheric chemistry to equilibrium via catalysis. However, in order to study the potential to observationally assess the inhabitance of a planet with JWST, we focus here on the previously proposed CO2-CH4 disequilibrium pair as a possible biosignature (Meadows et al. 2018). The O2CH4 pair is harder to characterize as a biotic reaction for TRAPPIST-1e due to the likelihood of O2/O3 false positives in transit spectra from pre-main sequence runaway greenhouse effects in water-rich planetary atmospheres orbiting M dwarfs (Tian et al. 2014; Wordsworth & Pierrehumbert 2014; Luger & Barnes 2015), making the CO2CH4 pair a better candidate to constrain the potential biosphere of TRAPPIST-1e. A lack of CO in a CH4-inclusive environment is only known to exist if that methane is produced biotically, as other methane sources (such as volcanic outgassing and high-frequency impact events) contain carbon monoxide as a byproduct (Krissansen-Totton et al. 2022). As such, atmospheres with significant CO2 and CH4 but little CO have the potential to be maintained biotically.
Previous work has shown that climatological factors such as the cloud cover and day-night heat transport on tidally locked rocky exoplanets depend strongly on the coupled planetary parameters of rotation rate and instellation (Yang et al. 2013; Wolf 2017; Turbet et al. 2018; Fauchez et al. 2019; Shields 2019; Suissa et al. 2020). For tidally locked planets such as TRAPPIST-1e, it is expected that the climate is characterized by day-night temperature contrasts, with a hot and cloudy substellar point and a cold and less cloudy antistellar point (Merlis & Schneider 2010; Showman et al. 2013; Yang et al. 2013; Koll & Abbot 2016). TRAPPIST-1e in particular is a special case, that falls between the Rhines (or intermediate) rotator and the fast rotator regimes (Showman et al. 2013; Haqq-Misra et al. 2018; Sergeev et al. 2022a). As such, it is expected to contain aspects of both regimes, depending on atmospheric composition; while the day-night temperature contrast should be large as in intermediate-rotating tidally-locked planets, there may also be a superrotating eastward jet in the tropics, with large cyclonic eddies in the extratropics formed by the day-night contrast causing a global standing wave pattern, as expected on a fast rotator (Showman et al. 2013). In this case, the weak temperature gradient (WTG) parameter, which encapsulates the effect of rotation on planetary-scale atmospheric dynamics, is , as predicted in Pierrehumbert & Hammond 2019 for a Rhines rotator tidally-locked planet . However, the climate state of this model includes a superrotating equatorial jet, as predicted for a fast rotator, which arises from TRAPPIST-1e’s unique bistablity given its location at the edge of the fast and Rhines rotator regimes (Haqq-Misra et al. 2018; Sergeev et al. 2022a).
Significant temporal variability is expected in the climates of tidally-locked planets with rotation periods similar to TRAPPIST-1e, although its mechanism may be difficult to identify, and is likely related to planetary-scale wave propagation (Pierrehumbert & Hammond 2019; Song & Yang 2021; Cohen et al. 2022). Additionally, a longitudinally-asymmetric stratospheric oscillation (LASO), analogous to Earth’s quasi-biennial oscillation (QBO) and caused by vertical propagation of gravity waves, emerges in GCMs of Proxima Centauri b, an intermediate-rotating tidally locked rocky planet (Cohen et al. 2021). As such, there may be a temporal variation in the stratospheric temperature and humidity the resulting cloud cover, which could amplify the expected variability in transmission signal strength at the limb. However, any east-west limb asymmetry is likely small and undetectable with JWST (Song & Yang 2021).
For tidally locked planets exhibiting temporal variability, it is key to study the three-dimensional circulation; water vapor, cloud formation, and horizontal heat transport all require a three-dimensional model to properly simulate (Joshi et al. 1997; Pierrehumbert 2011; Fauchez et al. 2019; May et al. 2021). Likewise, for simulating transmission spectra of tidally locked planets, limb conditions are particularly important, which can only be consistently predicted along with dayside and nightside properties using a 3D GCM. Rotation rate of the planet also dictates the circulation regime (Noda et al. 2017; Krissansen-Totton et al. 2018a) and cloud transport (Showman et al. 2013), which cannot be sufficiently modeled in one dimension. As such, our motivation in this work requires use of a GCM rather than a one-dimensional model.
This work follows this structure: in Section II, we discuss our GCM simulations and parameters used, as well as the post-processing through the NASA Planetary Spectrum Generator and subsequent analysis. In Section III, we discuss transmission spectrum results for the 10-2 bar pCO2 case, their dependence on atmospheric climatology, and overarching trends across our full set of atmospheric cases with varying pCO2 and including/excluding CH4. In Section IV, we discuss the implications of our findings on biosignature detectability with JWST and their limitations. Finally, in Section V, we summarize our results and their significance for future transmission spectroscopy of TRAPPIST-1e with JWST.

II Methods
II.1 Atmospheric Model
Building upon previous modeling work by May et al. 2021, we simulate the climate dynamics of TRAPPIST-1e using the ExoCAM GCM11
1
https://github.com/storyofthewolf/ExoCAM (Wolf et al. 2022). ExoCAM utilizes the ExoRT22
2
https://github.com/storyofthewolf/ExoRT correlated-k radiative transfer scheme, which uses the HITRAN absorption database and the HELIOS-K opacity calculator (Rothman et al. 2005; Grimm & Heng 2015; Malik et al. 2017; Grimm et al. 2021).
We use a horizontal GCM resolution with 40 atmospheric layers and 28 correlated-k bins in the radiative transfer model. We simulate a grid of atmospheric compositions, composed of 1 bar of background N2 and CO2 partial pressure ranging from 10-4 to 1 bar logarithmically, both with and without an additional modern Earth-like CH4 partial pressure of bar. In keeping with previous literature (Wolf 2017; Turbet et al. 2018; Fauchez et al. 2021; May et al. 2021), we do not vary the N2 partial pressure and treat it as a background gas. However, we discuss the effect of different N2 partial pressures on the results in section IV.2.
The surface is assumed to be an aquaplanet with a slab ocean of uniform 50 meter depth, with the abundance of H2O determined by the saturation vapor pressure. The model includes sea ice and its resultant higher albedo, using the thermodynamic sea ice scheme from Bitz et al. 2012, which is standard for ExoCAM models. However, our sea ice scheme neglects ice drift, which has been demonstrated to affect climate and lower both surface temperature and liquid surface ocean area (Yang et al. 2020; Yue & Yang 2020).
We use the derived planetary parameters of TRAPPIST-1e of km and ms-2 from Gillon et al. 2017, and the updated stellar parameters of TRAPPIST-1 of and K from Kane 2018. We assume TRAPPIST-1e to be spin-synchronized with an orbital and rotation period of 6.099 days, and further assume zero obliquity and zero eccentricity. As in May et al. 2021, we use a model stellar spectrum from Allard et al. 2007, for an M dwarf with an effective temperature of 2600 K. The GCM was run until a steady state was reached in both net flux (incident stellar and thermal outwelling) and surface temperature, generally after 4555 simulated Earth years.
II.2 Spectrum Post-Processing
We post-process our ExoCAM GCMs with the NASA Goddard Planetary Spectrum Generator (PSG) Global Emisson Spectra (GlobES) API33
3
https://psg.gsfc.nasa.gov/apps/globes.php (Villanueva et al. 2018; Villanueva et al. 2022), which reads in converted GCM files and uses a radiative transfer model to calculate transmission through the planetary atmosphere in each atmospheric layer.
We then calculate a latitudinally-averaged transmission spectrum along the entire limb of the planet.
The
transmission spectrum is simulated using the correlated-k PUMAS model, with 20 bins, at the full limb at longitudes of from the substellar point. We produce 360 transit spectra taken as averages of 1 Earth day intervals from the last year of the GCM’s temporal evolution for each atmospheric case, to investigate any effect of year-long temporal variability within the climate on variability in transmission spectra.
The spectrum is generated with an instrumental configuration analogous to that of JWST NIRSpec PRISM, with a wavelength range of 0.65.3 m. We provide PSG with the same planetary and stellar parameters as the GCM (listed in II.1). In this model, limb-darkening is not considered. Atmospheric refraction is natively included, but is likely not important for TRAPPIST-1e due to the large angular size of TRAPPIST-1 (Doshi et al. 2022). The full 360 transit spectra for each of the ten cases are shown in Figure 1, along with the time-averaged continuum floor of each case.
To calculate the signal-to-noise ratio (SNR) of individual species, we bin our simulated PSG spectra to a resolution of , and simulate noise for the PSG transit spectra using PandExo44
4
https://natashabatalha.github.io/PandExo/ (Batalha et al. 2017) for noise calculation with NIRSpec PRISM’s resolution limits, as in May et al. 2021.
We vary the noise floor of NIRSpec across 0, 10, 30, and 50 ppm (as shown in Figure 1), for a final set of 4 transmission spectra with varying noise floor (which supercedes the photon noise only when the photon noise is lower) from each model day in each of our 10 cases with varying pCO2 and CH4.
II.3 Spectral Analysis
For each atmospheric case, we individually analyze all 360 spectra to identify detectability, and its dependence on atmospheric variability. We also post-process identical GCM cases to each atmospheric case, but where molecular species are individually removed from the PSG atmospheric parameters, to produce an identical spectrum without the effects of one species. The signal-to-noise ratio of a single day for a given species is then calculated as:
| (1) |
Here is the signal strength for a single wavelength in the species-inclusive case, is the signal strength for the missing-species case (or the continuum), is the noise from PandExo at the given wavelength in the all-inclusive case, and represents the sum over the wavelength range of the instrument (Lustig-Yaeger et al. 2019). To determine the minimum number of transits for detection, 60 PSG transmission spectra separated in time by 6 days are run through PandExo,in order to sample the time-varying climate of TRAPPIST-1e from orbit to orbit. Each spectrum is individually simulated and all 60 spectra are averaged to a mean yearly SNR, with a sequentially increasing number of transits until the mean yearly SNR surpasses , which we consider a strong detection (99.9% confidence), or a 50 transit limit is reached, in which case a strong detection may not be feasible.
NIRSpec PRISM’s broad wavelength range of 0.65.3 m (Jakobsen et al. 2022) contains several notable spectral features of CO2, CH4, and H2O. Each species has a distinct footprint within TRAPPIST-1e’s spectrum, as seen in Figure 2.
Note that retrieval models would provide a more precise way of constraining atmospheric properties of TRAPPIST-1e from transmission spectra (Krissansen-Totton et al. 2018a; May et al. 2021; Mikal-Evans 2021). However, here we simplify our analyses in order to study the daily time-resolved output from the suite of ten GCM simulations conducted in order to assess the impact of climate on observable properties of TRAPPIST-1e.


III Results
III.1 The 10-2 bar CO2 Case
The 10-2 bar pCO2 case has a temperate climate and we consider it as a baseline model for the atmosphere of TRAPPIST-1e. In this section, we do a deeper dive into the analysis of this case, while noting general trends between different pCO2 cases in Section III.2.
III.1.1 Detectability of Species with JWST
For the methane-inclusive case, we find that only one to two transits are needed to significantly detect CO2, while both H2O and CH4 are detectable in less than 13 transits for a noise floor of 0 or 10 ppm, although neither are detectable at noise floors of 30 ppm or higher (Table 1). These are optimistic assumptions, as we assume a hazeless atmosphere, although, in an oxygen-free atmosphere, methane is expected to build up to higher partial pressures without oxidation into CO2. However, note that we have conducted an equivalent band-by-band analysis to Fauchez et al. 2019 and found good agreement, implying that haze assumptions do not greatly impact predicted feature SNR.
| Species | Noise | 100 bar pCO2 | 10-1 bar pCO2 | 10-2 bar pCO2 | 10-3 bar pCO2 | 10-4 bar pCO2 | |||||
| Floor | CH4 | No CH4 | CH4 | No CH4 | CH4 | No CH4 | CH4 | No CH4 | CH4 | No CH4 | |
| CO2 | 0 ppm | 1 | 1 | 1 | 1 | 1 | 1 | 2 | 2 | 4 | 4 |
| 10 ppm | 1 | 1 | 1 | 1 | 1 | 1 | 2 | 2 | 4 | 4 | |
| 30 ppm | 1 | 1 | 1 | 1 | 1 | 1 | 2 | 2 | – | – | |
| 50 ppm | 1 | 1 | 1 | 1 | 2 | – | – | – | – | – | |
| H2O | 0 ppm | 3 | 4 | 7 | 7 | 9 | 9 | 14 | 11 | 14 | 12 |
| 10 ppm | 5 | 4 | 7 | 7 | 13 | 12 | – | 21 | – | 35 | |
| 30 ppm | – | – | – | – | – | – | – | – | – | – | |
| 50 ppm | – | – | – | – | – | – | – | – | – | – | |
| CH4 | 0 ppm | 28 | N/A | 11 | N/A | 9 | N/A | 9 | N/A | 9 | N/A |
| 10 ppm | – | N/A | 13 | N/A | 10 | N/A | 10 | N/A | 9 | N/A | |
| 30 ppm | – | N/A | – | N/A | – | N/A | – | N/A | – | N/A | |
| 50 ppm | – | N/A | – | N/A | – | N/A | – | N/A | – | N/A | |
| Max (K) | 337.67 | 338.67 | 302.59 | 301.64 | 295.67 | 295.69 | 293.96 | 293.61 | 292.25 | 290.10 | |
| Min (K) | 318.67 | 318.33 | 226.09 | 214.04 | 210.93 | 211.07 | 203.23 | 193.87 | 191.57 | 184.25 | |
Similarly, for the zero-methane case, we find that only one transit is needed to detect CO2, although it falls just short of the SNR threshold for a noise floor of 50 ppm, with an SNR asymptoting to . H2O is detectable in 9-12 transits for a noise floor of 10 ppm or less, but undetectable for noise floor of 30 ppm or higher.
When calculating transits needed for the SNR threshold, we include the random scatter from PandExo to model instrumental noise. However, when the additional instrumental noise is ignored and atmospheric uncertainty due to climate variability is isolated (i.e. only the photon noise from the PSG calculations is considered),
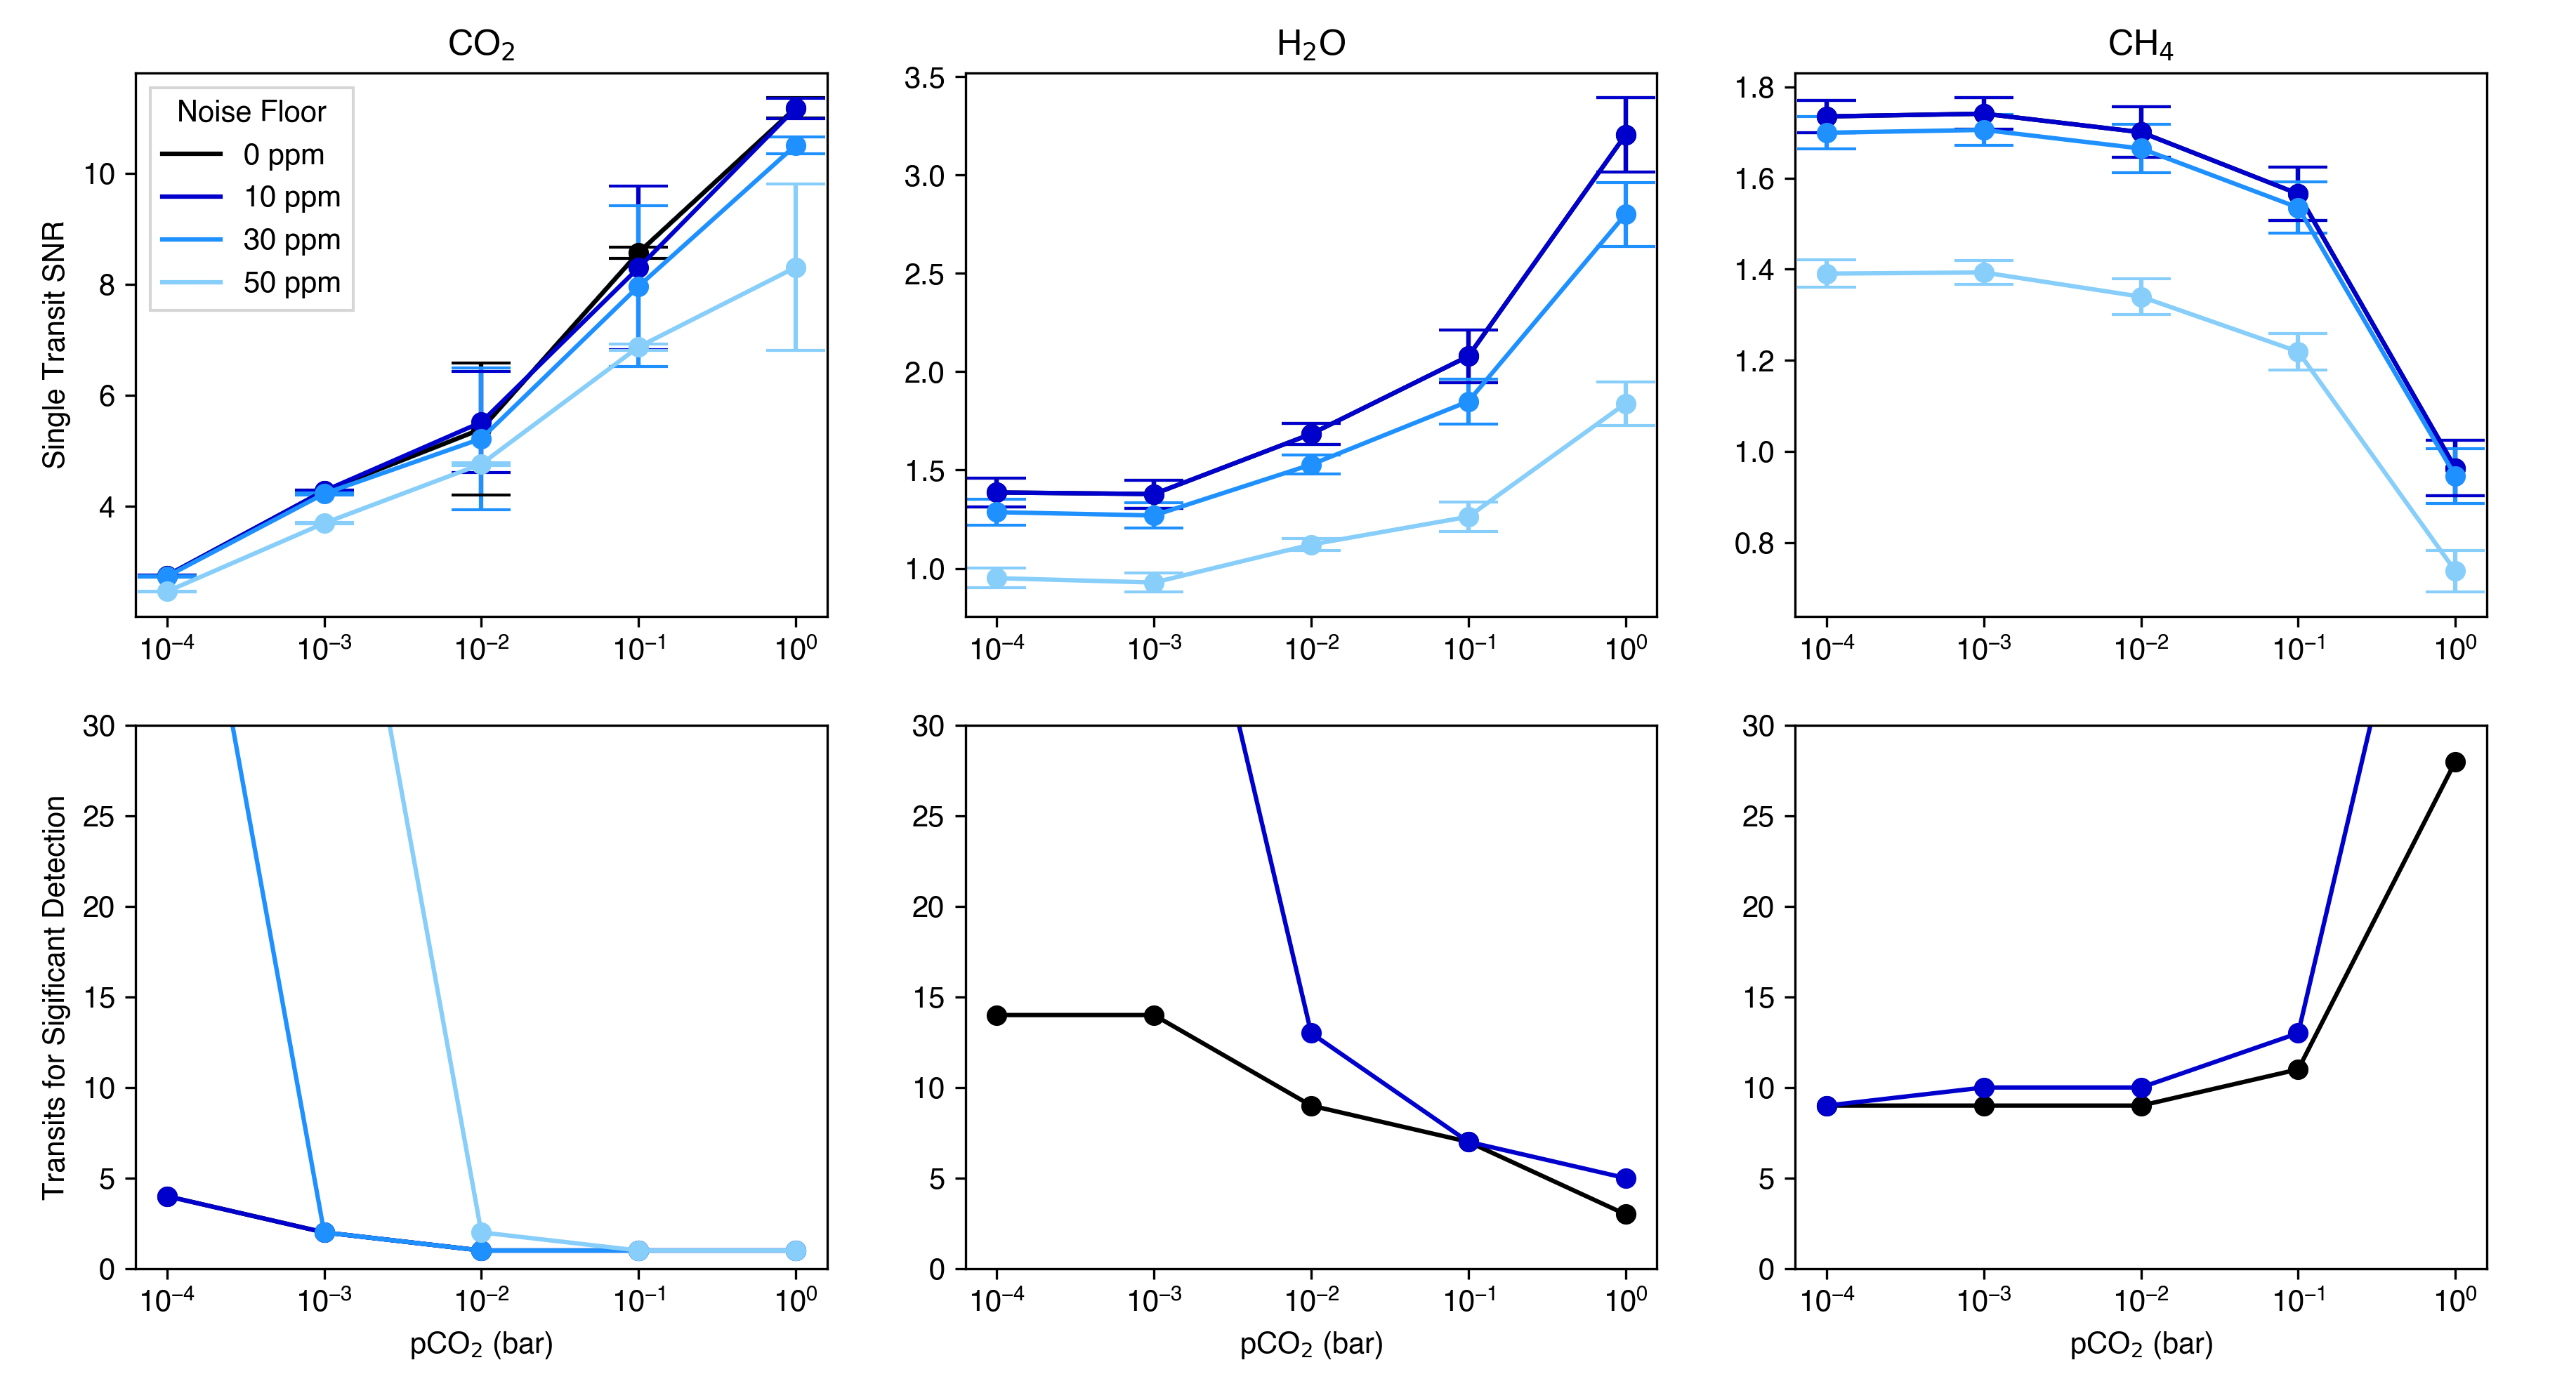
the uncertainties within single-transit SNRs for each species () can be calculated as the standard deviation of the single-transit SNR across the entire year. These uncertainties are small enough that no molecule covers a range of more than transits for detection between and , implying that temporal variability in the bar CO2 atmosphere does not affect the detectability of species with JWST transmission spectra. This agrees with May et al. 2021, which found that temporal variability was not reflected in the detectability of species within their retrieval models with simulated NIRSpec PRISM data.
III.1.2 Climatological Effects on Spectra
In ExoCAM, TRAPPIST-1e has many of the expected characteristics of a Rhines rotating tidally locked planet (Haqq-Misra et al. 2018); there is a constant cloudy hotspot near the substellar point, with an eastward equatorial superrotating jet. There is significant variability in both the
eddies and jet, as well as cloud cover, as seen in Figure 3 for the bar pCO2 case. The water clouds follow a general pole-ward and eastward migration as parcels of air cool adiabatically during convection on the dayside and form clouds that are then transported by the jet to the eastern limb.
This makes the transit spectrum of the eastern limb (270∘) much cloudier and with more muted features than the western limb (90∘). While this doesn’t present an issue for JWST observations, which
do not likely have the sensitivity to detect limb differences for terrestrial planets (Song & Yang 2021), it is worth noting that observations of the western limb alone are more likely to have strong features of CO2 and CH4.
III.2 Dependence on CO2 Partial Pressure
An increase in the pCO2 leads to an increased greenhouse effect which warms the deep atmosphere and surface, so higher pCO2 cases are hotter and cloudier (note the higher continuum level for the bar case in Figure 1). This is reflected in the number of transits needed to detect H2O and CH4 (Table 1). H2O is detectable in fewer transits as higher CO2 warms the deep atmosphere, leading to an increase in water vapor. However, CH4 is muted by the cloudier atmospheres and stronger features from CO2 and H2O, and as such requires more transits for detection in higher pCO2 cases.
While in all five cases CO2 is detectable in as little as four transits for the optimistic noise floor of 0 ppm, water and methane each vary (Figure 4). The number of transits needed for a detection of methane increases dramatically with pCO2, from a minimum of 9 transits in the bar case to 28 in the bar case. The number of transits needed for H2O tends to decrease with increasing pCO2 for the methane-inclusive case, falling from 14 transits in the case, to 3 transits in the case. In all cases, as with the bar case, there are relatively small SNR uncertainties, meaning temporal variance does not strongly affect detectability; however, the uncertainties grow with increasing pCO2 (Figure 4), so very hot planets may have stronger temporal variability that does regularly affect the transmission spectrum (also found by May et al. 2021). There is also a nightside ocean ice layer in all cases, with all models except the 1 bar pCO2 case also exhibiting an eyeball of ice-free ocean on the dayside, as in Pierrehumbert 2011.
IV Discussion
IV.1 Feasibility of Biosignature Detection with JWST’s Lifespan
As shown in Section III, both CO2 and CH4 are able to be detected significantly in TRAPPIST-1e’s atmosphere within 28 transits for our atmospheric cases with a noise floor of 10 ppm or less, which largely agrees with a similar analysis done by Lin et al. 2021. Although precisely constraining abundances would likely require further transits, TRAPPIST-1e is visible by JWST for about 100 days per year, which equates to about transits per year. As such, within the 5.5 year mission, both methane and carbon dioxide may be detected with a confidence level, depending on the atmospheric composition of TRAPPIST-1e and performance of NIRSpec/PRISM.
IV.2 Limitations and Further Work
In order to better characterize JWST’s spectroscropic capabilities, particularly in cases including methane, it is necessary to account for haze, which we neglect in this work in order to provide optimistic constraints on methane detectability. As such, further work should include a hazy case to compare to the haze-free case, as in Fauchez et al. 2019; Pidhorodetska et al. 2020. CH4 is assumed to be uniformly mixed and not haze-forming in our work, as well as not depleted from photochemistry or equilibrium chemistry, all of which would drastically change the transmission signal strength of both CH4 and other species in the atmosphere. Notably, organic haze in the upper atmosphere could limit spectral features of other species in transmission spectra, and is less likely to form in an oxygenated atmosphere, which is expected on aquaplanets orbiting M dwarfs (Tian et al. 2014; Luger & Barnes 2015). However, in an oxygen-free environment such as our model, CH4 is expected to be longer-lived and at higher concentrations, and so a low Earth-like CH4 partial pressure as used in this model can indirectly approximate the effects of haze on the detectability of CH4.
It is also worth mentioning that, due to TRAPPIST-1e’s position on the border between two different dominant rotation dynamics, there are fundamental differences between different GCM simulations in terms of atmospheric variability timescales (Fauchez et al. 2021; Turbet et al. 2021) and even basic-state climate (Sergeev et al. 2022a). These can lead to disagreements of up to 50% on the number of transits needed to reach a 5 spectral detection (Fauchez et al. 2021). Fauchez et al. 2021 also found that ExoCAM produced higher cloud decks that more strongly muted features compared to other GCMs, implying that our results may be more pessimistic than those calculated with a different GCM. The model did not account for the possibility of continents, which could affect limb transmission at certain latitudes and change the water vapor abundance and cloud deck height
(Lewis et al. 2018; Salazar et al. 2020). It also did not include any oxygen/ozone species within the atmosphere, both of which have spectroscopic features that may overlap with our recognized species in this work (Lustig-Yaeger et al. 2019).
Similarly, to truly characterize the CO2-CH4 biosignature pair as biotic, as mentioned in Section I, the existence of abundant CO must be ruled out. CO has two notable absorption bands in the NIRSpec PRISM range, at 4.67 m and 2.34 m (K. N. Liou 2002), making it, or its absence, characterizable alongside CO2 and CH4; the latter line would overlap with the 2.3 m methane band, making the 4.67 m feature imperative to carbon monoxide characterization. The lack of a retrieval framework precludes our ability to characterize abundance constraints and resulting surface fluxes, which is imperative to identification of any disequilibrium in the CO2CH4 pair when looking for biosignatures. As such, future work should apply retrieval models to the simulated transmission spectra, similarly to May et al. 2021 and Lin et al. 2021, to better constrain the abundances and identify whether the pair exists in disequilibrium.
In order to facilitate comparison with previous work (Wolf 2017; Turbet et al. 2018; Fauchez et al. 2021), we assume a fixed 1 bar of background N2. Although we do not vary the partial pressure of N2 from 1 bar in this model, we expect that an increase in N2 would result in broadening of the spectral line shapes of CO2, H2O, and CH4 due to the overall increase in atmospheric pressure, as well as more prominent collision-induced absorption (CIA) lines (and likewise, that a reduction of the N2 partial pressure would decrease both). Similarly, an increase in the total surface pressure would likely result in a hotter global average surface temperature (Charnay et al. 2013; Wolf & Toon 2014; Chemke et al. 2016). Furthermore, TRAPPIST-1e is not expected to maintain more than 1 bar of N2 if it is the only atmospheric species; it would also require some amount of CO2 to maintain that atmosphere against stellar wind (Turbet et al. 2020).
V Conclusions
In this work, we explored the ability of JWST to detect possible biomarkers in the atmosphere of TRAPPIST-1e, a terrestrial planet within its star’s habitable zone. To do so, we simulated a grid of model atmospheres of TRAPPIST-1e with the ExoCAM GCM, consisting of N2, CO2, H2O, and CH4. We then analyzed the detectability of the CO2CH4 pair by simulating transmission spectra of our models with the NASA Planetary Spectrum Generator, and calculating each species’ signal-to-noise ratio with PandExo.
We find that, with optimistic limited noise (see Section IV), CO2, H2O, and CH4 would all be detectable in TRAPPIST-1e’s atmosphere in as little as 13 transits for a bar N2, bar pCO2 atmosphere, with transits needed to detect CH4 increasing and transits needed for H2O and CO2 decreasing with increaing pCO2. Temporal variability for these atmospheres exists, but was found not to strongly affect transmission spectra or the number of transits needed for a strong detection of any molecule. Follow-up work should focus on determining the impact of limiting factors such as atmospheric haze and astronomical noise on JWST transmission spectra.
The authors would like to thank Raymond Pierrehumbert for comments that considerably improved the manuscript. The authors also thank Eliza Kempton for helpful comments on an early draft of this manuscript, as well as Arjun Savel for help with the analysis. The authors also acknowledge the University of Maryland supercomputing resources (http://hpcc.umd.edu) and the NASA/GSFC Planetary Spectrum Generator resources (https://psg.gsfc.nasa.gov/) made available for conducting the research reported in this paper. This work was completed with resources provided by the University of Chicago Research Computing Center.
References
- Agol et al. (2021) Agol, E., Dorn, C., Grimm, S. L., et al. 2021, The Planetary Science Journal, 2, 1, doi: 10.3847/PSJ/abd022
- Allard et al. (2007) Allard, F., Allard, N. F., Homeier, D., et al. 2007, Astronomy & Astrophysics, 474, L21, doi: 10.1051/0004-6361:20078362
- Batalha et al. (2014) Batalha, N., Mandell, A., Kalirai, J., & Clampin, M. 2014, Search for Life Beyond the Solar System. Exoplanets, Biosignatures & Instruments, P3.62. https://ui.adsabs.harvard.edu/abs/2014ebi..confP3.62B/abstract
- Batalha et al. (2018) Batalha, N. E., Lewis, N. K., Line, M. R., Valenti, J., & Stevenson, K. 2018, The Astrophysical Journal, 856, L34, doi: 10.3847/2041-8213/aab896
- Batalha et al. (2017) Batalha, N. E., Mandell, A., Pontoppidan, K., et al. 2017, Publications of the Astronomical Society of the Pacific, 129, 064501, doi: 10.1088/1538-3873/aa65b0
- Birkmann et al. (2022) Birkmann, S. M., Ferruit, P., Giardino, G., et al. 2022, arXiv:2202.03309 [astro-ph]. http://arxiv.org/abs/2202.03309
- Bitz et al. (2012) Bitz, C. M., Shell, K. M., Gent, P. R., et al. 2012, Journal of Climate, 25, 3053, doi: 10.1175/JCLI-D-11-00290.1
- Charnay et al. (2013) Charnay, B., Forget, F., Wordsworth, R., et al. 2013, Journal of Geophysical Research: Atmospheres, 118, 10,414, doi: 10.1002/jgrd.50808
- Chemke et al. (2016) Chemke, R., Kaspi, Y., & Halevy, I. 2016, Geophysical Research Letters, 43, 11,414, doi: 10.1002/2016GL071279
- Cohen et al. (2021) Cohen, M., Bollasina, M. A., Palmer, P. I., et al. 2021, arXiv:2111.11281 [astro-ph, physics:physics]. http://arxiv.org/abs/2111.11281
- Cohen et al. (2022) Cohen, M., Bollasina, M. A., Sergeev, D. E., Palmer, P. I., & Mayne, N. J. 2022, Traveling planetary-scale waves cause cloud variability on tidally locked aquaplanets, arXiv. http://arxiv.org/abs/2211.11887
- de Wit et al. (2018) de Wit, J., Wakeford, H. R., Lewis, N. K., et al. 2018, Nature Astronomy, 2, 214, doi: 10.1038/s41550-017-0374-z
- Doshi et al. (2022) Doshi, D., Cowan, N., & Huang, Y. 2022, arXiv e-prints:2207.00015
- Fauchez et al. (2019) Fauchez, T. J., Turbet, M., Villanueva, G. L., et al. 2019, The Astrophysical Journal, 887, 194, doi: 10.3847/1538-4357/ab5862
- Fauchez et al. (2021) Fauchez, T. J., Villanueva, G. L., Sergeev, D. E., et al. 2021, arXiv:2109.11460 [astro-ph, physics:physics]. http://arxiv.org/abs/2109.11460
- Gillon et al. (2016) Gillon, M., Jehin, E., Lederer, S. M., et al. 2016, Nature, 533, 221, doi: 10.1038/nature17448
- Gillon et al. (2017) Gillon, M., Triaud, A. H. M. J., Demory, B.-O., et al. 2017, Nature, 542, 456, doi: 10.1038/nature21360
- Greene et al. (2016) Greene, T. P., Line, M. R., Montero, C., et al. 2016, The Astrophysical Journal, 817, 17, doi: 10.3847/0004-637X/817/1/17
- Grimm & Heng (2015) Grimm, S. L., & Heng, K. 2015, The Astrophysical Journal, 808, 182, doi: 10.1088/0004-637X/808/2/182
- Grimm et al. (2021) Grimm, S. L., Malik, M., Kitzmann, D., et al. 2021, The Astrophysical Journal Supplement Series, 253, 30, doi: 10.3847/1538-4365/abd773
- Haqq-Misra et al. (2018) Haqq-Misra, J., Wolf, E. T., Joshi, M., Zhang, X., & Kopparapu, R. K. 2018, The Astrophysical Journal, 852, 67, doi: 10.3847/1538-4357/aa9f1f
- Jakobsen et al. (2022) Jakobsen, P., Ferruit, P., de Oliveira, C. A., et al. 2022, arXiv:2202.03305 [astro-ph]. http://arxiv.org/abs/2202.03305
- Joshi et al. (1997) Joshi, M., Haberle, R., & Reynolds, R. 1997, Icarus, 129, 450
- K. N. Liou (2002) K. N. Liou. 2002, International Geophysics Series, Vol. 2nd ed, An Introduction to Atmospheric Radiation (Amsterdam: Academic Press)
- Kane (2018) Kane, S. R. 2018, The Astrophysical Journal, 861, L21, doi: 10.3847/2041-8213/aad094
- Kasting et al. (1993) Kasting, J. F., Whitmire, D. P., & Reynolds, R. T. 1993, Icarus, 101, 108, doi: 10.1006/icar.1993.1010
- Kleinböhl et al. (2018) Kleinböhl, A., Willacy, K., Friedson, A. J., Chen, P., & Swain, M. R. 2018, The Astrophysical Journal, 862, 92, doi: 10.3847/1538-4357/aaca36
- Koll & Abbot (2016) Koll, D. D. B., & Abbot, D. S. 2016, The Astrophysical Journal, 825, 99, doi: 10.3847/0004-637X/825/2/99
- Komacek et al. (2020) Komacek, T. D., Fauchez, T. J., Wolf, E. T., & Abbot, D. S. 2020, The Astrophysical Journal, 888, L20, doi: 10.3847/2041-8213/ab6200
- Kopparapu et al. (2013) Kopparapu, R. k., Ramirez, R., Kasting, J. F., et al. 2013, doi: 10.1088/0004-637X/765/2/131
- Krissansen-Totton et al. (2018a) Krissansen-Totton, J., Garland, R., Irwin, P., & Catling, D. 2018a, The Astronomical Journal, 156, 114, doi: 10.3847/1538-3881/aad564
- Krissansen-Totton et al. (2018b) Krissansen-Totton, J., Olson, S., & Catling, D. C. 2018b, Science Advances, doi: 10.1126/sciadv.aao5747
- Krissansen-Totton et al. (2022) Krissansen-Totton, J., Thompson, M., Galloway, M. L., & Fortney, J. J. 2022, Nature Astronomy, 6, 189, doi: 10.1038/s41550-021-01579-7
- Lewis et al. (2018) Lewis, N., Lambert, F., Boutle, I., et al. 2018, The Astrophysical Journal, 854, 171
- Liebert & Gizis (2006) Liebert, J., & Gizis, J. E. 2006, Publications of the Astronomical Society of the Pacific, 118, 659, doi: 10.1086/503333
- Lin & Kaltenegger (2022) Lin, Z., & Kaltenegger, L. 2022, High-Resolution spectral models of TRAPPIST-1e seen as a Pale Blue Dot for ELT and JWST observations, doi: 10.1093/mnras/stac2536
- Lin et al. (2021) Lin, Z., MacDonald, R. J., Kaltenegger, L., & Wilson, D. J. 2021, Monthly Notices of the Royal Astronomical Society, 505, 3562, doi: 10.1093/mnras/stab1486
- Lincowski et al. (2018) Lincowski, A. P., Meadows, V. S., Crisp, D., et al. 2018, The Astrophysical Journal, 867, 76, doi: 10.3847/1538-4357/aae36a
- Luger & Barnes (2015) Luger, R., & Barnes, R. 2015, Astrobiology, 15, 119, doi: 10.1089/ast.2014.1231
- Lustig-Yaeger et al. (2019) Lustig-Yaeger, J., Meadows, V. S., & Lincowski, A. P. 2019, The Astronomical Journal, 158, 27, doi: 10.3847/1538-3881/ab21e0
- Malik et al. (2017) Malik, M., Grosheintz, L., Mendonça, J. M., et al. 2017, The Astronomical Journal, 153, 56, doi: 10.3847/1538-3881/153/2/56
- May et al. (2021) May, E. M., Taylor, J., Komacek, T. D., Line, M. R., & Parmentier, V. 2021, The Astrophysical Journal Letters, 911, L30, doi: 10.3847/2041-8213/abeeff
- Meadows et al. (2018) Meadows, V. S., Reinhard, C. T., Arney, G. N., et al. 2018, Astrobiology, 18, 630, doi: 10.1089/ast.2017.1727
- Merlis & Schneider (2010) Merlis, T. M., & Schneider, T. 2010, Journal of Advances in Modeling Earth Systems, 2, 13, doi: 10.3894/JAMES.2010.2.13
- Mikal-Evans (2021) Mikal-Evans, T. 2021, Monthly Notices of the Royal Astronomical Society, 510, 980, doi: 10.1093/mnras/stab3383
- Morley et al. (2017) Morley, C. V., Kreidberg, L., Rustamkulov, Z., Robinson, T., & Fortney, J. J. 2017, The Astrophysical Journal, 850, 121, doi: 10.3847/1538-4357/aa927b
- Noda et al. (2017) Noda, S., Ishiwatari, M., Nakajima, K., et al. 2017, Icarus, 282, 1
- Pidhorodetska et al. (2020) Pidhorodetska, D., Fauchez, T., Villanueva, G., Domagal-Goldman, S., & Kopparapu, R. 2020, The Astrophysical Journal Letters, 898, L33
- Pierrehumbert (2011) Pierrehumbert, R. T. 2011, The Astrophysical Journal, 726, L8, doi: 10.1088/2041-8205/726/1/L8
- Pierrehumbert & Hammond (2019) Pierrehumbert, R. T., & Hammond, M. 2019, Annual Review of Fluid Mechanics, 51, 275, doi: 10.1146/annurev-fluid-010518-040516
- Rigby et al. (2022) Rigby, J., Perrin, M., McElwain, M., et al. 2022, Characterization of JWST science performance from commissioning, arXiv, doi: 10.48550/arXiv.2207.05632
- Rothman et al. (2005) Rothman, L. S., Jacquemart, D., Barbe, A., et al. 2005, Journal of Quantitative Spectroscopy and Radiative Transfer, 96, 139, doi: 10.1016/j.jqsrt.2004.10.008
- Salazar et al. (2020) Salazar, A., Olson, S., Komacek, T., Stephens, H., & Abbot, D. 2020, The Astrophysical Journal Letters, 896, L16
- Sergeev et al. (2022a) Sergeev, D. E., Lewis, N. T., Lambert, F. H., et al. 2022a, Bistability of the atmospheric circulation on TRAPPIST-1e, arXiv. http://arxiv.org/abs/2207.12342
- Sergeev et al. (2022b) Sergeev, D. E., Fauchez, T. J., Turbet, M., et al. 2022b, The Planetary Science Journal, 3, 212, doi: 10.3847/PSJ/ac6cf2
- Shields (2019) Shields, A. L. 2019, The Astrophysical Journal Supplement Series, 243, 30, doi: 10.3847/1538-4365/ab2fe7
- Showman et al. (2013) Showman, A. P., Wordsworth, R. D., Merlis, T. M., & Kaspi, Y. 2013, in Comparative Climatology of Terrestrial Planets (University of Arizona Press), 592
- Song & Yang (2021) Song, X., & Yang, J. 2021, arXiv:2107.14603 [astro-ph]. http://arxiv.org/abs/2107.14603
- Suissa et al. (2020) Suissa, G., Mandell, A. M., Wolf, E. T., et al. 2020, The Astrophysical Journal, 891, 58, doi: 10.3847/1538-4357/ab72f9
- Tian et al. (2014) Tian, F., France, K., Linsky, J. L., Mauas, P. J. D., & Vieytes, M. C. 2014, Earth and Planetary Science Letters, 385, 22, doi: 10.1016/j.epsl.2013.10.024
- Turbet et al. (2020) Turbet, M., Bolmont, E., Bourrier, V., et al. 2020, Space Science Reviews, 216, 100, doi: 10.1007/s11214-020-00719-1
- Turbet et al. (2018) Turbet, M., Bolmont, E., Leconte, J., et al. 2018, Astronomy & Astrophysics, 612, A86, doi: 10.1051/0004-6361/201731620
- Turbet et al. (2021) Turbet, M., Fauchez, T. J., Sergeev, D. E., et al. 2021, arXiv:2109.11457 [astro-ph, physics:physics]. http://arxiv.org/abs/2109.11457
- Villanueva et al. (2022) Villanueva, G. L., Liuzzi, G., Faggi, S., et al. 2022, Fundamentals of the Planetary Spectrum Generator. https://ui.adsabs.harvard.edu/abs/2022fpsg.book.....V
- Villanueva et al. (2018) Villanueva, G. L., Smith, M. D., Protopapa, S., Faggi, S., & Mandell, A. M. 2018, Journal of Quantitative Spectroscopy and Radiative Transfer, 217, 86, doi: 10.1016/j.jqsrt.2018.05.023
- Wolf et al. (2022) Wolf, E., Kopparapu, R., Haqq-Misra, J., & Fauchez, T. J. 2022, arXiv:2201.09797 [astro-ph]. http://arxiv.org/abs/2201.09797
- Wolf (2017) Wolf, E. T. 2017, The Astrophysical Journal, 839, L1, doi: 10.3847/2041-8213/aa693a
- Wolf & Toon (2014) Wolf, E. T., & Toon, O. B. 2014, Astrobiology, 14, 241, doi: 10.1089/ast.2013.1112
- Wordsworth & Pierrehumbert (2014) Wordsworth, R., & Pierrehumbert, R. 2014, The Astrophysical Journal, 785, L20, doi: 10.1088/2041-8205/785/2/L20
- Yang et al. (2013) Yang, J., Cowan, N. B., & Abbot, D. S. 2013, The Astrophysical Journal, 771, L45, doi: 10.1088/2041-8205/771/2/L45
- Yang et al. (2020) Yang, J., Ji, W., & Zeng, Y. 2020, Nature Astronomy, 4, 58, doi: 10.1038/s41550-019-0883-z
- Yue & Yang (2020) Yue, W., & Yang, J. 2020, The Astrophysical Journal Letters, 898, L19, doi: 10.3847/2041-8213/aba264