On the Optimization of Benefit to Cost Ratios for
Public Sector Decision Making
Abstract
Decision making in the public sector centers on delivering resources and services for the common good, emphasizing an expansive set of objectives such as equity and efficiency that accompany short term returns to reflect the broader cares of society and public beneficiaries. These contexts often feature multiple stakeholders and objectives operating in highly complex, real-world environments, where significant changes to practical operations must be balanced against the degree of deployment and change management. Cost-benefit analysis (CBA) is a prevailing decision-making paradigm in the public sector used to evaluate next best steps beyond the status quo (“do nothing”) alternative. The benefit to cost ratio (BCR) is a common tool used in CBA to assess the potential of actions beyond maintaining the status quo, yet necessitates the ex ante identification and selection of a limited number of alternatives, which can be laborious and may lead to missed opportunities in the wider solution landscape. We introduce a new framework for public sector decision making that simultaneously considers a potentially wide range of alternatives, and identifies one that maximizes the BCR. Our framework implicitly generates and evaluates a large number of alternatives (actions), subject to original problem context conditions and augmented with action constraints that ensure movement beyond the status quo. We represent this problem as a mixed-integer linear fractional program (MILFP) and employ a version of Newton’s Method that converts the MILFP to a sequence of linearized mixed-integer programs, which retains tractability for fairly large problem instances. Our framework is applicable to a broad set of decision contexts that involve maximizing the BCR for marginal activity beyond the status quo. We demonstrate the applicability of our framework on a compelling case study for the New York City (NYC) runaway and homeless youth (RHY) shelter syste – an area of high societal need. Our optimization-based algorithmic framework yields data-informed recommendations for supporting NYC shelter and service expansion decisions, and generalizes to reveal managerial insights for optimizing the BCR. More broadly, our framework allows for iteration and comparison across multiple potential constraints ensuring action away from the status quo, thereby empowering effective assessment of marginal activity.
Keywords— public sector decision making; benefit to cost ratio; algorithmic framework; fractional programming; runaway and homeless youth
1 Introduction
Investments in public sector activities are influenced by benefits and costs in ways that differ from strictly commercial benefit less cost profit maximization, instead valuing benefit to cost ratios (Zerbe and Scott 2012, Whittington and Grubb 1984). Standard accounting techniques for obtaining public sector costs exist, and yet accurate estimations of benefits can often be nuanced (Gass 1994). Benefits can accrue to a variety of stakeholders in ways that may be less obvious than fixed and operational costing estimates. Decision-theoretic results support the superiority of benefit to cost ratios (BCRs) in evaluating gains and losses to make informed decisions where there is aversion to risk, so familiar in the public sector (de Langhe and Puntoni 2015). Indeed, in settings with significant resource scarcity for investing in critical societal needs, simply minimizing costs, or maximizing the difference between benefits and costs while consuming no more than a budget, may be shortsighted.
Organizations that function in complex and dynamic contexts are often sensitive to instability in their operations. These contexts are influenced by a variety of factors that include pressing demands, multiple stakeholder interests, and regulatory expectations. Public sector decisions, in particular, have far-reaching consequences that impact the lives of citizens and communities, and the effects of abstractly modeling and optimizing decisions in these contexts must be balanced with the pragmatic. If an optimal solution is identified, it may be impractical to deploy due to the associated change management. In such contexts, a road map that charts out the next best steps is needed for organizational decision-making.
One public sector context featuring heightened resource limitations is the provision of critical support services for vulnerable individuals. In particular, the homeless, including runaway and homeless youth (RHY), are served by a variety of public sector organizations that provide programming, shelters and housing. These organizations offer a safe place to stay and myriad services including education, health care, employment and vocational training to help RHY become self-sufficient and find permanent housing. Effective prevention and rehabilitative services have been shown to reduce vulnerability and recidivism for unstably housed youth (Murphy 2017, Clawson et al. 2006, Dank et al. 2015). Across the United States the collective demand for RHY seeking shelter services greatly exceeds the supply of existing shelter beds (Ide and Mather 2019). Runaway and homeless youth with unaddressed needs are at high risk of exploitation, including human trafficking (HT) (Williams 2009, Middleton et al. 2018).
We propose a new framework for evaluating possibly a vast array of decision alternatives beyond maintaining the status quo in the public sector domain. Our framework identifies a (societal) benefit to (public sector investment) cost ratio maximizing next best course of action, naturally seeking alternatives that yield the largest benefit per marginal activity from the status quo. To the best of our knowledge, we are the first to put forth a decision-making framework applicable to a broad set of contexts where many alternatives from the status quo must be evaluated on the basis of maximizing the BCR, and specifically for public sector decision making. As a case study we investigate resource allocation decisions for vulnerable RHY that are at high risk of HT. In particular, we allow for new action through New York City (NYC) shelter capacity expansion decisions in a ratio-maximizing manner, so as to effectively deploy shelter resources in addressing actual youth needs. Our algorithmic framework allows researchers and decision makers to symbiotically develop data-driven models and results that are grounded in reality.
By considering marginal activity from the status quo, our approach meaningfully extends the earlier work of Kaya et al. 2022a that finds the cost-minimizing allocation of shelter resources satisfying all expected RHY demand so as to reveal the needs of RHY in NYC. In particular, we allow for actions involving decisions on new shelters from a variety of types that fit the RHY profile needs informed by the data-driven capacity needed from Kaya et al. 2022a. We estimate benefits accrued for RHY through successful shelter placement versus the costs of expanding resources in existing shelters, building new shelters, and assigning youth to those shelters. By requiring activity beyond the status quo through action constraints, the framework evaluates the best marginal deployments of new shelter capacity including new shelters and expansion of existing shelters, accompanied by supporting services, to be rolled out in NYC. Our work addresses a problem with high societal need and contributes to informing equity, access, and social welfare of RHY in NYC. We highlight a number of important observations from our experimental findings that illustrate the advantages of our algorithmic framework to advance benefit to cost ratio optimization.
The remainder of this paper is organized as follows. Section 2 provides relevant background, while Section 3 introduces our new algorithmic framework. Section 4 introduces our case study of expanding runaway and homeless youth shelter system capacity in NYC, and covers the developed mathematical models, algorithms, and metrics. Section 5 discusses our computational experiments and our findings on a variety of experiments concerning optimizing the benefits to costs ratio in the specific context of public sector capacity expansion. Section 6 provides concluding thoughts.
2 Background
In this section we discuss relevant background for our study, including current practices for public sector decision making and related applications of fractional programming.
2.1 Decision Making in the Public Sector
The public sector centers on delivering resources and services for the common good. This contrasts with the private sector that focuses on returning value for shareholders. The public sector also differs from the nonprofit sector that aims to address social, environmental, cultural, and educational needs of communities that are underserved by society. It also is distinct from fourth sector movements such as social enterprises, that play a hybrid role of addressing societal needs while pursuing financial returns. Within the public sector jurisdiction lie urban services and transportation; the natural environment, natural resources and land conservation; public utilities; national defense; education; as well as crime and justice. Unlike the private sector with its primary focus on financial impacts for its shareholders, decisions made in the public sector often impact those beyond actual decision makers. While financials are one important criterion in the public sector, they are joined by a broader set of objectives and goals that characterize society and the beneficiaries of public services – equity and efficiency (Gass 1994).
Public sector decision making (PSDM) typically involves multiple stakeholders with conflicting objectives. Some stakeholders have objectives which are often less obvious and quantifiable than their financial counterparts, yet are critical in evaluating the merit of a proposed intervention. Informed decisions, particuarly in PSDM, necessitate understanding and aligning disparate views and values to arrive at tractable problem representations. Community-based operations research (Johnson and Smilowitz 2007, Johnson 2012), soft operations research (Mingers 2011), and problem structuring methods (Ackermann 2012, Smith and Shaw 2019) promote process-oriented means to capture the values and perceptions of multiple stakeholders regarding their goals and alternatives identification, facilitating improved model development, and ultimately implementation. Similarly, multiple-criteria decision making (Greco et al. 2016) enables decision makers to evaluate alternatives with respect to diverse objectives. The knowledge of performance in multiple public sector dimensions can lead to more informed decisions.
A predominant decision-making framework in PSDM is cost-benefit analysis (CBA), and similarly, cost-effectiveness analysis (CEA) in the military, environmental and health economics contexts for evaluating a public good intervention beyond the status quo (Boardman et al. 2017). In CBA, the benefit to cost (also cost-benefit) ratio (BCR) measures the present value of benefits the public accrues to that of governmental cost outlay. The BCR is an indicator that evaluates whether the likely benefits to expenditures generated are superior to the next best alternative or status quo. In complex decision contexts such as are often found in the public sector, incremental improvements may be favored over drastic changes that represent a significant departure from the status quo. In the mid-twentieth century, BCRs began being used in the contexts of water allocation and land management in the United States and now are widely used in governmental agencies worldwide to evaluate resource allocation decisions (Fuguitt and Wilcox 1999).
The BCR is related to the notion of marginal utility, which captures the change in benefit of an additional unit of a resource. The concept of marginal utility emerged during the marginal revolution in nineteenth century economics. While costs are typically straightforward to assess, determining benefits can be more nuanced. Willingness to pay provides one avenue to estimate public benefits, which are often intangible and distributed across many stakeholders. Willingness to pay centers on the concept of the amount someone would pay to have (or alternatively, accept) a particular intervention, and can be used to approximate the cumulative benefits of an intervention (Hanemann 1991). More generally, When the ratio of benefits to costs exceeds unity, benefits justify the financial outlay. Underlying this rationale is Kaldor–Hicks efficiency, which states that the benefits to the public are sufficient to (hypothetically) compensate for the costs to society (Boardman et al. 2017).
A CBA typically compares a modest number of interventions, or alternatives, against the incumbent status quo to arrive at the most attractive alternative. This analysis is carried out in an incremental fashion: the alternatives are placed in non-decreasing order of cost, and the incremental benefits and costs between the incumbent and the next-most expensive are weighed using a BCR. If the benefits of the increment outweigh the costs, the incumbent is replaced with the more attractive alternative; otherwise, the incumbent remains. The analysis proceeds in this fashion until all alternatives are exhausted. In contrast to evaluating a small, finite number of user-defined alternatives, we propose a new algorithmic framework that implicitly represents evaluating combinatorially many alternatives to identify one that maximizes the BCR ratio.
2.2 Fractional Programming
Fractional programming is an area of mathematical optimization concerned with optimizing a fractional, or ratio, objective function over a constrained system (Schaible 1976a). These optimization problems are of the form:
| (1) |
where ; and .
When are affine and is polyhedral, expression (1) takes the form of a linear fractional program:
| (2) |
where ; ; ; and . Fractional programming has a rich and diverse history dating back to Von Neumann 1937 who first considered optimizing a fractional objective to find economic equilibrium, considering a ratio between economic activity and the costs of such activity. Stancu-Minasian 2019 provides a recent survey of a variety of fractional programming applications.
While the solution to fractional programs with certain forms can be facilitated through transformation (Charnes and Cooper 1962), the algorithm of Dinkelbach 1967 can optimize a fractional objective function over a connected and compact domain while making far fewer assumptions on the structure of the objective function. Ibaraki 1983 showed the equivalence of Dinkelbach’s algorithm to Newton’s method for this class of optimization problem, and as Crouzeix and Ferland 1991a referred to Dinkelbach’s algorithm as a Newton method, we will also follow this convention. Newton’s method (Dinkelbach 1967) can solve a fractional program of the form of (1) by iteratively solving a sequence of related, linearized subproblems over the same domain. Schaible 1976b showed that Newton’s method has superlinear convergence, which takes on increasing importance when the iteration through the subproblems are computationally complex. Recent technological and algorithmic developments have driven many advances in computational optimization, empowering increasingly larger optimization problems to be solved to global optimality (Bertsimas et al. 2016) facilitating the solution of large-scale fractional programs.
While the BCR is paramount to public sector decision making, to date there are very few studies that advocate for the optimization of BCRs. Those studies which do exist cover secondary side applications in either the fractional programming methodology literature (Bradley and Frey 1974), or single applications that could only marginally be viewed as public sector (Zappone and Jorswieck 2015, Murdoch et al. 2007, see, e.g.). One recent exception is the work of Park and Berenguer 2020, that considers optimizing a BCR to locate warehouses for food aid distribution by the World Food Program in Angola. Similar to our approach, the authors account for demand heterogeneity in a not-for-profit, supply constrained context. Our study differs by introducing a general framework for optimizing BCR decisions that allows for a status quo scenario representing the current operational state, and maximizes the BCR across many alternatives to assess marginal activity beyond the status quo. Our case study weighs marginal resource allocation decisions concerning existing public sector operations, namely marginal allocations of additional NYC shelter and service capacity. We are also among the first to generally investigate the maximization of a BCR over a mixed-integer polyhedral set for public sector decision making, and the first to propose a general framework, which we now present.
3 A New Framework for Optimizing Benefit to Cost Ratios
We introduce a new framework that optimizes the benefit to cost ratio (BCR) for public sector decision making. Our framework rests upon the foundation of a complex and real-world decision context such as those found in the public sector. We assume the mathematical representation of the problem encodes an existing state, the status quo, together with decision variables that allow for improving movement away from the status quo. While many decision-optimization contexts may yield prescriptions that represent significant departures from the status quo (or are entirely independent of it), practical considerations such as deployment and change management can complicate such prescriptions. Due to high costs associated with substantial short-term operational modifications, decision making in this context may benefit from relative operational stability, both to mitigate risks and improve future flexibility.
Traditional CBA assumes preidentified alternatives through some generative process. Our framework, in constrast, assumes no preidentification, only constraints and (possibly) variables that express tangible action, or movement beyond the status quo. Action constraints serve to ensure some condition such as a minimum expectation or logical condition be satisfied, and essentially induce alternatives in an implicit manner. Action constraints may induce a vast array of alternatives, which our framework evaluates according to their associated benefits and costs, on a ratio-maximizing basis. Our framework frees decision-makers from the labor of preidentifying alternatives, while still considering a wide range of feasible options, thereby identifying solutions beyond the status quo that are most cost-effective and socially desirable. As decision makers dictate the level of required action, our framework is uniquely positioned to illuminate solutions that maintain relative operational stability, while generating a road map that charts optimal movement beyond the status quo to adjacent BCR-optimizing states.
We assume a decision-optimization problem representing the system or process being optimized, composed of problem data and constrained decision variables in a nonempty and bounded feasible region formed by existing constraints. Any feasible state of the system can be represented by an assignment of the decision variables , and it is assumed there is opportunity for improvement through optimization. Our algorithmic framework is presented in Procedure 1.
- 1.
Initialize decision problem : data , decision variables , feasible region .
- 2.
Define marginal cost function by considering all relevant costs.
- 3.
Define marginal benefit function that captures all benefits accrued to the public stakeholders.
- 4.
Form , the marginal BCR objective function to be maximized.
- 5.
Augment with action constraints (and possibly variables, ) that ensure sufficient movement away from status quo under ratio objective: (.
- 6.
Optimize the BCR over to identify maximizer via appropriate algorithm.
The algorithmic framework provided in Procedure 1 identifies optimal marginal activity from the status quo. Data encodes the structure of the decision making context including the status quo. The marginal costs and benefits of the system are expressed through and , respectively. The function captures marginal system costs, which can often be estimated through standard cost accounting procedures as they have concrete monetary values (Gass 1994). The benefits function measures the total marginal effect of decisions, or actions, upon public sector system stakeholders, and is typically more challenging to quantify.
Optimizing the ratio first necessitates movement away from the status quo, as the denominator gravitates toward attaining zero marginal cost, that is, the do nothing option. This movement is assured through a set of one or more action constraints and a (possibly empty) set of one or more action variables that augment the original system constraints and variables to ensure sufficient movement away from the status quo. Optimization over a large number of decisions represented by action constraints and variables can reveal optimal marginal activity. In contrast, more conventional techniques, such as optimizing the difference between benefits less costs, are unable to reveal marginal decisions, leading to a lack of insight when deciding next steps when moving from the status quo. Şeref et al. 2009 also constrain movement from the status quo in the related study of incremental optimization, while optimizing linear objectives of interest. Multiple algorithms that optimize a fractional objective function over a polyhedral set exist each with unique properties including rate of convergence and permitted functional forms (Crouzeix and Ferland 1991b). For the case study investigated in Section 4, we use Newton’s method that is outlined in Section 4.4.
3.1 Ratios as Generalized Differences
Consider generalized profit as expressed by the difference between benefits and costs for weights :
| (3) |
When , expression (3) reduces to , which shares the same set of optimal solutions as . While likely impractical, it is a point of reference for maximized benefit without regarding cost. In the absence of constraints to the contrary, maximizing this objective may incur significant cost and, in general, feature inefficient resource utilization.
Alternatively, setting in (3) yields , which shares the same set of optimal solutions as . Not regarding benefit, this approach represents a cost-minimal approach, taking no more action than necessary, while producing more efficient resource utilization. This style of objective function may be seen when revenues are fixed within a system, such as an organization completing work for a fixed level of income through a grant, contract, or appropriation.
Generalizing further, allowing reduces expression (3) to , or standard profit maximization that assumes the benefits and costs are on equal footing, that is, having the same units. As benefits and costs are equally weighted, every action constraint and action variable now has an equal weight when considering the benefit that it brings to the optimization model. Because of this, optimization with this objective function will not reveal marginal decisions that provide the greatest improvement from the status quo. While this may be so in the private sector, it is common in the public sector for costs to be expressed in monetary units while challenging-to-express benefits exist in widely differing units, thus making highly unlikely.
For any other values of , dividing through expression (3) by gives a new coefficient on the cost without changing the resulting set of optimal solutions from maximizing over . Strict profit maximization, that is, maximizing the benefit to cost difference, can be seen when . Alternatively, maximizing the benefit to cost ratio over is tantamount to finding the for which , as then , and any optimizer for one also optimizes the other (Dinkelbach 1967).
While the choice of objective function is ultimately that of the decision maker, advantages to ratio optimization include that (1) it bypasses the somewhat arbitrary assumption equating unit of benefit to unit of cost; (2) the resulting BCR, when and share the same unit, is unitless; and (3) it tends to prescribe highly beneficial actions that are otherwise too removed from the cost-minimizing form . The action constraints are now properly utilized, as each decision comes with a unique evaluation of the benefits, allowing optimization to activate decisions that reveal optimal marginal activity.
3.2 Contrasting Benefit Less Cost, and Benefit to Cost Ratio Optimization
The algorithmic framework ensures marginal activity away from the status quo by augmenting the system of original variables and constraints with a set of action constraints and a (possibly empty) set of action variables . This marginal activity incurs associated benefits and costs, and as such, it is instructive to consider in isolation the components of benefits and costs associated with the marginal activity, noting that not all components need to assume a positive value.
The marginal costs may take the form of:
the marginal benefits:
yielding a marginal benefit less cost function:
| (4) |
For any that attains a maximum of (4) over and features , optimization suggests activating combinations of variables that are collectively profitable, irrespective of the degree of profitability or corresponding cost. In extremely resource-constrained settings, this may be ineffective as it is silent on the sets of decisions which most effectively deploy available resources.
Alternatively, the marginal BCR takes the form:
Any optimizer of the marginal BCR is unlikely to exhibit the same behavior as an optimizer of (4) due to the nonlinear relationship between the numerator and denominator. There is instead more selectivity among activated variable combinations that improves the rational relationship between the marginal benefits and costs. This is demonstrated experimentally in Section 5.
4 A Case Study in Benefit to Cost Ratio Optimization: RHY Shelter Capacity Expansion
To demonstrate our algorithmic framework, we consider the problem of deploying marginal RHY shelter capacity in NYC. We focus on transitional and independent living (TIL) shelters and programs as they provide housing and support services while youth work toward establishing independence. TIL programs aim to help youth develop in areas such as education, housing, employment, recreation, health, and safety, all of which promote self-sufficiency and independence (Naccarato and DeLorenzo 2008).
4.1 Operations Research and Analytics in Human Services
Operations research and analytical methods have seen rigorous use over the years to support decision-making in the public sector as well as nonprofit organizations, bringing substantial value and recognition (Sinuany-Stern and Sherman 2014). Myriad application areas include economic and operational problems related to public health, humanitarian and disaster aid, and public education (Besiou and Van Wassenhove 2020, Rais and Viana 2011, Gass 1994).
Applications of operations research to improve public healthcare access and operations have focused on areas as diverse as emergency department resource management and planning, triage decisions, operating room scheduling and staffing, infectious disease management, and organ transplant management (Keskinocak and Savva 2020, Li et al. 2018). In disaster relief, Ergun et al. 2010 and Duran et al. 2013 show how operations research, specifically supply chain management techniques, can be used to improve disaster response supply chain management. Ahani et al. 2021 integrate machine learning and integer optimization into a software system that recommends the placements of refugees to communities throughout the United States in a manner that maximizes the total likelihood of employment. Smilowitz and Keppler 2020 present a thorough review of various operations research studies that focus on improving public education systems, including school access, redistricting school boundaries, locating new schools, and improving access to education through transportation. While differing in foci, these studies all share aspects of what make public sector problems complex: (i) objectives of multiple stakeholders and decision makers, (ii) scarce resources, and (iii) high uncertainty regarding legal, political, economic, technological, and social events.
Efficiency and productivity gains in public sector operations research are of interest to many communities (Fox 2002). Johnson and Smilowitz 2012 advocate for a community-based operations research perspective that includes the interests of underrepresented, underserved, and vulnerable populations when designing solutions to improve economic efficiency, social equity, and administrative burdens. Limited research has been conducted at the intersection of community-based operations research and scarce short-to-long-term housing resources to address homelessness (Azizi et al. 2018, Rahmattalabi et al. 2022, Chan et al. 2018, Kaya et al. 2022a). Of course, housing instability extends beyond the homeless – foster care systems face growing caseloads and high turnover in staff and foster families (Radey and Wilke 2022), and refugee and asylum systems strain to meet rising needs of immigrants, frequently partnering with pro bono and community support to augment insufficient governmental support (Cochran 2022). Individuals and families encountering housing instability often experience long waits for public housing in the U.S. (Gibbs et al. 2014). When housing, and associated programmatic service needs remain under- or unaddressed, vulnerable individuals experience diminished welfare and are at increased risk of exploitation (United States Department of State 2022). Such suffering of the most vulnerable calls for efficient deployment of public sector investments.
Our case study to deploy marginal capacity to RHY shelters in NYC also features (i) multiple objectives, (ii) extremely limited resources, and (iii) uncertainty. Nearly 6,000 youth annually are estimated to be on the street in NYC, yet shelter capacity specifically targeting the needs of these youth sits at just over 1,000 beds (Morton et al. 2019). We address this resource scarcity and uncertainty by estimating the benefits and costs of capacity expansion alternatives leveraging primary and secondary data collected across multiple publicly available sources. In Dimas et al. 2022, the authors point out the dearth of optimization studies to address the issue of increased vulnerability to HT due to lack of access to timely support, highlighting opportunities for the operations research community. Our case study aims to decrease the number of potential HT victims by improving access to public short-to-long-term housing resources for vulnerable populations.
4.2 Mathematical Modeling to Reduce Vulnerability of RHY to Trafficking
Runaway and homeless youth are at a particularly high risk of trafficking due to lack of access to basic necessities such as shelter, nutritious and affordable food, appropriate clothing, and healthcare (Wright et al. 2021). Traffickers prey upon these vulnerabilities to ensnare RHY and make it difficult to leave the exploitative situation (Middleton et al. 2018). One study on child sexual exploitation found that most victims in the study sample experienced homelessness or persistent housing instability (Curtis et al. 2008). Another study found that sex traffickers often spend time in areas known to be regular gathering spots for RHY and try to recruit young people by misrepresenting shelter availability and offering unsafe places to stay (Bigelsen and Vuotto 2013); similar tactics are known to be used by labor traffickers (Bigelsen and Vuotto 2013). Therefore, access to safe and stable housing is an effective way to reduce vulnerability to HT for RHY.
Although operations research can be used to address the capacity limitations that limit access to safe housing and support services for RHY, with the exception of a few studies, little attention has been paid to its use to examine the allocation of scarce resources for anti-trafficking efforts (Maass et al. 2020, Kaya et al. 2022a, Kaya et al. 2022b). Maass et al. 2020 optimize the location of residential shelters serving trafficked persons in a manner that maximizes a measure of societal impact, while satisfying budget constraints. Kaya et al. 2022b use a discrete event simulation model to evaluate the necessary capacity expansion for a shelter that serves a subpopulation of RHY, namely LGBTQ+ youth.
Kaya et al. 2022a propose a model that projects the cost-minimizing capacity to deploy in existing NYC RHY shelters to provide appropriate housing and support services. The authors consider stochastic youth arrivals and stay durations, services provided in a periodic fashion, and service delivery time windows. Two types of decision variables are used to model how a shelter can expand capacity: (i) extra in-house resource decision variables capture the amount of capacity that can be added within the existing facility; and (ii) overflow shelter decision variables that project the number of youth needing to be directed to a placeholder overflow shelter when the within-shelter capacity cannot be further expanded. While there is utility in understanding the cost-minimizing capacity expansion to satisfy the needs of RHY in NYC through combining extra in-house resources and an overflow shelter, Kaya et al. 2022a leaves open the question of where, and in what quantities, these extra housing and support services should be allocated to appropriately match the needs of RHY. The authors focus on the cost of expanding these services, leaving open the opportunity to consider the likely societal benefits from capacity expansion. We extend Kaya et al. 2022a by allocating new shelter capacity in a manner that maximizes a societal BCR.
4.3 Mathematical Modeling of the Marginal Deployment of Capacity
We extend the model of Kaya et al. 2022a to consider the marginal deployment of new shelter capacity in NYC through a set of new shelters that may be opened, rather than a singular overflow location. The locations of new potential shelter locations are informed by Kaya et al. 2022a and determined through the algorithmic framework that selects the best marginal deployment of new shelter capacity, that is, expanding existing shelters and opening new locations. Tables 1, 2, and 3, respectively, contain the sets and parameters we use for the mathematical modeling of deploying marginal capacity.
| Set | Index | Definition |
|---|---|---|
| Set of youth | ||
| Set of potential new shelter locations | ||
| Set of existing (status quo) shelters | ||
| Set of referral organizations | ||
| Set of shelters (, pairwise disjoint) | ||
| Set of services offered by shelters | ||
| Set of discrete time periods | ||
| Set of boroughs where shelters may exist |
Let be the set of considered RHY in the system, and be the set of considered shelter service providers in NYC. Let be the set of new shelters to be opened (each with a particular NYC location), be the set of existing referral organizations that provide support services, and be the set of currently operating TIL programs (where is the status quo). The sets , and are pairwise disjoint, and . Let be the set of services provided to RHY. Let be the set of discrete time periods over which youth arrivals, and placements, take place.
We outline parameters used for modeling in Tables 2 and 3, and note that a further description of some parameters can be found in Kaya et al. 2022a, Table 2. The parameters we introduce are used to inform the marginal placement of new shelters and the capacity expansion of existing shelters in NYC, influencing both costs and benefits. We model the status quo occupancy of shelter beds to vary based on time . This is done by scaling the value of by . We introduce two types of benefits, and , that respectively represent benefits to individual youth, and benefits to the system. Let be the overall benefit accrued by youth for receiving service within days from the earliest desired start time . Let be the benefit to the system of opening a new shelter . We explain the estimation of parameters in further detail in Section 4.3. Let be the cost of opening a new shelter , and let be the minimum number of youth needed to open a new shelter .
| Symbol | Definition |
|---|---|
| Services requested by youth | |
| Youth benefits accrued (see Section 4.3.2) | |
| Arrival time of youth into shelter system | |
| Earliest start time of service for youth | |
| Latest start time of service for youth | |
| Duration of service for youth | |
| Frequency of service for youth | |
| Time between service requests for periodic service for youth | |
| Flexibility of service |
| Symbol | Definition |
|---|---|
| Critical mass needed for shelter to open | |
| Maximum capacity of shelter for service | |
| Capacity of shelter for service at time | |
| Cost of expanding service at time at shelter by 1 unit | |
| Cost of opening shelter | |
| Assignment cost for youth for service at shelter | |
| Services offered by shelter | |
| Partial return of shelter | |
| Returns multiplier for |
4.3.1 Decision Variables for Marginal Deployment
The decision variables used for modeling marginal deployment of capacity are summarized in Table 4. Note that represents the action variables for this model.
| Variable | Domain | Definition |
|---|---|---|
| if youth is assigned to shelter for service at time | ||
| if (new) shelter is opened | ||
| if youth is ever assigned to shelter | ||
| Proportion of time youth spends in shelter for service | ||
| Units of service to add to shelter at time |
In this model, we have at most variables in total, of which at most are binary.
4.3.2 Objective Function for Marginal Deployment
We model benefits as the function :
| (5) |
with the first term representing the aggregated individual benefits accrued by youth considering the housing and support services they received due to the capacity expansion, and the second term representing benefits accrued from new shelter placement.
Youth Benefits. represents the benefits accrued for a youth receiving a service at time . While we recognize that benefits exist outside of those more easily monetized, we conservatively restrict our analysis of benefits to the more quantifiable labor productivity and health systems savings (Fang et al. 2012). Note that and that . is then computed by:
| (6) |
where dividing by ensures that full benefit is obtained only when a variable is activated for all possible occurrences, reflecting the service provision over the duration of stay for youth for service . Dividing by incentivizes placing youth as soon as they arrive into the system at arrival time .
Estimating System Benefits of New Shelters from Costs. Let be the cost of opening new shelter in a particular NYC borough. The cost is computed as the product of an average annual bed cost (obtained through personal communication with NYC partners), the total available bed capacity in the new shelter , and a cost multiplier that adjusts borough real estate prices relative to the rest of boroughs in NYC:
| (7) |
We use the cost figure to approximate system benefits through estimation by analogy, a common technique that can provide reasonable values under complex estimation circumstances (Karlsen and Lereim 2005, Shepperd and Schofield 1997). To estimate a reasonable public sector return on investment, we use estimates obtained from Bertotti and Akinbode 2015, which evaluated the social return on investment from opening a homeless shelter in London, UK. The authors obtained their estimate through interviews with past and present service users of the shelter. With this return multiplier , we estimate the returns from opening a homeless shelter as :
| (8) |
Total Cost Function. Our total cost function is given by:
| (9) |
The first component of the total cost function is the cost of opening a new shelter , as expressed in (7). The second concerns expansion of available services within shelters. For a shelter , service can be expanded at time within limits for a cost per unit allocated. The final component sums the cost of assigning youth to shelter for service at time . One purpose of this component is to have assignment costs for referral organizations exceed those for , making it more attractive to place youth within modeled shelters over referring the youth out of the system.
With these components, the BCR objective function can be formulated:
| (10) |
4.3.3 Action Constraints for Marginal Deployment
In light of the fractional objective function, we augment the constraints proposed in Kaya et al. 2022a with new constraint sets to ensure action beyond the status quo. The remaining constraint sets for modeling youth in the shelter system are found in Appendix B.
| (11a) | |||||
| (11b) | |||||
| (11c) | |||||
| (11d) | |||||
Constraint set (11a) ensures that the number of new shelter locations in each opened is at least . Constraint set (11b) ensures that, for any new shelter location to open, a critical mass of at least youth is assigned to the shelter. Constraint set (11c) ensures that youth are only assigned to shelters that are open, while constraint set (11d) allows for support services to be delivered to youth who are assigned to specific shelters. System (11) admits at most constraints.
4.4 Newton’s Method
We employ Newton’s method (Dinkelbach 1967) to maximize the BCR (10), with pseudocode provided in Algorithm 1. Newton’s method has superlinear convergence, limiting the number of iterations prior to convergence, and is especially beneficial for larger problem instances. Newton’s method requires two continuous functions and and further assumes that is positive. Action constraints as outlined in Section 4.3.3 ensure that for all . We assume that feasible region is bounded and nonempty. Furthermore, we show in Appendix A that we satisfy the assumptions made for the algorithm: That is compact and connected, that are continuous functions (when considering integer valued variables relaxed to their continuous counterparts), and that is a positive function.
1. Initialize and .
2. Solve
and let be its solution.
3. If Stop; is the optimal solution and is the optimal ratio.
4. If Update , , and go to Step 2.
The tolerance for convergence, , is taken to be a small positive constant. While Newton’s method solves a series of linearized fractional programs in Step 2, the tractability at each iteration of the algorithm is critical for convergence.
5 Computational Studies
The theoretical developments we presented thus far suggest our method provides an effective technique to justify marginal actions through the optimization of a BCR. Using numerical experiments we now demonstrate the effectiveness of our proposed techniques on optimal marginal expansion. We study how the optimal solution changes under four different objective functions. Using large synthetic data sets, we corroborate our theoretical results.
5.1 Computational Setup
All experiments were run using Gurobi Optimization 9.5.2 (Gurobi Optimization, LLC 2022) and Python, with up to 64 GB memory, under Linux Ubuntu 20.04.4. This was performed on [blinded for review] high performance computing research cluster. The Gurobi NodeFileStart parameter was set to 0.5 for all experiments, and the MIPGap tolerance was set to 5%. Limited testing with smaller MIPGap values did not reveal measurable improvement in solution quality, yet incurred substantial runtime increases. Instances were given one day of wall clock compute time, except those in Section 5.4.4, which were given three days for additional computational needs.
To improve model tractability, we employed several techniques to reduce the number of variables needed to run our model. In particular, avoid creating decision variables that occur before or after the last service is administered. Expansion variables are not created for situations in which shelter location does not offer a particular service . Furthermore, we avoid the creation of variables for services that the youth does not request.
5.2 Datasets
5.2.1 RHY Organization and Youth Profiles
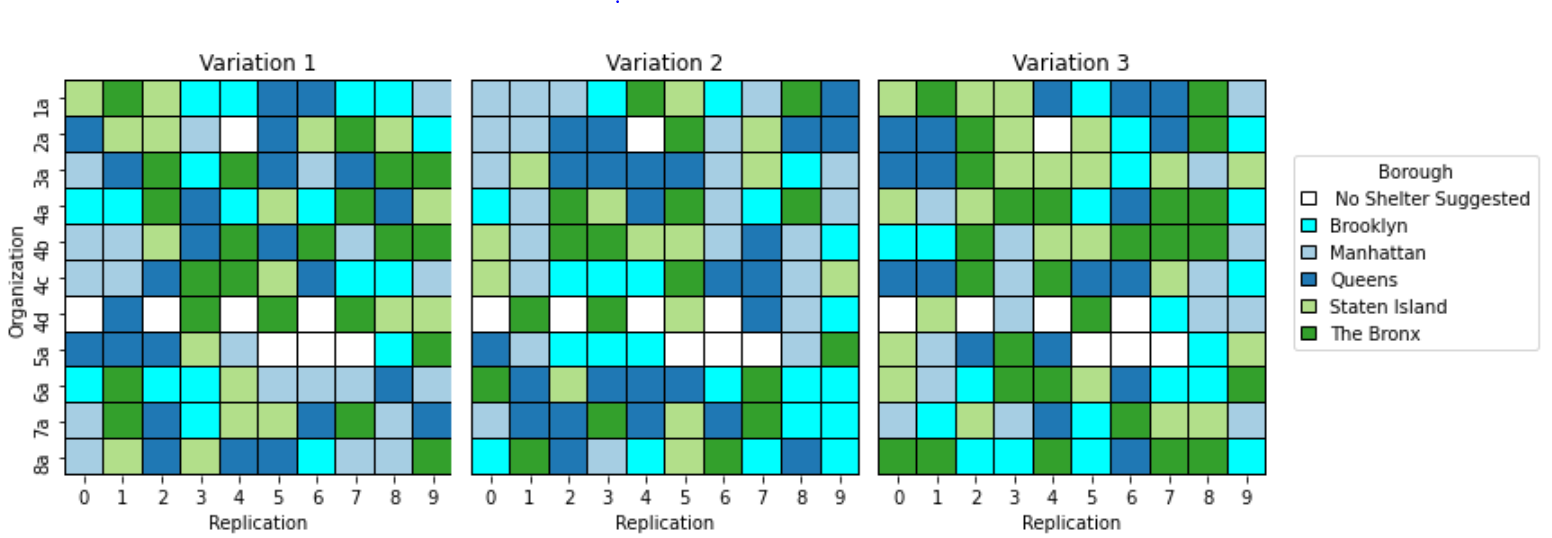
Using the capacity expansion results obtained from the model in Section 4.3 this study requires three datasets: i) existing RHY organization demographic and capacity profiles; ii) RHY youth demographic and service need profiles, and iii) demographic and capacity profiles for a set of new potential RHY shelters. The capacity expansion required and the set of new potential shelters to open in NYC are dependent on the profiles of both existing RHY organizations and RHY youth. These profiles are the same ones used in the aforementioned model, and more details can be found in Appendix C. The demographics, capacity profiles, and quantity of new potential RHY shelters to open (Appendix C) are generated using model outputs in Section 4.3. The details regarding this set of new potential shelters are available in Table 7 and Figures 5 and 6 in Appendix C.
We considered the following thirteen services for youth to request: beds, mental health support, physical health support, substance abuse support, crisis and 24-hour response services, long term support housing, legal assistance, service coordination, practical assistance, financial assistance, life skills, employment assistance, education assistance, and childcare or parenting support. To simulate the current shelter system operating at near-capacity, we use an updated for all existing shelters to simulate operating at capacity, which impacts constraint set (A2) in Appendix B.
5.2.2 Youth Benefits and Shelter Costs
Individual youth benefits as described in Expression (6) are comprised of Medicaid savings and labor productivity to reflect health care costs averted and labor productivity gained. We used values from Lim et al. 2018 to establish average Medicaid savings for homeless individuals in NYC after being placed in a shelter over a year period valued in 2018. We halve the tabulated value of USD for an annual health care cost savings, and then adjust for inflation. Labor productivity figures were obtained from Fang et al. 2012 (adjusting the 2010 figure of USD for inflation to May 2022 USD). The assignment cost , is fixed to for shelters, and for referral organizations, emphasizing a twenty-fold preference for in-house placement over referrals. This value of for in-house assignment differs from Kaya et al. 2022a, who used a value of for in-house assignment.
We estimate using publicly available data sources such as hourly salary estimates and hotel voucher prices in NYC (Gross 2021, NYC Human Resources Administration 2022, Ziprecruiter 2022) and the information we gather are sufficient to inform the capacity expansion required by each service provider to fulfill youth’s needs.
The cost multipliers for each NYC borough used in Expression (7) were determined to be: for Manhattan, for Brooklyn, for Queens, for Staten Island, and for the Bronx. These values were computed from residential rent data (obtained from renthop.com), adjusted for inflation using a calculator from the United States Beareau of Labor Statistics 2022, and then priced relative to Queens, the median rent borough.
A point estimate for the system benefits of opening an urban homeless shelter was determined to be 5.67 by Bertotti and Akinbode 2015, who computed the social return on investment (SROI) associated with opening a homeless shelter in London, UK. To avoid double counting benefits accrued to youth, which are already accounted for in the first portion of the benefits function , we set a conservative estimate for the system benefits from opening a shelter value to , and conduct further sensitivity analyses on this parameter in Section 5.4.2. Additionally, we model weekly allocation decisions over a time horizon of months.
5.3 Computational Experiments
We conduct four sets of experiments to demonstrate the usefulness of a ratio objective function to find the optimal marginal deployment of resources. We create a model of the NYC runaway and homeless youth TIL shelter system to represent the status quo by setting for all , and for all , and . We then optimize this system to find the optimal status quo, as described in Section 3.2. The status quo provides a basis for comparison for how efficient the current system could be.
First we investigate capacity expansion under our BCR ratio objective function, . The results from this ratio are then compared across against three alternative objective functions as described in Section 3.1. These experiments assume partial returns , and a positive minimum number of shelters selected from options to open to ensure sufficient action away from the status quo, allowing both internal expansion of shelter resources as well as new shelters to open.
Second, we vary the minimum number of shelters to open across all of NYC by varying in action constraint (11a) to examine effects on the optimal BCR. We also study the effect of the values for the partial returns from opening shelters on our recommendations regarding which shelters to open.
Third, we conduct experiments that vary costs of potential new shelter locations, to simulate locating in different boroughs in NYC. Three replications with different shelter costs were created to better understand the sensitivity of the optimal solution to cost changes.
Fourth, we performed experiments that vary the number of youth .Such analyses were conducted to test the computational capabilities of our modeling techniques, as well as to observe how the ratio maximizing solution varies as the number of youth in the system increases.
In all four experiments, we apply utilization as a metric to evaluate and compare solutions, which we define as:
| (12) |
Because referral organizations are not explicitly modeled, the utilization metric reflects the effectiveness of the given objective function in serving youth within the shelter system. A high utilization value indicates many youth receive necessary services in-house – a desirable situation from the point of view of continuity of care, trust-building, and minimizing transportation.
5.4 Model Results
We first optimize the status quo as a baseline for comparison - a scenario which considers a large number of youth needing placement in existing shelters assumed to be at capacity. However, with in-house expansion of shelter services not possible and new shelters not open, the only opportunity for improved placement exists in utilizing the remaining of existing capacity effectively. In the status quo we found approximately half of the youth are successfully placed into shelters, with an optimized BCR of approximately 700. Benefits in the BCR ratio accrue from filling any remaining capacity, incurring little additional cost from these in-house assignments. Under the status quo scenario over referrals to external organizations underscores there is room for improvement in youth placement. Accordingly, we apply our algorithmic framework as outlined in Section 3 and test its robustness under the four experiments described in Section 5.
5.4.1 Experiment Set 1:Performance under Different Objectives
The comparison of our ratio objective across three conventional objectives is illustrated in Table 5, where the system has youth and we require at least shelters are opened.
We omitted the objective due its high costs and lack of realism.
| Scenario |
|
|
| |||
| Total Costs (USD) | 806,921 | 12,493,198 | 846,080 | |||
| BCR | 117.7 | 36.1 | 373.8 | |||
| Total Referrals | 2,629 | 401 | 1,199 | |||
| Utilization | 54.5 % | 95.5 % | 82.3 % | |||
| New Shelters Opened () | 2 | 10 | 2 |
Not surprisingly, the cost minimal approach has the lowest cost; however, the BCR optimization very much cost conscious while making necessary expansion decisions. In comparison, benefit less cost maximization is significantly more expensive than these two options. Furthermore under this objective the BCR is significantly lower, indicating that this approach is not sensitive to optimal marginal deployment.
Regarding utilization, in Table 5 we see that this metric increases by under the proposed ratio approach compared to the conventional cost minimization approach - a significant increase considering only a cost increase. To gain a further increase in utilization, the benefit less cost (“profit”) maximization scenario suggests that a increase in costs would be necessary. These costs are incurred from opening another eight shelters. Ratio optimization is able to more effectively utilize the fewer number of shelters to open compared to benefit less cost and cost minimal optimization.
Referrals to external organizations are another important metric in our analysis. A referral indicates that a needed service was unable to be fulfilled by an organization and is referred out of the system. We further discuss referrals next.
5.4.2 Experiment Set 2: Sensitivity on Minimum Shelter Count and Partial Returns
Referrals are modeled as an absorption state for unmet demand, and are assumed to be uncapacitated. A cost-tradeoff exists between referring services out and opening new shelters to meet unmet demand. In Table 6 we compare scenario results for youth for different levels of . This was also run for youth and the results are similar. Here, we present . As expected, as increases, more shelters are open and referral assignments decrease. The greatest referral decrease () is obtained under BCR optimization.
|
|
|
|
| ||||||
|---|---|---|---|---|---|---|---|---|---|---|
| 1 | 825 | 5,440 | 1,333 | 3,233 | ||||||
| 2 | 821 | 5,179 | 1,322 | 2,989 | ||||||
| 3 | 821 | 4,965 | 1,289 | 2,640 | ||||||
| 4 | 822 | 4,701 | 1,276 | 2,329 |
When changing the partial returns value in , we observe that the objective function of opens every possible shelter location. This was verified by running a model with youth and stepping by 0.5 for each shelter from . Stepping through these values is analogous to changing the estimation on the value , the partial returns from opening new shelters. Furthermore when the value of is less than , we see that the model still chooses to open every shelter available. Recall that as is directly related to by the value of . When is less than , the cost of opening a shelter is discounted from the original cost. By convention, benefits and costs are assumed to be weighted equally and as a result, we see that the optimal solution chooses to open every shelter (for objectives and ) as it allows the benefits function to increase more than when only a few shelters are opened with resource expansion. In comparison, a ratio optimization approach does not face these issues. Under a ratio scenario, the optimal marginal deployment is found regardless of the value of partial returns when opening new shelters.
Ideally, the partial returns from actions would be known when deploying our framework. However, sensitivity analysis for this value partially accounts for parameter uncertainty and reveals the importance of the partial returns value in our model.
5.4.3 Experiment Set 3: Cost
5.4.4 Experiment Set 4: Scalability of Modeling
To evaluate model scalability with respect to computational performance, we developed scenarios that increase the number of potential shelters as the number of youth increases. A ratio objective function for youth has approximately variables and constraints. For youth, these numbers scale to variables and constraints. For youth, these numbers scale to million and , respectively. When increasing from to , we increase the number of potential shelters by 50%. The ratio objective runtime with was approximately 3 hours longer compared to the instance with , which took around 15 minutes. When doubling youth from to and allowing twice the number of potential shelters to open, the run times took around 7.5 hours to complete. While its extremely high implementation costs make impractical for a realistic use case, these benefit maximization models completed quickly. This runtime comparison reflects the difficulty of identifying solutions that place youth in a fewer number of shelters while finding optimal marginal deployment (in the case of optimizing the BCR).
These experiments demonstrate the ability of our approach to solve extremely large integer programs in a reasonable amount of time.
We also experimented with a larger number of possible shelter locations to understand the corresponding sensitivity of computational performance. We evaluated sets with as many as different shelter locations across New York City, again incrementing the minimum number of shelters to open , and maintaining youth. These models were able to find optimal shelters to open within three days of compute time, demonstrating the ability of our model to discern between a wide array of different shelter types to find the optimal marginal deployment. Such experiments demonstrate the possibility of considering a greater number of locations, using an optimization approach to refine the set of best alternatives in a symbiotic process with decision makers.
The computational analysis demonstrates the utility of our algorithmic framework for optimizing the BCR as outlined in Procedure 1. We demonstrably found the optimal marginal deployment of resources for the challenge of shelter location and capacity expansion. Comparing to more conventional approaches of and revealed two important advantages. First, we found that ratio optimization leads to significantly higher utilization rates versus a cost minimal approach, with relatively comparable costs. Second, our ratio optimization approach was able to handle linearized mixed-integer programs of substantial size, on the order of hundreds of thousands of variables and constraints, demonstrating its effectiveness when applied to a complex real world problem. Through Newton’s method (Dinkelbach 1967) and it’s super linear convergence, we are able to solve very large models in a modest number of iterations - useful for models involving hundreds of thousands of constraints and variables.
5.4.5 Insights Obtained from Experimentation
We detail several key insights from our experimentation.
BCR Reveals Marginal Deployment of Resources. As demonstrated using conventional objective functions of and , these capacity expansion models open the maximum number of shelters, and accordingly require minimal referrals. In contrast, the solution for the model with objective function has the greatest number of referrals. Interestingly in , we see that referrals levels, though not as low as and , decrease over as increases. Notably, the ratio objective function outperforms in that fewer new shelters are required; yet with minimal increase in referrals. It is also of note that the lower costs associated with are comparable to . When requiring a new shelter to be opened, a ratio optimization approach considers benefits while remaining quite cost conscious, capitalizing on the tradeoff of relatively inexpensive shelter expansion that in turn decreases the number of referrals. Such results reveal that the conventional cost minimization approaches are averse to these smaller actions that impact key metrics of reduced referrals and increased utilization. The BCR optimization approach informs optimal movement away from the status quo, demonstrating optimal marginal activity with respect to action constraints.
BCR is a Nonincreasing Function. Figure 1 plots the optimal BCR as varies when youth, revealing an upward trend in the objective function as more shelters open. We see that the BCR is (not strictly) decreasing when the minimum amount of required action increases through . It is important to note that while the value of BCR does not increase as the minimum number of required shelters () increases, utilization increases by approximately per increment of , and unsurprisingly costs increase. Results are similar for and youth as observed in Figures 2 and 3, respectively. Not only do our ratio-optimized metrics enable a more holistic evaluation of cost–benefit tradeoffs, this approach also facilitates decisions regarding the set of expansion decisions to execute.


6 Concluding Remarks
We develop an algorithmic framework which optimizes the benefit to cost ratio to empower decision making in the public sector. Although such a ratio is widely accepted and used, comparisons between a handful of alternatives are only possible manually.
We combinatorially show how a large number of alternatives can be evaluated on a benefit to cost basis for optimization decision problems. As the availability of modern advanced prescriptive analytics increases, our framework brings the power of optimization to benefit-to-cost decision making in the public sector. Our framework promises data-driven solutions for the large and critical public sector.
We demonstrate our algorithmic framework through a compelling case study of critical capacity expansion decisions for runaway and homeless youth shelters in New York City. We introduce a decision context of allocating additional resources to the homeless shelter system – a public sector setting with extremely limited resources. By estimating appropriate functions for costs and benefits, and expressing constraints that induce action away from the status quo, we show how to optimize the BCR. Through a variety of computational experiments, we illustrate how to deliver the highest leverage decisions for deploying marginal shelter resources.
Optimizing the BCR provides greater granularity regarding marginal improvement from the status quo compared to conventional profit maximization and cost minimization approaches. The implicit assumption between revenue and costs being weighed equally drives profit-style maximization approaches to generate solutions that are relatively insensitive to costs and thus may be impractical to implement due to their exorbitance, and importantly does not reveal marginal activity that is highly efficient. Notably, Newton’s method (Dinkelbach 1967) allows for, yet does not require, benefits and costs to be equally weighted, that is, the special case where that appears in benefits less cost optimization.
BCR Suggests Low-Cost, Highly Effective Decisions In our case study, this behavior is observed by solutions that always open the maximum number of RHY shelters possible in response to the benefit less cost objective. Conventional profit maximization approaches miss an important portion of the decision landscape related to the optimal marginal utility of additional activity, and our framework can both illuminate ratio-maximizing near-term decisions as well as provide a foundation for an iterative process of identifying ratio-maximizing prescriptions over time.
Our algorithmic framework has significant implications for public sector decision making, in which marginal activity may be more practical. Notably, our approach presents a strategy for marginal activity, allowing decision makers and researchers to work together to provide effective model-informed recommendations. Our framework allows to build a landscape of improving feasible alternatives away from the status quo, over time with the status quo being updated. Through action constraints that ensure movement away from the status quo, the decision maker can choose a level of tolerance, however minimal. It is important to note that no action away from the status quo is tantamount to doing nothing. We do not consider this option, as the corresponding costs are zero and consequently the benefit to cost ratio grows to infinity.
Our work is not without limitations. To obtain a tractable estimate for the partial returns of action away from the status quo, we assume that the partial returns of action constraints remains constant throughout the entire modeling process. Future investigations could consider greater dynamics and interplay between action variables on the partial returns for these actions. In our case study, this could be formulated by allowing to depend on as well as how many shelters have already been opened. When computing partial returns, it would be possible to utilize the principles of computing social return on investment such as what is found in Lingane and Olsen 2004. Our study assumes that youth have unrestricted access across the entire RHY system; however, in reality some proportion of youth are geographically restricted, such as proximity and access to public transit lines. With the availability of such detailed knowledge, these could be incorporated as side constraints. Similarly, the types of shelters that can be opened in a geographic location may also warrant further restrictions and considerations.
The above present possible extensions to our approach illustrating how analysts and decision makers can iterate and compare across a variety of constraints to ensure the best marginal action from the status quo, thereby empowering symbiotic development of data-driven, impactful models that are grounded in the real world. More broadly, they serve to underscore the potential of our algorithmic framework to bring benefit to cost ratio optimization to public sector decision making.
Acknowledgements
We thank Meredith Dank and Andrea Hughes at New York University for their perspective on youth service provisions. We thank Jamie Powlovich at the Coalition for Homeless Youth and collaborators at the New York City Mayor’s Office. We thank Sophia Mantell for conversations and background. This research was performed using computational resources supported by the Academic & Research Computing group at Worcester Polytechnic Institute. We are also grateful to the National Science Foundation (Operations Engineering) grant CMMI-1935602 for their support.
References
- Ackermann [2012] Fran Ackermann. Problem structuring methods ‘in the dock’: Arguing the case for soft OR. European Journal of Operational Research, 219(3):652–658, 2012.
- Ahani et al. [2021] Narges Ahani, Tommy Andersson, Alessandro Martinello, Alexander Teytelboym, and Andrew C. Trapp. Placement optimization in refugee resettlement. Operations Research, 69(5):1468–1486, 2021.
- Azizi et al. [2018] Mohammad Javad Azizi, Phebe Vayanos, Bryan Wilder, Eric Rice, and Milind Tambe. Designing fair, Efficient, and Interpretable Policies for Prioritizing Homeless Youth for Housing Resources. In Willem-Jan van Hoeve, editor, Integration of Constraint Programming, Artificial Intelligence, and Operations Research, Lecture Notes in Computer Science, pages 35–51, Cham, 2018. Springer International Publishing.
- Bertotti and Akinbode [2015] Marcello Bertotti and Adedamola Akinbode. Assessing the social return on investment of highway house, a homeless shelter in London, UK. 12 2015.
- Bertsimas et al. [2016] Dimitris Bertsimas, Angela King, and Rahul Mazumder. Best subset selection via a modern optimization lens. The Annals of Statistics, 44(2):813–852, 2016.
- Besiou and Van Wassenhove [2020] Maria Besiou and Luk N. Van Wassenhove. Humanitarian Operations: A World of Opportunity for Relevant and Impactful Research. Manufacturing & Service Operations Management, 22(1):135–145, January 2020. ISSN 1523-4614. doi: 10.1287/msom.2019.0799. URL https://pubsonline.informs.org/doi/10.1287/msom.2019.0799. Publisher: INFORMS.
- Bigelsen and Vuotto [2013] J. Bigelsen and S. Vuotto. Homelessness, survival sex, and human trafficking: As experienced by the youth of Covenant House New York, 2013. Covenant House New York, New York City, NY.
- Boardman et al. [2017] Anthony E Boardman, David H Greenberg, Aidan R Vining, and David L Weimer. Cost-benefit analysis: concepts and practice. Cambridge University Press, 2017.
- Bradley and Frey [1974] Stephen P Bradley and Sherwood C Frey. Fractional programming with homogeneous functions. Operations Research, 22(2):350–357, 1974.
- Chan et al. [2018] H. Chan, L. Tran-Thanh, B. Wilder, E. Rice, P. Vayanos, and M. Tambe. Utilizing housing resources for homeless youth through the lens of multiple multi-dimensional knapsacks. Proceedings of the 2018 AAAI/ACM Conference on AI, Ethics, and Society, pages 41–47, 2018. (New Orleans, LA, USA).
- Charnes and Cooper [1962] A. Charnes and W. W. Cooper. Programming with linear fractional functionals. Naval Research Logistics Quarterly, 9(3–4):181–186, 1962.
- Clawson et al. [2006] Heather J. Clawson, Mary Layne, and Kevonne Small. Estimating human trafficking into the United States: Development of a methodology. National Institute of Justice (NIJ), Washington, DC, 2006.
- Cochran [2022] Darrell Cochran. Report to Congress on proposed refugee admissions for fiscal year 2023, September 2022. Accessed November 22, 2022, https://www.state.gov/report-to-congress-on-proposed-refugee-admissions-for-fiscal-year-2023/l.
- Crouzeix and Ferland [1991a] Jean-Pierre Crouzeix and Jacques Ferland. Algorithms for generalized fractional programming. Math. Program., 52:191–207, 05 1991a. doi: 10.1007/BF01582887.
- Crouzeix and Ferland [1991b] Jean-Pierre Crouzeix and Jacques Ferland. Algorithms for generalized fractional programming. Math. Program., 52:191–207, 05 1991b.
- Curtis et al. [2008] R. Curtis, K. Terry, M. Dank, K. Dombrowski, and B. Khan. Commercial sexual exploitation of children in New York City, Volume One: The CSEC population in New York City: Size, characteristics, and needs. John Jay College of Criminal Justice, 9 2008.
- Dank et al. [2015] M. Dank, J. Yahner, K. Madden, I. Banuelos, L. Yu, A. Ritchie, M. Mora, and B. Connor. Surviving the streets of New York experiences of LGBTQ youth, YMSM, and YWSW engaged in survival sex. Urban Institute, New York, NY, 2015.
- de Langhe and Puntoni [2015] Bart de Langhe and Stefano Puntoni. Bang for the buck: Gain-loss ratio as a driver of judgment and choice. Management Science, 61(5):1137–1163, 2015.
- Dimas et al. [2022] Geri L. Dimas, Renata A. Konrad, Kayse Lee Maass, and Andrew C. Trapp. Operations research and analytics to combat human trafficking: A systematic review of academic literature. PLOS ONE, 17(8):e0273708, August 2022.
- Dinkelbach [1967] Werner Dinkelbach. On nonlinear fractional programming. Management Science, 13(7):492–498, 1967.
- Duran et al. [2013] Serhan Duran, Özlem Ergun, Pınar Keskinocak, and Julie L. Swann. Humanitarian Logistics: Advanced Purchasing and Pre-Positioning of Relief Items. In James H. Bookbinder, editor, Handbook of Global Logistics: Transportation in International Supply Chains, International Series in Operations Research & Management Science, pages 447–462. Springer, New York, NY, 2013.
- Ergun et al. [2010] Özlem Ergun, Gonca Karakus, Pinar Keskinocak, Julie Swann, and Monica Villarreal. Operations Research to Improve Disaster Supply Chain Management. 06 2010.
- Fang et al. [2012] Xiangming Fang, Derek S. Brown, Curtis S. Florence, and James A. Mercy. The economic burden of child maltreatment in the United States and implications for prevention. Child Abuse & Neglect, 36(2):156–165, 2012.
- Fox [2002] Kevin J. Fox. Introduction. In Kevin J. Fox, editor, Efficiency in the Public Sector, pages 1–7. Springer US, Boston, MA, 2002.
- Fuguitt and Wilcox [1999] Diana Fuguitt and Shanton J Wilcox. Cost-benefit analysis for public sector decision makers. Greenwood Publishing Group, 1999.
- Gass [1994] Saul I. Gass. Chapter 2 Public sector analysis and operations research/management science. In Handbooks in Operations Research and Management Science, volume 6 of Operations Research and The Public Sector, pages 23–46. Elsevier, January 1994.
- Gibbs et al. [2014] Deborah Gibbs, Jennifer L. Hardison Walters, Alexandra Lutnick, Shari Miller, and Marianne Kluckman. Evaluation of services for domestic minor victims of human trafficking, 2014. Accessed July 12, 2022, https://nij.ojp.gov/library/publications/evaluation-services-domestic-minor-victims-human-trafficking.
- Greco et al. [2016] Salvatore Greco, Jose Figueira, and Matthias Ehrgott. Multiple criteria decision analysis, volume 37. Springer, 2016.
- Gross [2021] Courtney Gross. NY1 Investigation: Housing Vouchers for Homeless People Routinely Denied By Landlords, 2021. Available at: https://www.ny1.com/nyc/all-boroughs/homelessness/2021/01/27/housing-vouchers-for-homeless-routinely-denied-by-real-estate-industry.
- Gurobi Optimization, LLC [2022] Gurobi Optimization, LLC. Gurobi Optimizer Reference Manual, 2022. URL https://www.gurobi.com.
- Hanemann [1991] W Michael Hanemann. Willingness to pay and willingness to accept: how much can they differ? The American Economic Review, 81(3):635–647, 1991.
- Ibaraki [1983] Toshihide Ibaraki. Parametric approaches to fractional programs. Math. Program., 26(3):345–362, oct 1983. ISSN 0025-5610. doi: 10.1007/BF02591871. URL https://doi.org/10.1007/BF02591871.
- Ide and Mather [2019] Mikala Ide and Darin M. Mather. The structure and practice of residential facilities treating sex trafficking victims. Journal of Human Trafficking, 5(2):151–164, 2019.
- Johnson and Smilowitz [2012] Michael Johnson and Karen Smilowitz. Community-Based Operations Research. Springer, 08 2012.
- Johnson [2012] Michael P Johnson. Community-based operations research: Introduction, theory, and applications. In Community-based operations research, pages 3–36. Springer, 2012.
- Johnson and Smilowitz [2007] Michael P Johnson and Karen Smilowitz. Community-based operations research. In OR tools and applications: Glimpses of future technologies, pages 102–123. INFORMS, 2007.
- Karlsen and Lereim [2005] Jan Terje Karlsen and Jon Lereim. Management of project contingency and allowance. Cost Engineering, 47(9):24–29, 2005.
- Kaya et al. [2022a] Yaren Bilge Kaya, Kayse Lee Maass, Geri L. Dimas, Renata Konrad, Andrew C. Trapp, and Meredith Dank. Improving access to housing and supportive services for runaway and homeless youth: Reducing vulnerability to human trafficking in New York City. IISE Transactions, 0(0):1–15, September 2022a.
- Kaya et al. [2022b] Yaren Bilge Kaya, Sophia Mantell, Kayse Lee Maass, Renata Konrad, Andrew C. Trapp, Geri L. Dimas, and Meredith Dank. Discrete event simulation to evaluate shelter capacity expansion options for lgbtq+ homeless youth. In Winter Simulation Conference, Singapore, 2022b. Forthcoming.
- Keskinocak and Savva [2020] Pinar Keskinocak and Nicos Savva. A Review of the Healthcare-Management (Modeling) Literature Published in Manufacturing & Service Operations Management. Manufacturing & Service Operations Management, 22(1):59–72, January 2020. Publisher: INFORMS.
- Li et al. [2018] Zihao Li, Julie L. Swann, and Pinar Keskinocak. Value of inventory information in allocating a limited supply of influenza vaccine during a pandemic. PLOS ONE, 13(10), October 2018.
- Lim et al. [2018] Sungwoo Lim, Qi Gao, Elsa Stazesky, Tejinder Singh, Tiffany Harris, and Amber Seligson. Impact of a New York City supportive housing program on medicaid expenditure patterns among people with serious mental illness and chronic homelessness. BMC Health Services Research, 18, 01 2018.
- Lingane and Olsen [2004] Alison Lingane and Sara Olsen. Guidelines for social return on investment. California Management Review, 46(3):116–135, 2004.
- Maass et al. [2020] Kayse Lee Maass, Andrew C. Trapp, and Renata Konrad. Optimizing placement of residential shelters for human trafficking survivors. Socio-Economic Planning Sciences, 70:100730, 2020.
- Middleton et al. [2018] Jennifer S. Middleton, Maurice N. Gattis, Laura M. Frey, and Dominique Roe-Sepowitz. Youth experiences survey (yes): Exploring the scope and complexity of sex trafficking in a sample of youth experiencing homelessness. Journal of Social Service Research, 44(2):141–157, 2018.
- Mingers [2011] John Mingers. Soft OR comes of age—but not everywhere! Omega, 39(6):729–741, 2011.
- Morton et al. [2019] M. H. Morton, M. A. Kull, R. Chávez, A. J. Chrisler, E. Carreon, and J. Bishop. A youth homelessness system assessment for New York City, 2019. Accessed June 23 2022, https://www1.nyc.gov /assets/opportunity/pdf/evidence/youth-homelessness-system-assessment-rpt-2019.pdf.
- Murdoch et al. [2007] William Murdoch, Stephen Polasky, Kerrie A Wilson, Hugh P Possingham, Peter Kareiva, and Rebecca Shaw. Maximizing return on investment in conservation. Biological Conservation, 139(3-4):375–388, 2007.
- Murphy [2017] Laura Murphy. Labor and sex trafficking among homeless youth: A ten city study, 2017. Accessed March 4, 2021, https://oag.ca.gov/sites/all/files/agweb/pdfs/ht/murphy-labor-sex-trafficking-homeless-youth.pdf.
- Naccarato and DeLorenzo [2008] Toni Naccarato and Emily DeLorenzo. Transitional Youth Services: Practice Implications from a Systematic Review. Child and Adolescent Social Work Journal, 25(4):287–308, August 2008.
- NYC Human Resources Administration [2022] NYC Human Resources Administration. NYC Human Resources Administration Department of Social Services: Rental Assistance, 2022. Available at: https://www1.nyc.gov/site/hra/help/in-shelter.page.
- Park and Berenguer [2020] Chong Hyun Park and Gemma Berenguer. Supply constrained location-distribution in not-for-profit settings. Production and Operations Management, 29(11):2461–2483, 2020. doi: https://doi.org/10.1111/poms.13235. URL https://onlinelibrary.wiley.com/doi/abs/10.1111/poms.13235.
- Radey and Wilke [2022] Melissa Radey and Dina Wilke. Extent, trajectory, and determinants of child welfare turnover and exit destinations. Children and Youth Services Review, page 106733, 2022.
- Rahmattalabi et al. [2022] Aida Rahmattalabi, Phebe Vayanos, Kathryn Dullerud, and Eric Rice. Learning resource allocation policies from observational data with an application to homeless services delivery. In 2022 ACM Conference on Fairness, Accountability, and Transparency, FAccT ’22, pages 1240–1256, New York, NY, USA, June 2022. Association for Computing Machinery.
- Rais and Viana [2011] Abdur Rais and Ana Viana. Operations Research in Healthcare: a survey. International Transactions in Operational Research, 18(1):1–31, 2011. ISSN 1475-3995. doi: 10.1111/j.1475-3995.2010.00767.x. URL https://onlinelibrary.wiley.com/doi/abs/10.1111/j.1475-3995.2010.00767.x. _eprint: https://onlinelibrary.wiley.com/doi/pdf/10.1111/j.1475-3995.2010.00767.x.
- Schaible [1976a] Siegfried Schaible. Fractional programming. I Duality. Management Science, 22(8):858–867, 1976a.
- Schaible [1976b] Siegfried Schaible. Fractional programming. II on Dinkelbach’s algorithm. Management Science, 22(8):868–873, 1976b.
- Şeref et al. [2009] Onur Şeref, Ravindra K Ahuja, and James B Orlin. Incremental network optimization: Theory and algorithms. Operations Research, 57(3):586–594, 2009.
- Shepperd and Schofield [1997] Martin Shepperd and Chris Schofield. Estimating software project effort using analogies. IEEE Transactions on software engineering, 23(11):736–743, 1997.
- Sinuany-Stern and Sherman [2014] Zilla Sinuany-Stern and H. David Sherman. Operations research in the public sector and nonprofit organizations. Annals of Operations Research, 221(1):1–8, October 2014.
- Smilowitz and Keppler [2020] Karen Smilowitz and Samantha Keppler. On the Use of Operations Research and Management in Public Education Systems. In Pushing the Boundaries: Frontiers in Impactful OR/OM Research, INFORMS TutORials in Operations Research, pages 84–105. INFORMS, November 2020. Section: 4.
- Smith and Shaw [2019] Chris M Smith and Duncan Shaw. The characteristics of problem structuring methods: A literature review. European Journal of Operational Research, 274(2):403–416, 2019.
- Stancu-Minasian [2019] IM Stancu-Minasian. A ninth bibliography of fractional programming. Optimization, 68(11):2125–2169, 2019.
- United States Beareau of Labor Statistics [2022] United States Beareau of Labor Statistics. CPI inflation calculator, 2022. United States Bureau of Labor Statistics, USA.
- United States Department of State [2022] United States Department of State. Trafficking in Persons Report, July 2022. United States Department of State, Office To Monitor And Combat Trafficking in Persons, USA.
- Von Neumann [1937] J. Von Neumann. “Über ein ökonomisches gleichgewichtssystem und eine verallgemeinerung des brouwerschen fixpunktsatzes. Ergebnissse eines Mathematischen Kolloquiums, 8:73–83, 1937.
- Whittington and Grubb [1984] Dale Whittington and W Norton Grubb. Economic analysis in regulatory decisions: The implications of executive order 12291. Science, Technology, & Human Values, 9(1):63–71, 1984.
- Williams [2009] Frederick Williams. Pathways into and out of commercial sexual victimization of children: Understanding and responding to sexually exploited teens, 2009. The Office of Juvenile Justice and Delinquency Prevention, Office of Justice Programs, U.S. Department of Justice, USA.
- Wright et al. [2021] E.R. Wright, A. LaBoy, K. Tsukerman, N. Forge, E. Ruel, R. Shelby, M. Higbee, Z. Webb, M. Turner-Harper, A. Darkwa, and C. Wallace. The prevalence and correlates of labor and sex trafficking in a community sample of youth experiencing homelessness in Metro-Atlanta. Social Sciences,, 10(2):32, 2021.
- Zappone and Jorswieck [2015] Alessio Zappone and Eduard Jorswieck. Energy efficiency in wireless networks via fractional programming theory. Foundations and Trends in Communications and Information Theory, 11(3-4):185–396, 2015.
- Zerbe and Scott [2012] Richard O Zerbe and Director Tyler Scott. A primer for understanding benefit-cost analysis. 2012.
- Ziprecruiter [2022] Ziprecruiter. Social Worker Salary in New York, 2022. Available at: https://www.ziprecruiter.com/Salaries/Social-Worker-Salary--in-New-York.
Appendix A Proof of Satisfying Dinkelbach’s Assumptions
Below is a proof that our model satisfies the assumptions of Newton’s method [Dinkelbach 1967].
A.1 Constraints form a compact and connected domain
Let be the set of feasible points to the fractional objective defined by linear constraints. A subset is compact if it is closed and bounded. is closed if it contains all of its limit points. Because no constraint involves a strict inequality, it is possible for there to exist a point such that lies on the boundary of , implying is closed.
Now, we will show that is bounded. Recall that a set is bounded in if there exists a ball of radius such that . Therefore, it is sufficient to show that is bounded by demonstrating that such an exists. The variables we consider are either binary integer, or continuous. For our binary variables, these are by definition bounded. Integer variables are bounded above by a respective as seen in constraint set (A2) that there is a maximum amount of any resource that can be extended. is the maximum amount of service that can be placed into shelter . The continuous variables are defined on the interval , which thus makes them bounded. This suggests such an exists, implying that is a compact domain.
Now, we will show that is connected. By definition, is connected if there is no separation of . By way of contradiction, let such that and be a separation of . Since and form a separation, and are both nonempty. and both must contain feasible assignments. Therefore, and must have constraint (A5) in common for every youth and shelter pair. However, this would require that and have nonempty intersection. We assumed that , which is a contradiction. Therefore, we have that has no separation, and thus is connected.
A.2 B and C are continuous and C is a positive function
It is important to note that and are valued using integer and binary variables, and are such are not continuous functions. However, when solving this problem numerically, Gurobi [Gurobi Optimization, LLC 2022] relaxes integer variables to while finding a solution. Therefore, we will show that the numerator and denominator are continuous when the variables are valued in . and are trivially continuous, as they are linear combinations of variables, and linear functions are continuous. As the numerator and denominator are a linear combination of many linear functions, they are both continuous as well.
Lastly, we will show that . As all variables are nonnegative, we must show that any feasible solution will feature some variables taking positive values. Constraint set (A7) requires some variables to be activated (set to ) to provide a feasible solution. Because , this component of the denominator will always be positive, and as the remaining components in the denominator are nonnegative, this implies . Our model thus satisfies the necessary assumptions of Newton’s method [Dinkelbach 1967].
Appendix B Full Constraints of The Marginal Deployment Optimization Model
Here, we provide the constraint sets to complete our optimization model. These are inspired from Kaya et al. 2022a, but do differ as we consider specific shelter locations here.
Constraint set (A1) ensures that the number of youth assigned to shelter to receive service at time does not exceed the expanded capacity of the shelter:
| (A1) |
Constraint set (A2) ensures that the capacity expansion does not require adding more resources than the facility can accommodate:
| (A2) |
Constraint set (A3) ensures that every youth is placed to at most one shelter for their needs:
| (A3) |
Constraint set (A4) guarantees that a youth is assigned to an organization to receive service only for the floor of possible times:
| (A4) |
Constraint set (A5) ensures that only youth from accepted demographics can receive housing and support services from shelter :
| (A5) |
Constraint set (A6) ensures that service is not provided to youth when youth is not present at the shelter:
| (A6) |
Constraint set (A7) ensures that youth start receiving services between the earliest and latest times they are willing to receive service :
| (A7) |
Constraint set (A8) ensures that non-periodic services () are provided to youth in non-periodic fashion throughout the time they receive services:
| (A8) |
Constraint set (A9) ensures that periodic services () are provided to youth days apart, with the flexibility of days:
| (A9) |
Constraint set (A10) ensures that periodic services () are only provided to youth at most once, every per period:
| (A10) |
Appendix C Generation of Options for Potential RHY Shelters in NYC
The set of new potential shelters and borough locations used in the benefit to cost ratio in Section 5.4 are based on the results found in Kaya et al. 2022a. Ten replications of the model from Kaya et al. 2022a were completed. Figure 4 shows the bed capacity expansion recommended in Kaya et al. 2022a for each of the 8 RHY organizations across these 10 replications. As the present work considers placing new shelters, we converted the recommended number of beds from Kaya et al. 2022a, to a recommended number of shelters. For each organization this was determined by dividing the recommended number of beds by the observed average number of beds as reported in Table 7. Figure 5 depicts the total number of recommended shelters based on the average bed size for each of the 8 RHY organizations, across 10 replications. The set of potential shelters for 750 and 1,000 youth in Section 5.4.4 were determined using the numbers in Figure 4 and multiplying by factors of 1.5 and 2, respectively.
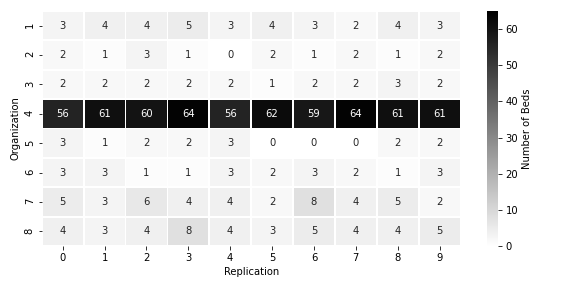
| Organization | 1 | 2 | 3 | 4 | 5 | 6 | 7 | 8 |
| Average Number of Beds | 6 | 8 | 8 | 20 | 9 | 12 | 20 | 12 |
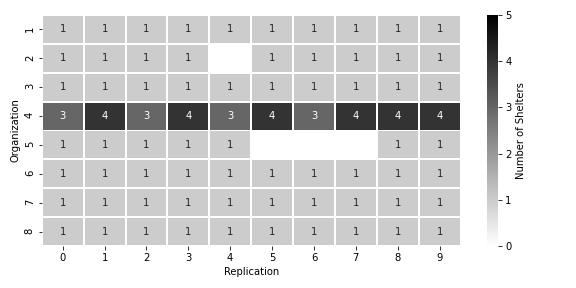
For the experiments outlined in Section 5 we uniformly assigned each new shelter option randomly to one of the five NYC boroughs. The size of potential shelter sets for each replication is the same as the number of recommended shelters found in Figure 5. To create a more robust representation of possible shelter locations, three variations of borough assignments were tested across 10 replications, totaling 30 experiments. The shelter assignments for each replication and variation are depicted in Figure 6. The -axis shows each new potential shelter per organization, where “a”, “b”, “c” and “d” depict different shelters for the associated organization (meaning more than one shelter was recommended for that organization). The color of each square represents to which borough each shelter was assigned across the 10 replications and 3 variations. For experiments outlined in Section 5.4.4 we provided an exhaustive list of all potential shelters and location pairs, totalling between 45-55 possible shelters per replication.