Rimmed and Rippled Accretion Disc Models to Explain AGN Continuum LagsRimmed and Rippled Accretion Disc Models to Explain AGN Continuum Lags–References2022
Abstract
We propose a solution to the problem of accretion disc sizes in active galactic nuclei being larger when measured by reverberation mapping than predicted by theory. Considering the disc’s exposed-surface thickness profile , our solution invokes a steep rim or rippled structures irradiated by the central lamp-post. We model the continuum lags and the faint and bright disc spectral energy distribution (SED) in the best-studied case NGC 5548 (black hole mass , disc inclination ). With the lamp-post off, the faint-disc SED fixes a low accretion rate and high prograde black hole spin , for which and . The bright-disc SED then requires a lamp-post luminosity for disc albedo . Reprocessing on the thin disc with gives time lags but 3 times smaller than observed. Introducing a steep rim, or multiple crests, near light days, reprocessing on the steep centre-facing slope increases temperatures from K to K, and this increases optical lags to match the lag data. Most of the disc surface maintains the cooler profile that matches the SED. The bright lamp-post may be powered by magnetic links tapping the black hole spin. The steep rim occurs near the disc’s dust sublimation radius as in the “failed disc wind model for broad-line clouds”. Lens-Thirring torques aligning the disc and black hole spin may also raise a warp and associated waves. In both scenarios, the small density scale height implied by the inferred value of suggests possible marginal gravitational instability in the disc.
Keywords:
accretion, accretion discs – galaxies: active – galaxies: Seyfert – quasars: supermassive black holes - individual: NGC 5548.1 Introduction
Active Galactic Nuclei (AGN) are fascinating objects of study not least because they are the brightest compact objects in the known universe, reaching luminosities up to (Barnett et al. 2015). These extreme luminosities are realised by gaseous material spiralling toward a central super-massive black hole (SMBH). The gas falls into an accretion disc whose differential rotation causes viscous torques to heat the gas, which loses gravitational potential energy and angular momentum allowing it to accrete onto the black hole (Lynden-Bell 1969; Shakura & Sunyaev 1973). The viscous forces and radiation transfer cause extreme temperatures of up to several million Kelvin (Frank et al. 2002) in the inner part of the accretion disc. These discs produce highly variable continuum emission that is correlated across UV, optical and infrared wavelengths (MacLeod et al. 2010; Shappee et al. 2014; De Rosa et al. 2015; Edelson et al. 2015). Variability amplitudes appear larger in the AGN of fainter Seyfert 1 galaxies than their brighter cousins, quasars (Rumbaugh et al. 2018). The exact physics of the accretion onto AGN is not fully understood, a major obstacle being that the compact sizes and remote distances of AGN accretion discs make them impossible to resolve with current or near-future telescopes.
Nevertheless, spectral analysis is a useful tool to analyze the physical properties of AGN discs. Viscous dissipation in steady-state opaque regions of the disc generates an effective temperature with a distribution where is the disc radius. In these regions, the disc’s spectral energy distribution is a composite of blackbody radiation from a range of radii and hence temperatures (Pringle 1981). This distribution is indistinguishable from the reprocessed flux of a razor-thin passive disc around a bright central source. Time-dependent evolution of either disc accretion rate or brightness of illuminating sources can lead to observational probes of the disc structure.
In this context, reverberation mapping (RM; Blandford & McKee 1982) studies of continuum AGN light curves show that shorter-wavelength variations often lead those at longer wavelengths (Wanders et al. 1997; Sergeev et al. 2005; Cackett et al. 2007). A linearised RM model predicts that the longer-wavelength continuum emission fluctuates about a mean level and responds to the driving source as
| (1) |
Here describes the shape of the driving lightcurve, and is a distribution over that describes a change in the accretion disc light observed at time in response to a change in the variable driving source at the earlier time . With normalised to zero mean and unit variance, is the mean and is the root-mean-square (RMS) of the responding lightcurve. The lags arise due to light-travel-time delays and the full shape of the delay distribution encodes information on the accretion rate, disc inclination and slope of the disc radial temperature profile (Starkey et al. 2017). The dependence of the response function on the accretion disc parameters allows us to probe the accretion disc structure despite direct resolution being currently impossible.
A simple accretion disc model invoked to describe continuum variability is known as the ‘lamp-post’ model. Here, together with its intrinsic flux due to steady viscous dissipation and local emission, a continuum variability arises from a thin accretion disc due to the thermal reprocessing of photons incident on the disc from a driving point source of irradiation, in Eqn. (1), typically located several gravitational radii above the SMBH. The energy source of this ‘lamp-post’ may be photons from the inner disc surface that are boosted to higher energies by Compton up-scattering interactions with a corona of non-thermal electrons above the inner disc near the black hole. This lamp-post model, combined with the temperature profile of the standard thin disc, gives rise to a lag spectrum that may adequately explain continuum lags for a number of AGN (Cackett et al. 2007; Starkey et al. 2016; Troyer et al. 2016). However, other continuum variability studies suggest that this lamp-post model paints an incomplete picture of AGN variability.
Recent continuum RM studies often broadly agree with the picture, but find cross-correlation lags that are several (2–5) times larger than expected for a standard thin disc with independent measurements for black hole mass and Eddington ratio (Cackett et al. 2018; Homayouni et al. 2018; Edelson et al. 2019). Microlensing effects in multiply-imaged quasars similarly imply disc sizes larger than expected (Poindexter et al. 2008; Morgan et al. 2010; Mosquera et al. 2013).
This discrepancy between theory and observations is stimulating a search for helpful revisions to the standard thin-disc model, including two-stage reprocessing in a thick inner torus prior to disc irradiation (Gardner & Done 2017), non-blackbody disc emission due to a scattering atmosphere (Hall et al. 2018), replacing light travel time with slower alfven speeds (Sun et al. 2020), elevating the irradiating source several light days above the disc (Kammoun et al. 2021) and diffuse bound-free and free-free continuum emission from the more extended emission-line regions (Korista & Goad 2001; Lawther et al. 2018; Chelouche et al. 2019; Netzer 2022).
These efforts have focused primarily on the overly-large disc sizes inferred from the measured lag spectrum . However, an equally relevant and in fact more easily measured constraint comes from the spectral energy distribution (SED) of the flux variations, in Eqn. (1), which provides an independent probe of the disc temperature profile. In particular, a disc temperature profile corresponds not only to an observable delay spectrum , but also to disc variations with a power-law SED, . For the standard model, , , and . A viable disc model needs to comply with both constraints, from the continuum lags, and from the SED.
In this work we explore one possible interpretation for the large continuum lags observed in the STORM campaign on NGC 5548 (Fausnaugh et al. 2016; Starkey et al. 2017) and subsequently in other targets (Cackett et al. 2018; Homayouni et al. 2018; Edelson et al. 2019; Hernández Santisteban et al. 2020). In particular, we show how lamp-post models with a finite disc thickness profile can account for both the continuum lags and the variable disc SED . Section 2 summarises the constraints from the STORM campaign on NGC 5548, highlighting the strong challenge posed by these data to the standard thin-disc reprocessing model. Section 3 reviews the lamp-post model for reprocessing from the surface of a finite-thickness accretion disc. A generalized vertical thickness profile alters the accretion disc response function by changing the light travel lag and the irradiation incidence angle on the reprocessing surface at each radius and azimuth. Section 4 discusses thin-disc models for NGC 5548 that fit the disc SED in the faint and bright states, deriving the accretion rate in the faint state, the lamp-post luminosity in the bright state, and the disc inner radius, which constrains the black hole spin. These razor-thin disc models, with , fit the disc SED but predict lags far smaller than observed. Considering power-law profiles in Section 5, and rippled profiles in Section 6, we find in both cases models that fit not only the faint-disc and bright-disc SEDs, but also the inter-band continuum lags. We summarise our findings and discuss some future prospects in Section 7.
2 Challenges from the STORM campaign on NGC 5548
We focus our efforts on the strong challenges posed by the most complete RM study to date, based on data from the Space Telescope and Optical Reverberation Mapping (STORM) campaign (De Rosa et al. 2015; Edelson et al. 2015; Fausnaugh et al. 2016; Starkey et al. 2017). This experiment realises very high signal-to-noise multi-wavelength multi-epoch light curves of the AGN within the Seyfert 1 galaxy NGC 5548. The STORM campaign spanned 6 months in 2014, including X-ray, UV, and optical monitoring, achieving sub-day cadence in most bands.
The multi-band continuum light curves, analysed using both cross-correlation techniques (Edelson & Krolik 1988; Edelson et al. 2015) and the JAVELIN code (Zu et al. 2011; Fausnaugh et al. 2016), yield the basic lag spectra that we adopt for our analysis. As shown in Fig. 1a, the measured lags, relative to the 1367Å HST light curve, rise roughly linearly with , reaching days at 9000Å. Against this rising trend, an excess lag of perhaps 0.5 days may be present in the band suggesting that Balmer continuum emission may contribute to the -band lag. Our analysis ignores this feature and concentrates on fitting the overall rising trend.
Probing the NGC 5548 disc

In fitting the lag data, Fausnaugh et al. 2016 adopt a power-law model
| (2) |
where Å is the reference wavelength of the band used for the lag measurements, and compare the resulting parameter to the value predicted for NGC 5548’s black hole mass (Pancoast et al. 2014) and Eddington ratio . Here is the total (disc + lamp-post) luminosity and is the Eddington luminosity, with and the Sun’s mass and luminosity. In the Fausnaugh et al. 2016 analysis the best-fit lag parameter , with a razor-thin disc model, is larger than expected by a factor of compared with the prediction for the thin-disc model. The lags correspond instead to a thin-disc model with .
Starkey et al. 2017 report a more stringent test of accretion disc theory using the CREAM code (Starkey et al. 2016) to fit the NGC 5548 STORM continuum light curves in detail. CREAM assumes a variable lamp-post irradiating the surface of a zero-thickness disc with an assumed power-law temperature profile, . By fitting the model of Eqn. (1) to the light curve data at all wavelengths, CREAM determines the light curve of the lamp-post variations , the power-law temperature profile , the disc’s inclination , and the mean and rms spectra, and , respectively. This method senses not just the mean delay, but also the width and shape of the delay distribution , thus determining the disc inclination, , and the power-law index of the temperature profile, . The CREAM analysis achieves a very satisfactory fit to the observed variations from Å to Å (Starkey et al. 2017). This fit validates the adequacy of the linearised echo model, Eqn. (1), to describe quite large observed disc variations, a factor 5 in brightness with little change in the shape of the SED. However, the best-fit model’s temperature profile is hotter and steeper than the prediction of thin-disc theory, and the observed delays are a factor of larger than that expected from a thin-disc model with . As a consequence, when the inferred profile is used to compute the disc SED, the model result is well above the observed SED.
| Parameter | Previous value1 | This work | Units |
|---|---|---|---|
| 0.0014 | |||
| 0.0 | 0.93 | ||
| 6 | 2 | ||
| 0.25 | |||
| 0.0023 | |||
| 75 | 75 | Mpc |
1 Previous values from Fausnaugh et al. 2016.
.
days.
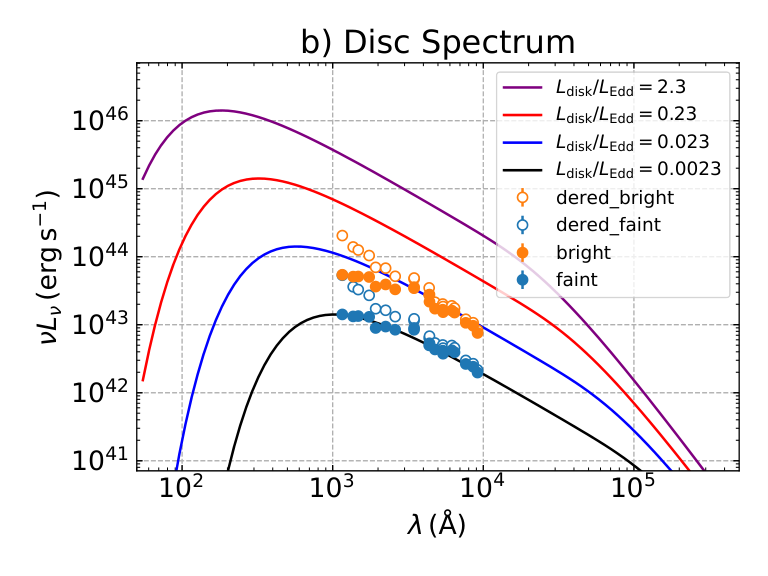
To illustrate this problem, Fig. 1 shows how the standard accretion disc model fails to simultaneously fit the observed disc lags and SED. Fig. 1a compares the observed lags (Fausnaugh et al. 2016) with lags for standard thin-disc models at four accretion rates spaced by factors of 10. Fig. 1b compares these same models with the observed disc SED (host galaxy light subtracted) at the faintest and brightest flux levels observed during the STORM campaign (Starkey et al. 2017). The models that fit the lags have accretion rates 100–1000 times higher than those that fit the bright-disc and faint-disc SEDs.
The observed faint-disc and bright-disc SEDs in Fig. 1 are corrected for Milky Way dust extinction, and are shown both with and without a correction for possible SMC-like dust in the host galaxy. For this we adopt , which raises the UV fluxes just enough to straighten the observed disc SED close to a power law. This indicates a range of possible intrinsic disc SEDs and highlights that the red end near Å is less affected than the UV end near Å. The observed disc SED is close to or slightly bluer than predicted by the standard disc theory. Here , where is the observed flux density and Mpc is the luminosity distance to NGC 5548, based on its redshift (De Rosa et al. 2015), and a standard CDM cosmology with , and .
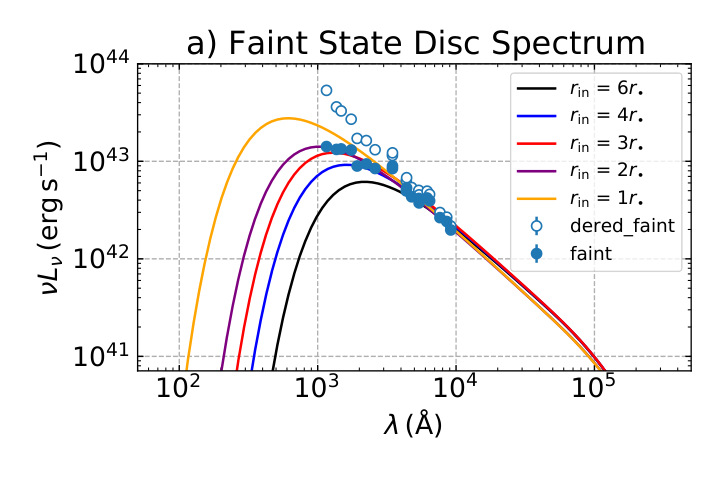
For our analysis of NGC 5548, we adopt updated parameters as summarised in Table 1, including a somewhat larger mass, , and a disc inclination , as derived from emission-line velocity-delay maps (Horne et al. 2021). The disc models shown in Fig. 1 are for a zero-thickness disc heated entirely by the viscous dissipation associated with accretion. The model fitted to the faint-disc SED (black curve in Fig. 1b) is discussed in Section 4.1. In brief, the accretion rate is adjusted to fit the red end of the SED, and the inner disc radius is adjusted to fit the UV end, where the flux decreases due to the maximum temperature achieved in the inner disc.
Having established this baseline model for the faint-disc SED, increasing by a factor of 10 brings the model SED into agreement with the bright-disc SED. This suggests that a 10-fold change in accretion rate, or corresponding increase in heating from the lamp-post irradiation, is needed to match the observed span of flux variations. The lag data require a much higher accretion rate, and that model is far above the observed disc SED. This huge discrepancy highlights the standard thin-disc model’s failure to fit both the lags and the SED, and the importance of attending to both constraints rather than just the lags.
Our results in Fig. 1 confirm the findings of (Fausnaugh et al. 2016) and (Starkey et al. 2017). It thus appears that the brightness temperature of the disc surface, which determines its surface brightness and thus the flux we observe, is lower than its colour temperature, which determines the wavelength of the reprocessed radiation at which we observe a given lag. A low accretion rate that fits the SED predicts lags smaller than observed (Fig. 1a). A high accretion rate that fits the lags predicts a much brighter disc than observed (Fig. 1b). We address these seemingly incompatible constraints by introducing a finite disc thickness, , and adjusting its shape to increase temperatures while reducing the fraction of the disc surface that is exposed to the lamp-post irradiation. We thus turn to developing the framework of these finite-thickness disc models.
3 Reverberating Accretion Disc Models
We consider geometrically-thin accretion disc models in which differential rotation produces local viscous heat dissipation and outward transport of angular momentum that allows material to spiral inward and accrete onto the black hole. We neglect any auxiliary energy sources including those from embedded stars, neutron stars, or stellar massive black holes (Artymowicz et al. 1993; Lin et al. 1994; Goodman & Tan 2004) but we do take into account the effect of surface irradiation, analogous to the context of protostellar discs (Chiang & Goldreich 1997; Garaud & Lin 2007). A compact variable source of irradiation, modelled as a point source isotropically-emitting ‘lamp-post’ at height on the symmetry axis just above (and below) the black hole, drives temperature variations that move outward through the disc to produce observable variability in the accretion disc SED. Possible contributors to such a lamp-post are the X-ray and EUV photons reprocessed by the hot electrons in the corona above the disc close to the supermassive black hole.
3.1 Steady disc irradiated by a lamp-post
In a steady-state geometrically-thin accretion disc (Shakura & Sunyaev 1973), the disc’s effective temperature profile , found by balancing the viscous and irradiative heating with blackbody radiation from both sides of the disc surface, can be written as
| (3) |
Here the left and right terms give and , representing respectively contributions from viscous heating and lamp-post irradiation. In the pre-factor, and are the Newton and Stefan-Boltzmann constants, and are the black hole’s mass and accretion rate.
In the viscous heating term, the factor reduces viscous heating to zero at the inner radius where the shear vanishes (but see Agol & Krolik 2000 for modification of this term including viscous torques due to magnetic links with the black hole). For a black hole accretion disc the inner radius is usually taken to be the inner-most stable circular orbit (ISCO) radius, . In terms of the black hole’s angular momentum and spin parameter ,
| (4) |
where is the gravitational radius, with the speed of light, and (Bardeen et al. 1972). For black holes with spin axis parallel/anti-parallel to the disc’s angular momentum vector, the sign in Eqn. (4) is negative and positive respectively. For non-rotating black holes, , , and . For discs around rapidly spinning black holes with nearly parallel angular momentum vector, , , , and so that corresponds to and (Table 1).
In the irradiative heating term, is a dimensionless efficiency factor, and describes the radial dependence of the lamp-post irradiation, as discussed below. The dimensionless energy conversion and reprocessing efficiency, for the lamp-post model, is
| (5) |
where is the bolometric luminosity of the lamp-posts above and below the black hole that irradiate the two sides of the disc, and is the albedo of the disc surface, assumed independent of . The lamp-post efficiency can differ from that of the disc,
| (6) |
where, by integrating over both sides its surface, the accretion disc’s bolometric luminosity is
| (7) |
With the lamp-post off (), viscous heating alone gives . If we assume , then for a Schwarzshild black hole. But, it is likely to be modified by radiative hydrodynamics of the disc gas (Jiang et al. 2014; Jiang et al. 2019). The total luminosity, radiated by both sides of the disc and by the lamp-posts above and below the disc, is .
In the lamp-post model, the central source that irradiates the upper surface of the disc is idealised as an isotropic point source located on the symmetry axis. Based on constraints from x-ray reverbration-mapping and microlensing observations (Reis & Miller 2013; Cackett et al. 2021), we consider models with a height a few above the black hole. The covering fraction in Eqn. (3) is then given, for , by
| (8) |
is a function of the assumed thickness profile of the disc’s exposed surface, of which several are explored in this work.
The accretion disc SED is calculated using the Planck formula integrated over solid angle,
| (9) |
where is the photon frequency, is the luminosity distance, is the disc inclination, , and are the Planck constant, Boltzmann constant and speed of light, respectively. This is for a flat disc, for which the foreshortening factor is , independent of position on the disc surface. Our models for curved disc surfaces account for the foreshortening factor varying over the disc surface. As is customary, we present observed and model disc SEDs in isotropic luminosity units,
| (10) |
3.2 Continuum reverberation lags
A sudden spike in irradiation from the central lamp-post source causes a lagged reverberation response from the disc, , whose strength and distribution in wavelength and lag depends on several factors including the distance from the lamp-post to the disc surface element, the temperature profile , the lamp-post efficiency , and the incidence angle of the lamp-post irradiation. To compute the total accretion disc response at a particular wavelength, we calculate the response at each disc surface element, and numerically integrate over the disc surface.
Observing the accretion disc at inclination angle , the delay between observed photons emitted from the lamp-post and those reprocessed on the disc surface, at radius , azimuth and height , is given by
| (11) |
where . This assumes Euclidean geometry and neglects general relativity effects near the black hole since s is small compared with the observed lags. Given Eqn. (11) for the time delay and Eqn. (3) for the temperature profile, our linearised reprocessing model for the continuum response at time delay and wavelength is (see also Starkey et al. 2017)
| (12) |
where is the solid angle on the observer’s sky of a disc surface element at radius and azimuth , is the Planck function at the local effective temperature , is the lamp-post luminosity, is the observed flux from the lamp-post, or in practice a proxy thereof, is the Dirac delta function, and is the time delay given by Eqn. (11). Observed inter-band continuum lags, obtained by cross-correlating light curves (Fausnaugh et al. 2016), correspond (approximately) to the response-weighted mean delay given by
| (13) |
As discussed in Starkey et al. 2016, for a flat disc geometry and , the mean delay scales as and is independent of the inclination even though becomes wider and more highly skewed as the inclination increases from face-on () to edge-on () orientations. For a concave bowl-like disc surface, however, the mean delay increases with inclination, as discussed in Section 5.1 below.
These continuum lags (Eqn. 13) are set by the response function (Eqn. 12) which fundamentally depends on:
(i) the strength of the response at each disc surface element. This in turn depends on the irradiation and viscous heating effects resulting from the disc properties and geometry, and
(ii) the time lag (Eqn. 11) between the lamp-post irradiation and the reverberation response from each surface element on the disc. This lag depends on the accretion disc geometry.
4 Zero-thickness disc models that fit the faint and bright disc SEDs
The classic thin-disc model assumes a negligible vertical thickness or , resulting in a profile given by Eqn. (3) with covering factor
| (14) |
Since the entire disc surface is exposed to the variable lamp-post in this model, . This distribution is similar to that predominately due to viscous dissipation only, in Eqn. (3), which we assume holds during the faint state. After the lamp-post is turned on, the elevated flux propagates outwards on light travel timescales much shorter than the local dynamical time scale at the radii reached by the light. Consequently, cannot change significantly despite the intensified surface heating. Under these circumstances, the irradiation increases the local effective temperature, and the resulting changes in the continuum light curve then have a wavelength-dependent lag time .
We adopt a 3-step approach in fitting the reverberating disc model to the NGC 5548 data. We first adjust (Section 4.1) and (Section 4.2) to fit the faint-disc SED with the lamp-post off. Then we turn on the lamp to fit the bright disc SED (Section 4.3). Finally we adjust the profile to fit the continuum lags (Sections 5 and 6).
Effect of on the faint-disc SED

| SED fit | ||||||
|---|---|---|---|---|---|---|
| K | ||||||
| 6 | 0.00 | 1/12 | 0.0010 | 0.0019 | 27 | 327/17 |
| 4 | 0.57 | 1/8 | 0.0015 | 0.0019 | 37 | 56/17 |
| 3 | 0.80 | 1/6 | 0.0020 | 0.0019 | 46 | 23/17 |
| 2 | 0.93 | 1/4 | 0.0023 | 0.0014 | 58 | 21/17 |
| 1 | 1.00 | 1/2 | 0.0045 | 0.0014 | 96 | 53/17 |
Notes: assumes 0.05 dex (%) systematic uncertainty. The values are for and .
Irradiated flat-disc models
4.1 Faint-disc SED and accretion rate.
In the first step, we adjust the accretion rate and the inner radius to fit the faint-disc SED. Our best-fit faint-disc model is the faintest of those shown in Fig. 1, with system parameters summarised in Table 1. This faint-disc model has the lamp-post off, in Eqn. (3), so that the disc is heated entirely by the viscous dissipation and torques associated with the inward accretion flow. This is a simplifying assumption, since there will be some irradiation in the faint state, and we make it because the faint-state accretion rate and lamp-post irradiation are degenerate parameters. If we decrease , the lamp-post can increase to compensate. Thus our estimate is an upper limit. Note that the shape of the model SED is a good match to the data (black curve in Fig. 1b), but the predicted continuum lags are far smaller than the observed lags (Fig. 1a). At this stage we ignore the discrepant lags and concentrate on fitting the faint-disc SED.
Fig. 2 and Table 2 detail several models with different . All of these have adjusted to fit the IR end of the SED, where . In assessing the match between the model and observed disc SED, note that the UV end (Å) is less certain than the IR end (Å). The UV end is sensitive to possible dust extinction in the host galaxy (open and filled circles in Fig. 2). Given this uncertainty, we can regard as successful those model discs with SEDs that fall in between the open and closed circles in Fig. 2. A good fit on the IR end of the SED is insensitive to dust and in our model requires , for and .
Our estimate for is lower by a factor 5 compared with previous values (Table 1) that are based on fitting the brighter mean disc SED assuming and . We note that the NGC 5548 disc brightens and fades by a factor of 5 over a timescale of a few months, much faster than the dynamical time at light days where the optical continuum arises, and too fast to be attributed to changes in accretion rate. Accordingly, our is lower than previous estimates because it corresponds to the faint state, with the lamp-post off. We emphasise again that our neglect of lamp-post irradiation in the faint state makes our estimate for an upper limit, and our estimates for lamp-post irradiation are lower limits.
4.2 Inner radius and black hole spin.
The model SED has a UV downturn corresponding to the maximum temperature reached as the inspiraling gas approaches the inner radius . We assume that occurs at the ISCO radius, which decreases as we increase the black hole spin. A higher spin has a smaller , a higher and a bluer SED. To match the UV end of the observed SED, needs to be at or above K. For a Schwarzshild black hole (, ), the maximum disc temperature is only K, and the model disc SED is too red (black curve in Fig. 2). This zero-spin black hole is strongly disfavoured (). Instead we need a smaller and thus a higher . The model with and reaches K to give an acceptable fit (. Our best model, with and K, achieves , with 2 parameters fitting 19 data. These fit assessments include a systematic flux uncertainty of 0.05 dex, about 12 %, as determined from the MCMC fit discussed in Section 5.2. Our best-fit model has a spin parameter , , and .
The above spin estimate based on fitting the UV end of the observed disc SED is subject to several caveats. First, the spin may be higher if we allow for dust. The maximum spin model, with and correspondingly higher K and bluer SED, has a higher , but is equally acceptable if we allow for possible dust extinction and reddening in the host galaxy. Second, higher temperatures may be generated if the inner disc is heated by torques conveyed through magnetic links between the black hole and inner disc (Agol & Krolik 2000). If so, then the spin may be lower than our estimate. Finally, the lamp-post approximation, neglect of relativity effects, and blackbody assumption may be too simple to realistically describe the UV end of the disc SED. Nevertheless, the possibility of probing inner-disc physics in this way is an interesting prospect.
4.3 Bright-disc SED and lamp-post luminosity.
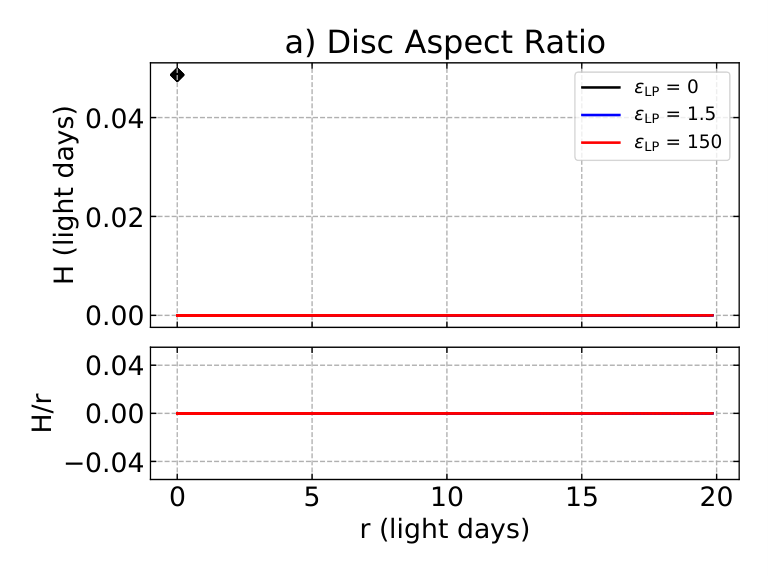
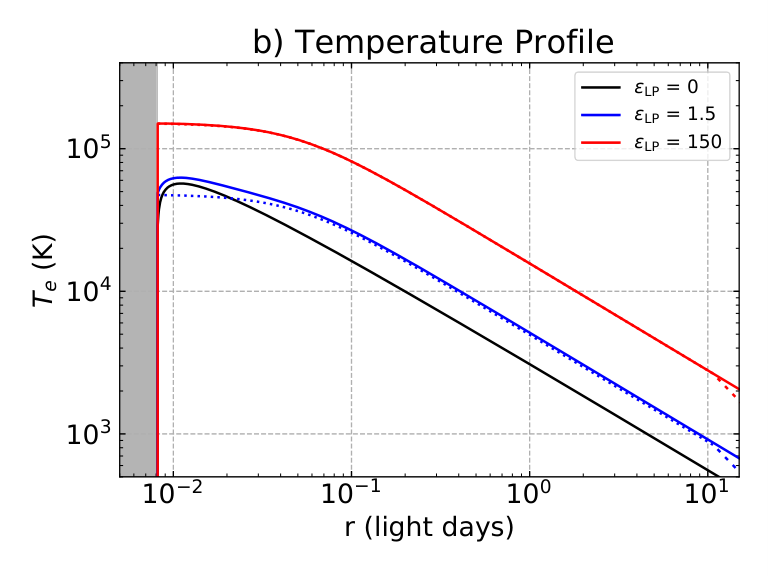
Having found a baseline model that fits the faint-disc SED with the lamp-post off, we now turn the lamp on, heating the disc surface, and adjust its intensity until it fits the bright disc SED. Fig. 3 shows, for the lamp-post model with a razor-thin flat disc with (Panel a), the temperature profile (Panel b) and the corresponding disc SED (Panel c) and delay spectrum (Panel d) . This is similar to Fig. 1 except that there the temperature profile is set entirely by viscous heating, with no irradiation, the different models corresponding to different accretion rates. Here we hold fixed, but increase in Eqn. (3) to turn on the lamp-post. This elevates the disc temperatures, increasing both the disc fluxes and the lags, as shown in Fig. 3. The observed SED increases by a factor of 5 without significant change in the spectral shape (Starkey et al. 2017) The lamp-post heated model similarly raises the model SED without significantly changing its spectral shape. The model with (blue curve) achieves a satisfactory fit.
These first 2 steps, fitting the faint and bright disc SED, are successful with a zero-thickness disc, (Fig. 3c). In the third step, we aim to fit the continuum lags without upsetting the fit to the bright disc SED. This fails for a zero-thickness disc. Increasing helpfully raises both the disc fluxes and the disc lags. But the model that fits the bright disc SED (, blue curve) predicts lags that are too small, and the model that fits the lags (, red curve) predicts disc fluxes far above those observed.
The zero-thickness models, though very easy to construct, are inconsistent with the requirement of hydrostatic equilibrium in accretion discs heated by either viscous dissipation or irradiation. In subsequent sections we address this mismatch by exploring alternative models that replace the zero-thickness disc with finite-thickness models that include concave and convex power-law shapes (Section 5) and wave-like ripples (Section 6) in the thickness profile of the disc surface. Since the density in the radiation reprocessing surface is much lower than that in the midplane, is likely to be several times larger than the density scale height in the disc, as inferred for protostellar discs (Garaud & Lin 2007).
Irradiated concave, conic, convex and flat disc models
5 Discs with power-law profiles
To address the mismatch between observed lags and those from our disc models, while maintaining their good fit to the faint-disc and bright-disc SEDs, we generalise the zero-thickness disc model, , to a finite thickness power-law model:
| (15) |
Here is the disc height at fiducial radius and is the power-law slope. This parameterisation allows for concave () and convex () surface profiles that modify the way in which the central lamp-post irradiates the disc surface at each radius, as well as altering the light travel time delays.
A power-law disc thickness profile can be constructed theoretically from a standard disc model with an appropriate opacity law in the energy equation. In the relevant regions of AGN discs (with a few light days) where radiation pressure and electron-scattering opacity dominate, (Shakura & Sunyaev 1973; Frank et al. 2002). (Interior to this region, where gas pressure dominates, .)
Fig. 4 compares predictions for this model, relative to the thin-disc predictions, for power-law indices , , and , corresponding to convex, conic, and concave disc surfaces, respectively. The lamp-post luminosity is calculated using . The format of Fig. 4 is the same as that in Fig. 3. Panel a shows the model disc thickness and Panel b the corresponding effective temperature profile . Panel c shows model disc SEDs, , along with the faint-disc and bright-disc SED data obtained during the STORM campaign on NGC 5548. Panel 4d shows the model delay spectra along with the measured cross-correlation lags. Note here that the concave disc surface () increases the lags, and the convex disc surface () decreases the lags, as discussed in more detail below.
Considering first a face-on viewing angle, , the concave model () reduces lags at longer wavelengths by elevating the disc (thus reducing the light travel time lag) and also by tilting the disc surface toward the lamp-post (thus increasing the irradiation). Conversely, a convex profile () reduces irradiation in the outer regions, steepening the profile. Both effects alter the predicted delay spectrum in ways that may reduce tension between the observations and the model predictions.
The temperature profile for such a model is given by Eqn. (3) with a covering factor of the form
| (16) |
where .
For both flat ( and conic () disc profiles, which are relevant for the gas and radiation pressure dominated, non-self-gravitating, inner region of AGN discs, the expression in Eqn. (16) reduces to the thin-disc case, Eqn. (14). We see this property in Fig. 4 where the flat disc with (black line) and conic disc with (red dashed line) exhibit the same temperature profile, , the same SED, , and the same continuum lags .
For convex disc profiles (), the accretion disc at radius must satisfy the condition
| (17) |
in order to be exposed to the lamp-post irradiation. This condition is satisfied if
| (18) |
In this region, the magnitude of decreases with , Eqn. (16) substitutes into Eqn. (3) to give
| (19) |
so that decreases with faster than and decreases with faster than . Outer regions of the disc (at , where ) are “in the shadows” of the inner regions and thus are not heated by irradiation.
For convex disc profiles (), the outer regions can be in the shadow of the inner regions, i.e. not exposed to the lamp-post, so that . The blue curves in Fig. 4, for , show an example in which the outer regions ( light days) are in the shadow of the inner regions. This shadowing of the cooler outer-disc regions makes the SED bluer (Fig. 4c) and decreases the lags (Fig. 4d).
For concave disc profiles (), Eqn. (17) is always satisfied, i.e. all parts of the disc are exposed to the irradiation (red and purple lines in Fig. 4). The irradiative heating term, in Eqn. (3), is an increasing function of so that decreases with less steeply than the (Fig. 4b), the SED becomes redder (Fig. 4c) and the lags increase (Fig. 4d).
Irradiating a flat disc with a steep rim
To summarise the above considerations, illustrated in Fig. 4, the shape of the disc thickness profile can alter the irradiated disc’s profile in ways that are helpful in moving the model predictions closer to the observed disc lags. In particular, a concave disc surface helpfully increases the lags, but also increases fluxes on the red end of the SED. The key issue then is to retain the larger lags without producing an excessive increase in the red flux.
5.1 Fits with a concave bowl-like profile
To reconcile the conflicting constraints from the lags and the SED, a promising option is a concave bowl-shaped disc surface. This exposes annuli at larger radii to a larger solid angle of lamp-post irradiation, increasing in the outer disc. For the power-law profiles considered in Eqn. (15), produces a concave disc surface on which the power-law slope of is in the inner disc where , and less steep () in the outer disc where . We need to boost temperatures to K at days to increase the lag at 9000 Å toward the maximum lag .
A second effect that helps to increase lags is the result of our viewing angle, , looking into the concave bowl shape of the irradiated disc. As the bowl is tipped away from a face-on view, the near side becomes less visible than the far side as a result of the foreshortening of disc surface elements. Thus relative to a flat disc, for which the mean lag is independent of inclination, we see a larger response on the far side of the tilted bowl relative to the near side, and this increases the lags.
A drawback of the bowl-shaped disc surface is that while it increases the lags it also increases the flux on the red end of the SED. This can already be seen in Fig. 4c for the model. This unwanted red flux excess can be reduced by decreasing the outer disc radius , but that also reduces the lags. A compromise is needed between fitting the lags and fitting the SED.
We attempted to realise this compromise by adjusting the depth and shape of the bowl, the height of the lamp-post, and the outer radius, with some success. But a fully optimised model was hard to discover while moving around in this 4-dimensional parameter space. The best result we achieved by hand was for a model with , but with a relatively thick disc, at light days. This “slim disc” model comes close to fitting the data, but is less natural than a thinner disc model in which vertical hydrostatic equilibrium gives a smaller , of order the ratio of sound speed to Kepler velocity.
5.2 MCMC fits yield a thin disc with steep rim
After some investigations adjusting parameters by hand, we automated the optimisation of 4 model parameters, the lamp-post luminosity , the disc thickness and shape parameters , , and the outer disc radius , with fixed . We implemented Markov-Chain Monte Carlo (MCMC) sampling to search the parameter space of the model and improve the initial fit. Replacing at day by at provided a more nearly orthogonal set of parameters. To keep all 4 parameters positive, we adopted priors uniform in their log. Assuming Gaussian errors on the flux and lag measurements, we adopt the usual the badness-of-fit metric,
| (20) |
Here , sums the squares of fit residuals between the data and corresponding model , normalised to the variances . The sum extends over both the lag and flux data, 18 lags, and 19 fluxes in the bright and faint states, a total of 56 data. We include a noise-model parameter , added in quadrature with the nominal flux errors . This extra variance parameter enables the model to relax its attention to the SED data and thereby to improve the fit to the lag data. Thus we adjust 5 parameters to fit 56 data.
The result of our MCMC fitting, from several starting points in the parameter space, was to drive up to large values, . This automated search produces a disc geometry that is very flat out to days, with a steep rise at days. The model SED is dominated by the flat inner disc, fitting the faint-disc and bright-disc SEDs well. The flux noise parameter is optimised at dex, about 12%.
Fig. 5 shows 3 models with increasing producing a steep rim on the outer edge of the disc, here set to light days (Panel a). The rim height is light days, corresponding to . With a modest , the declining on the flat inner disc is elevated by a factor , and rises rapidly to K at the irradiated rim (Panel b). The steep rim contributes little to the SED (Panel c), and the unwanted red flux actually decreases as the rim becomes steeper. However, the steep rim greatly increases the lags (Panel d), which now rise with wavelength to 3.5 days, coming much closer to the observed lags days.
To understand this behaviour, note that the steep rim at produces a U-shaped delay distribution, with a sharp peak at from the far side, and a weaker peak at from the near side. The delay distribution is particularly simple for an infinitely steep vertical rim (), for , since the near half of the rim faces away from the observer, then rising linearly, , to a maximum at . With this distribution the mean lag from a vertical rim is
| (21) |
Inside the steep rim, the flat disc with produces a relatively prompt response with a lag increasing as . The combined disc + rim response has a lag in between these extremes, moving from one to the other as their relative contributions change with wavelength. The flat disc response dominates at UV and blue optical wavelengths and the rim response becomes increasingly prominent at redder optical wavelengths.
The result is a plausible fit to the bright and faint disc SEDs and simultaneously to the lags, as shown in Fig. 5. The shape of the model lag spectrum is not perfect, however. While the model lags are small in the UV, rising rapidly in the optical and becoming flat in the IR, the observed lags increase more nearly linearly with wavelength. Nevertheless, this flat disc + steep rim model is the first model we found that achieves a plausible fit to both the lags and the SEDs.
A steep rim may arise from a tearing structure in a warped disc (Nixon et al. 2012) or the launch pad of a failed disc wind (Czerny & Hryniewicz 2011; Baskin & Laor 2018; Naddaf et al. 2021). The failed disc wind model was proposed as a mechanism for the origin of the broad line region (BLR). It is particularly compelling here, since it predicts an increase in the disc thickness when the surface temperature falls below the dust sublimation temperature, about 1000 K for carbonaceous dust or 1500 K for silicate dust. Notice in Fig. 5b that the disc temperature just inside the steep rim is indeed around 1500 K, compatible with silicate dust. The dust opacity intercepts upward radiation from the disc, accelerating dusty gas up into the stronger lamp-post irradiation until it evaporates the dust. This mechanism may well produce a steep rim at the dust sublimation radius, just where we need it to reproduce the continuum lags in NGC 5548.
Irradiating a disc with sinusoidal ripples
6 A rippled disc surface
Another promising option for achieving higher temperatures over a small fraction of the disc surface, and thus longer lags without excessive flux, is to introduce a rippled structure on the reprocessing surface. The lamp-post then irradiates the inward-facing crests, leaving the rest of the disc surface in shadow. This landscape concentrates the irradiation into a smaller surface area, increasing the temperature and thus the lag, while leaving the valleys at the viscous temperature, keeping the flux low. A rippled surface thus offers the potential to address both problems, aiming for a successful trade-off between the lags being too small and fluxes being too large.
We therefore consider the possibility of small-scale ripples on the power-law profile of the accretion-disc surface, analogous to the wake and towering features observed by the Cassini spacecraft on Saturn’s rings during its equinox (Cuzzi et al. 2010; Cuzzi et al. 2018; Spitale & Porco 2010). The possibility of small-scale structures may arise from turbulence, embedded stars (Artymowicz et al. 1993; Goodman 2003), or quasi-periodic oscillations (Ingram & Motta 2019), or corrugated waves (Shu et al. 1983), standing or propagating, that modulate the height of the reprocessing surface (Papaloizou et al. 1998; Lubow et al. 2002). Such structures may also be spontaneously excited or warped through the Lense–Thirring precession induced by the misalignment of a rapidly spinning SMBH’s rotation and the disc’s angular-momentum vectors (Bardeen & Petterson 1975; Papaloizou & Pringle 1983; Pugliese & Stuchlík 2015), tidally perturbed by some embedded companions (Artymowicz et al. 1993; Martin et al. 2014), or episodic infall of gas with diverse angular momentum orientation (Schawinski et al. 2015). There are observed properties of AGN discs that have been interpreted as evidence of warped structures (Lawrence & Elvis 2010). The Lense-Thirring torque is linearly proportional to SMBH’s spin parameter and the warping radius is an increasing function of . With for NGC 5548 (Table 1), this effect is likely to be relevant. There is also observational evidence of warps and other substructures in discs around young stars (Matter et al. 2014) and interacting binary stars (Fragner & Nelson 2010).
In principle, the wave form depends on poorly constrained viscosity in both the radial and normal direction of the disc (Pringle 1992; Papaloizou & Lin 1995; Ogilvie 1999; Nixon et al. 2012; Tremaine & Davis 2014). For modeling convenience, we adopt an idealized prescription by modulating our power-law disc profile with a wave-like perturbation, such that the vertical profile becomes
| (22) |
where is the power-law disc height introduced in Eqn. (15), is the radial wave number, is the fractional wave amplitude at radius , is the power index for its radial distribution, and . We also model non-sinusoidal waveforms by replacing
| (23) |
so that steepens and flattens the wave crest.
In principle, the perturbation in the disc structure by a population of embedded stars or stellar mass black holes may introduce multiple locally thickened arcs. Gravitational instability in discs with may also lead to the arcs with enhanced density, pressure, and aspect ratio. Under the assumption that multiple arcs have a uniform distribution with high filling factor in the azimuth direction, we have neglected any departure from axial symmetry in .
Irradiating a power-law accretion disc with steep wave crests
6.1 Shadow zones between irradiated wave crests
Consider first the thin-disc limit with , constant and small such that the disc surface remains below the lamp-post height, . For large , the wave crest occurs at radius , and the change in radius between successive crests is . The crests all have the same height . As viewed from the lamp-post, the corresponding change in the small angle between successive wave crests is
| (24) |
Since , find
| (25) |
Note that for . In this limit, all peaks are exposed to the irradiation although the grazing angle between the lamp-post and the plane of the disc surface diminishes with increasing .
Also in this model, valleys may be in the shadows. Due to reduction in the grazing angle at the elevated wave crests, is reduced by . Within a distance just inside each crest, the slope leading up to the crest is exposed to the lamp-post irradiation if
| (26) |
After some algebra, the above inequality reduces to
| (27) |
in the limit of . This ratio gives the fraction of the disc surface area that is irradiated. For a moderately large-amplitude wave, and ,
| (28) |
In the small-amplitude limit, , attains the maximum value , as the shadowed area decreases and disappears. This limit is nearly equivalent to a disc with a ripple-free surface. The region between and (or equivalently between and ) is in the shadows so that only the viscous dissipation contributes to the heating. In this region, and the luminosity emitted into sterradians from the shadowed part of the annulus is
| (29) |
In the irradiated region, between and , the luminosity emitted is
| (30) |
so that the total luminosity, , is
| (31) |
Thus the presence or otherwise of shadows does not alter the reprocessed energy, averaged over the radial wavelength, other than by the wave amplitude increasing the effective thickness of the disc. However, when shadows are present the re-radiation is confined to a smaller surface area and this results in higher temperatures in the exposed regions just inside the peaks. In thermal equilibrium, , so that
| (32) |
In the limit of a zero-thickness disc (, ), the expression in Eqn. (32) reduces to that of Eqn. (3). More generally (i.e. for non vanishing and modest ), since (Eqn. 28), the exposed crests are hotter (Eqn. 32) than in the shadowed valleys (Eqn. 3 with ). It is also hotter than that for an irradiated disc with no ripples.
6.2 Testing rippled disc models against the data
Fig. 6 investigates a model with sinusoidal waves atop a flat disc. This model fits the continuum lags well but has excess flux on the red end of the bright-disc SED. The wave amplitude here is rather extreme, but note that the valleys in shadow can be “filled in” without altering the model lags or SEDs, since these shadowed regions remain at the viscous temperature. The fractional wave amplitude can thereby be reduced without spoiling the success in matching the data.
Fig. 7 considers a rippled-disc model with steeper wave crests atop a concave power-law disc. This model fits well the faint and bright disc SEDs and the optical lags but less well the UV lags. Both of these rippled-disc models achieve reasonably good fits to both the NGC 5548 continuum lags and the faint-disc and bright-disc SEDs. The key to success in fitting the lags is to elevate disc temperatures to about K at a radius of about 5 light days, but only on a small fraction of the disc surface, thus to preventing an unwanted rise on the red end of the SED.
These rippled-disc models have a lot of flexibilty that could be fine-tuned to refine the fits. However, such an analysis is beyond the scope of this paper and may in any case be of limited value at this stage given the simplifying assumptions and the wide range of physical mechanisms that may lead to waves or warps on accretion disc surfaces. Our intention here is to illustrate with a few examples how a rippled disc surface can alter the model lags in ways that ease the tension between disc models and the larger-than-expected disc sizes inferred from reverberation mapping time lags.
7 Summary and Outlook
We have introduced a simple analytic model to investigate the effect of curved vertical structure, including ripples and rims, in an AGN accretion disc. The rippled disc structure shadows parts of the accretion disc from irradiation by the hot corona around the black hole. We explore how this shadowing affects the disc SED and show how such a structure is expected to alter the inter-band continuum lags measured from reverberation mapping experiments.
We test predictions of this model against the disc sizes inferred from light travel time lags from the STORM reverberation mapping study of NGC 5548. We find models that succeed in fitting not just the disc lags but also the faint-disc and bright-disc SEDs, by introducing steep transitional or wavy structures on the disc surface. The irradiation is then concentrated on the relatively small center-facing slopes near a rim or multiple crests, increasing the local temperature. Longer lags then result first due to the increased temperature but also from the front-to-back asymmetry when the inward-tilted crests are viewed at a finite inclination angle. Lags increase because foreshortening reduces our view of the irradiated faces on the near side, and opens up our view of the same structures on the far side of the disc. The flux does not increase excessively on the red end of the SED because the rim and/or ripples expose only a small fraction of the disc surface to irradiation, leaving most of it close to .
Our approach goes beyond previous work that has focused on fitting the lags without also fitting the disc SED. The disc fluxes are derived from the spectral variations, extrapolating to lower disc fluxes to correct for the host galaxy contribution. The disc SED provides an equally important constraint on the accretion disc temperature profile, and is actually easier to measure than the inter-band continuum lags. A viable interpretation of the observed continuum lags and spectral variations requires reverberating disc models that fit both constraints.
Perhaps the simplest successful model (Fig. 5) retains a thin disc with viscous heating alone in the faint disc, augmented by lamp-post irradiation in the bright disc, and with a steep rim on which the irradiation elevates the temperature to K. Intriguingly, this model’s intrinsic disc temperature (due to viscous dissipation alone) just inside this steep rim is K, rising to K with the additional grazing-incidence lamp-post irradiation. As these are close to dust sublimation temperatures, the disc should thicken outside this radius due to vertical radiation pressure acting on dust grains in the disc atmosphere. This “failed disc wind” hypothesis (Czerny & Hryniewicz 2011; Baskin & Laor 2018; Naddaf et al. 2021) can be tested by applying the thin-disc + steep-rim model to the lags and SEDs of other AGN to see if they consistently place the rim near the dust sublimation radius.
The failed disc wind model offers a natural mechanism for generating BLR gas clouds outside the radius where our model places the steep disc rim. Scattering of the disc emission by the BLR inter-cloud medium may then introduce additional time delays that may be interpreted with a relatively large lamppost height (Jaiswal et al. 2022).
Our blackbody reprocessing model cannot produce the observed excess lag in the band, which samples the Balmer continuum. To account for this effect, the BLR clouds offer a natural venue where reprocessing yields a diffuse bound-free continuum response with longer lags than those from the more compact accretion disc (Korista & Goad 2001; Lawther et al. 2018; Chelouche et al. 2019; Netzer 2022). Which reprocessor – the disc or the BLR – dominates the lags? Netzer 2022 proposes that BLR lags dominate. Adopting a negligible disc lag, he models AGN lag spectra, with good success, by diluting BLR lags from photo-ionisation models of radiation-pressure confined gas clouds, with a wavelength-dependent mix reflecting the BLR/disc flux ratio. Our models represent the opposite extreme, with blackbody reprocessing on a structured disc surface dominating the lag spectrum, plus a minor bound-free response from BLR gas clouds to increase lags in the band. Further intensive multi-band monitoring, combined with careful modelling to fit simultaneously the lag spectrum and the changes in the disc SED, should be able to clarify this ambiguity.
Other possible mechanisms for generating steep vertical structures include disc warps and propagating waves. With inferred from the SED during the low state of NGC 5548, the Lense-Thirring torque is expected to be significant in the disc inner region. The alternative ripple model (Figs. 6, 7) is similar to the structure expected for warped discs around a rapidly spinning and slightly misaligned SMBH (Bardeen & Petterson 1975; Papaloizou & Pringle 1983; Pringle 1992; Papaloizou & Lin 1995; Ogilvie 1999; Nixon et al. 2012; Tremaine & Davis 2014).
For all the models presented here, the total (disc + lamp-post) luminosity during the bright-disc state is assumed to be sub-Eddington. For our successful models (Figs. 5, 6, 7) we find (.
Typical values of the disc aspect ratio for the exposed disc surface at the base of the ripples is (Figs. 5, 6, 7) at light days. The corresponding density scale height at the disc midplane where is the sound speed at the mid-plane) is several times smaller (Garaud & Lin 2007) (i.e. ). With an prescription for disc’s viscosity () the mass transfer rate in a steady state is
| (33) |
where is the gravitational stability parameter. With the model parameters in Table 1, we find . Marginal gravitational stability, with and (Deng et al. 2020), would be maintained (Goodman 2003) with . Based on these inferences, we are constructing a self-regulated stellar evolution and pollution in AGN disc (SEPAD) model which will be presented elsewhere.
In the observed wavelength range (Å), the peak brightness is 5 times that attributed to the steady-state viscous dissipation. In our best-fit models, the required lamp-post bolometric luminosity is times that emitted by the entire disc during the faint state. Such large fluctuation amplitudes in X-ray flux are commonly observed in AGNs, on the timescales of hours (Ponti et al. 2012). Moreover, these sources appear to originate from the corona regions within a few from the SMBH (Chartas et al. 2009; Kara et al. 2016) as we have assumed in our lamp-post model. The cause of these large fluctuations may be associated with nonlinear variations in the accretion rate near the ISCO due to poorly understood disc instability (Yuan & Narayan 2014) or modulations resulting from the radiative hydrodynamic processes (Jiang et al. 2014; Jiang et al. 2019). With the large inferred , it is also possible to extract the SMBH’s rotational energy with magnetic fields in their proximity (Blandford & Znajek 1977; Agol & Krolik 2000; McKinney 2005). Whatever the physical mechanisms driving AGN variability, the increasing number and quality of continuum light curves and long-term monitoring of emission-line shape variability (Shapovalova et al. 2004) will make such variability studies very popular for investigating the gas flow around the inner disc. Identifying where this departs from the thin-disc theory will be an extremely interesting aspect of study for future reverberation mapping experiments.
Acknowlegements
We thank the referee for the helpful comments and suggestion made during the submission of this manuscript. DL thanks E. Kara and P. Ivanov for useful conversation. DAS and KH acknowledge support from the UK Science and Technology Facilities Council (STFC) consolidated grant to St.Andrews (ST/M001296/1). DL thanks the Carnegie Foundation for a centenary professorship providing support at St Andrews where this investigation was initiated.
Data Availability
The data analysed in this paper are for NGC 5548 the cross-correlation time lags from Fausnaugh et al. 2016 and the faint-disc and bright-disc SEDs from Starkey et al. 2017.
References
- Agol & Krolik (2000) Agol E., Krolik J. H., 2000, ApJ, 528, 161
- Artymowicz et al. (1993) Artymowicz P., Lin D. N. C., Wampler E. J., 1993, ApJ, 409, 592
- Bardeen & Petterson (1975) Bardeen J. M., Petterson J. A., 1975, ApJL, 195, L65
- Bardeen et al. (1972) Bardeen J. M., Press W. H., Teukolsky S. A., 1972, ApJ, 178, 347
- Barnett et al. (2015) Barnett R. et al., 2015, A&A, 575, A31
- Baskin & Laor (2018) Baskin A., Laor A., 2018, MNRAS, 474, 1970
- Blandford & McKee (1982) Blandford R. D., McKee C. F., 1982, ApJ, 255, 419
- Blandford & Znajek (1977) Blandford R. D., Znajek R. L., 1977, MNRAS, 179, 433
- Cackett et al. (2021) Cackett E. M., Bentz M. C., Kara E., 2021, iScience, 24, 102557
- Cackett et al. (2018) Cackett E. M., Chiang C.-Y., McHardy I., Edelson R., Goad M. R., Horne K., Korista K. T., 2018, ApJ, 857, 53
- Cackett et al. (2007) Cackett E. M., Horne K., Winkler H., 2007, MNRAS, 380, 669
- Chartas et al. (2009) Chartas G., Kochanek C. S., Dai X., Poindexter S., Garmire G., 2009, ApJ, 693, 174
- Chelouche et al. (2019) Chelouche D., Pozo Nuñez F., Kaspi S., 2019, Nature Astronomy, 3, 251
- Chiang & Goldreich (1997) Chiang E. I., Goldreich P., 1997, ApJ, 490, 368
- Cuzzi et al. (2010) Cuzzi J. N. et al., 2010, Science, 327, 1470
- Cuzzi et al. (2018) Cuzzi J. N., Filacchione G., Marouf E. A., 2018, in Planetary Ring Systems. Properties, Structure, and Evolution, Tiscareno M. S., Murray C. D., eds., Cambridge University Press, pp. 51–92
- Czerny & Hryniewicz (2011) Czerny B., Hryniewicz K., 2011, A&A, 525, L8
- De Rosa et al. (2015) De Rosa G. et al., 2015, ApJ, 806, 128
- Deng et al. (2020) Deng H., Mayer L., Latter H., 2020, ApJ, 891, 154
- Edelson et al. (2019) Edelson R. et al., 2019, ApJ, 870, 123
- Edelson et al. (2015) Edelson R. et al., 2015, ApJ, 806, 129
- Edelson & Krolik (1988) Edelson R. A., Krolik J. H., 1988, ApJ, 333, 646
- Fausnaugh et al. (2016) Fausnaugh M. M. et al., 2016, ApJ, 821, 56
- Fragner & Nelson (2010) Fragner M. M., Nelson R. P., 2010, A&A, 511, A77
- Frank et al. (2002) Frank J., King A., Raine D., 2002, Accretion Power in Astrophysics. Cambridge University Press, Cambridge, UK
- Garaud & Lin (2007) Garaud P., Lin D. N. C., 2007, ApJ, 654, 606
- Gardner & Done (2017) Gardner E., Done C., 2017, MNRAS, 470, 3591
- Goodman (2003) Goodman J., 2003, MNRAS, 339, 937
- Goodman & Tan (2004) Goodman J., Tan J. C., 2004, ApJ, 608, 108
- Hall et al. (2018) Hall P. B., Sarrouh G. T., Horne K., 2018, ApJ, 854, 93
- Hernández Santisteban et al. (2020) Hernández Santisteban J. V. et al., 2020, MNRAS, 498, 5399
- Homayouni et al. (2018) Homayouni Y. et al., 2018, ApJ
- Horne et al. (2021) Horne K. et al., 2021, ApJ, 907, 76
- Ingram & Motta (2019) Ingram A. R., Motta S. E., 2019, NewAR, 85, 101524
- Jaiswal et al. (2022) Jaiswal V. K., Prince R., Panda S., Czerny B., 2022, arXiv e-prints, arXiv:2206.12497
- Jiang et al. (2019) Jiang Y.-F., Blaes O., Stone J. M., Davis S. W., 2019, ApJ, 885, 144
- Jiang et al. (2014) Jiang Y.-F., Stone J. M., Davis S. W., 2014, ApJ, 796, 106
- Kammoun et al. (2021) Kammoun E. S., Papadakis I. E., Dovčiak M., 2021, MNRAS, 503, 4163
- Kara et al. (2016) Kara E., Alston W. N., Fabian A. C., Cackett E. M., Uttley P., Reynolds C. S., Zoghbi A., 2016, MNRAS, 462, 511
- Korista & Goad (2001) Korista K. T., Goad M. R., 2001, ApJ, 553, 695
- Lawrence & Elvis (2010) Lawrence A., Elvis M., 2010, ApJ, 714, 561
- Lawther et al. (2018) Lawther D., Goad M. R., Korista K. T., Ulrich O., Vestergaard M., 2018, MNRAS, 481, 533
- Lin et al. (1994) Lin D. N. C., Artymowicz P., Wampler J., 1994, in NATO Advanced Study Institute (ASI) Series C, Vol. 417, Theory of Accretion Disks - 2, Duschl W. J., Frank J., Meyer F., Meyer-Hofmeister E., Tscharnuter W. M., eds., p. 235
- Lubow et al. (2002) Lubow S. H., Ogilvie G. I., Pringle J. E., 2002, MNRAS, 337, 706
- Lynden-Bell (1969) Lynden-Bell D., 1969, Nature, 223, 690
- MacLeod et al. (2010) MacLeod C. L. et al., 2010, ApJ, 721, 1014
- Martin et al. (2014) Martin R. G., Nixon C., Lubow S. H., Armitage P. J., Price D. J., Doğan S., King A., 2014, ApJL, 792, L33
- Matter et al. (2014) Matter A. et al., 2014, A&A, 561, A26
- McKinney (2005) McKinney J. C., 2005, ApJL, 630, L5
- Morgan et al. (2010) Morgan C. W., Kochanek C. S., Morgan N. D., Falco E. E., 2010, ApJ, 712, 1129
- Mosquera et al. (2013) Mosquera A. M., Kochanek C. S., Chen B., Dai X., Blackburne J. A., Chartas G., 2013, ApJ, 769, 53
- Naddaf et al. (2021) Naddaf M.-H., Czerny B., Szczerba R., 2021, ApJ, 920, 30
- Netzer (2022) Netzer H., 2022, MNRAS, 509, 2637
- Nixon et al. (2012) Nixon C., King A., Price D., Frank J., 2012, ApJL, 757, L24
- Ogilvie (1999) Ogilvie G. I., 1999, MNRAS, 304, 557
- Pancoast et al. (2014) Pancoast A., Brewer B. J., Treu T., Park D., Barth A. J., Bentz M. C., Woo J.-H., 2014, MNRAS, 445, 3073
- Papaloizou & Lin (1995) Papaloizou J. C. B., Lin D. N. C., 1995, ApJ, 438, 841
- Papaloizou & Pringle (1983) Papaloizou J. C. B., Pringle J. E., 1983, MNRAS, 202, 1181
- Papaloizou et al. (1998) Papaloizou J. C. B., Terquem C., Lin D. N. C., 1998, ApJ, 497, 212
- Poindexter et al. (2008) Poindexter S., Morgan N., Kochanek C. S., 2008, ApJ, 673, 34
- Ponti et al. (2012) Ponti G., Papadakis I., Bianchi S., Guainazzi M., Matt G., Uttley P., Bonilla N. F., 2012, A&A, 542, A83
- Pringle (1981) Pringle J. E., 1981, ARAA, 19, 137
- Pringle (1992) Pringle J. E., 1992, MNRAS, 258, 811
- Pugliese & Stuchlík (2015) Pugliese D., Stuchlík Z., 2015, ApJS, 221, 25
- Reis & Miller (2013) Reis R. C., Miller J. M., 2013, ApJL, 769, L7
- Rumbaugh et al. (2018) Rumbaugh N. et al., 2018, ApJ, 854, 160
- Schawinski et al. (2015) Schawinski K., Koss M., Berney S., Sartori L. F., 2015, MNRAS, 451, 2517
- Sergeev et al. (2005) Sergeev S. G., Doroshenko V. T., Golubinskiy Y. V., Merkulova N. I., Sergeeva E. A., 2005, ApJ, 622, 129
- Shakura & Sunyaev (1973) Shakura N. I., Sunyaev R. A., 1973, A&A, 24, 337
- Shapovalova et al. (2004) Shapovalova A. I. et al., 2004, A&A, 422, 925
- Shappee et al. (2014) Shappee B. J. et al., 2014, ApJ, 788, 48
- Shu et al. (1983) Shu F. H., Cuzzi J. N., Lissauer J. J., 1983, Icarus, 53, 185
- Spitale & Porco (2010) Spitale J. N., Porco C. C., 2010, AJ, 140, 1747
- Starkey et al. (2017) Starkey D. et al., 2017, ApJ, 835, 65
- Starkey et al. (2016) Starkey D. A., Horne K., Villforth C., 2016, MNRAS, 456, 1960
- Sun et al. (2020) Sun M. et al., 2020, ApJ, 902, 7
- Tremaine & Davis (2014) Tremaine S., Davis S. W., 2014, MNRAS, 441, 1408
- Troyer et al. (2016) Troyer J., Starkey D., Cackett E. M., Bentz M. C., Goad M. R., Horne K., Seals J. E., 2016, MNRAS, 456, 4040
- Wanders et al. (1997) Wanders I. et al., 1997, ApJS, 113, 69
- Yuan & Narayan (2014) Yuan F., Narayan R., 2014, ARAA, 52, 529
- Zu et al. (2011) Zu Y., Kochanek C. S., Peterson B. M., 2011, ApJ, 735, 80