Compressive Instabilities Enable Cell-Induced Extreme Densification Patterns in the Fibrous Extracellular Matrix: Discrete Model PredictionsJournal: JMPS
Abstract
Through modelling and simulations we show that material instabilities play a dominant role in the mechanical behavior of the fibrous collagen Extracellular Matrix (ECM), as observed when the ECM is deformed by contractile biological cells. We compare two families of fiber network models, Family 1 with stable and Family 2 with unstable force-stretch response of individual fibers in compression. The latter is a characteristic of post-buckling of beams with hierarchical structure. Our simulations reveal different compression instabilities at play in each family, namely, fiber collapse (buckling) in Family 2 and fiber element collapse (snap-through) in Family 1. These result in highly localized densification zones consisting of strongly aligned fibers emanating from individual contractile cells or joining neighbouring cells, as observed in experiments. Despite substantial differences in the response of the two families, our work underscores the importance of buckling/compression instabilities in the behavior of fibrous biological tissues, with implications in cancer invasion and metastasis.
Keywords:
ECM mechanics , Buckling instability , Compression instability , Cell-Cell communication , Discrete model1 Introduction
Cellular processes constitute a fundamental system of complex cascades of intracellular signalling pathways and biomechanical interactions between cells and their environment. Cells continually remodel the extracellular matrix (ECM) through chemical and mechanical signals [1, 2]. The interplay between cells and the ECM is of great importance as it regulates a number of cellular processes [3, 4], such as cell motility and migration in physiological [5] and pathological [6, 7, 8, 9] conditions, stem cell differentiation [10, 11], as well as cell and tissue morphology [12, 13, 14]. The intrinsic actomyosin machinery enables cells to contract, thereby exerting tractions to the fibrous ECM, which results in the generation of spatial patterns of localized deformation [13, 15, 16, 17, 18]. Although the mechanism for their formation has not been clarified yet, there is sufficient evidence for their implication in intercellular mechanical communication. These patterns are characterized by fiber alignment and severe material densification, localized within tethers that join neighbouring cell assemblies [12, 16], such as tumors. The tethers are densified bands where matrix density can be three to five times higher compared to the rest of the matrix. Cells were spotted to leave their cluster and advance along the axis of the tether towards the neighbouring cluster [12, 16]. In addition, individual cells in collagen induced fiber alignment and network densification along lines connecting them [15], while experiments with isolated fibroblasts reported that cells grew protrusions along the generated tether and towards each other [17]. Moreover, cell-induced ECM remodelling underlies additional facets in tissue biology. Cancer studies have demonstrated the preference of tumor cells to invade along densified regions of ECM [8, 19, 20], while aligned collagen matrix serves as a highway-path which they use in order to migrate [7, 8].
In essence, every tissue component—cells and fibers—is a biomaterial with unique mechanical properties that responds accordingly to physical cues. The mechanical behavior of the ECM is thus attributed to that of its individual fibers. Previous studies [21, 22] revealed the nonlinear elastic behavior of fibers, which explains why cell-induced deformations extend substantially far and are not confined to the cell boundary [17, 23]. This nonlinearity is manifested by strain stiffening in tension [22, 24, 25, 26, 27] and buckling in compression [28, 29, 17, 30]. These effects have been extensively investigated before [17, 31, 32, 33, 34, 35, 36, 37, 38, 39], wherein fibers are modelled as homogeneous beams with stable (monotonically increasing) force-stretch responses. This would seem to suggest that the whole matrix (fiber network) would exhibit stable mechanical behavior. It might come as a surprise that this is actually not true even in the case of linear elastic fibers: in [40] it is shown that the energy of such a network is a nonconvex, multi-well function of nodal displacements, which implies instability. In our recent work [18] instability is also encountered in a continuum model, obtained from orientational averaging of individual fiber response, even when the latter is stable. This model predicts localized densification patterns that bear a strong resemblance with experiments [13, 16].
Rather than homogeneous rods, ECM fibers have a bundlelike morphology characterized by a complex hierarchical structure [27, 41]. This assembly gives rise to unexpected mechanical effects. Subjected to large strains, fibers can be extremely extensible without breaking [41] and they stiffen with increasing tension [25, 26]. Especially interesting is the case when fibers are subjected to compressive forces under which they buckle, losing stiffness and eventually collapsing. Experiments with elastic fiber networks [42] and later on with fibrin [43] revealed multiple regimes of stress-strain response marked by a non-linear softening instability in compression coupled with network densification. Additionally, uniaxial compression experiments on hierarchical beams [44] revealed a transition from hardening (positive slope in stress-strain response) to softening (negative slope) with increasing compression, while they were reversible upon load release. These studies highlight that fiber mechanics is by far more complicated, exhibiting unstable behavior that deviates from what has been addressed so far towards understanding ECM-related deformations.
Considering the above, our objective here is to develop a discrete network model that accounts for the unique intrinsic features of fiber morphology and mechanics and investigate the role of compression instability in deformation patterns associated with ECM densification, tether formation and fiber alignment. We implement two different families of fiber constitutive relations, with distinct nonlinearity and stability features. Family 1 displays a positive but decreasing stiffness with increasing compression, while Family 2 entails a stretch instability phase, where stiffness becomes negative at extreme compressions. Family 1 represents the traditional view of post-buckling behavior. Family 2 is a more radical model, incorporating recent experimental observations on buckling of hierarchical beams [44]. Parts of this work have appeared in [45].
We perform extensive simulations of a fiber network containing one or more contracting circular cells, in the spirit of [17]. Simulations with our Family-2 models predict ECM densification, the formation of experimentally observed densified tethers between pairs of contracting cells and enhanced fiber alignment localized within the tethers. We show that ECM densification and fiber alignment are simultaneous consequences of fiber compression instability inherent in Family 2. These phenomena are stronger and highly localized within more sharply defined zones compared to predictions of previous models with stable stretch response [17, 32, 33, 34, 35, 36, 37, 38, 39]. Surprisingly, densified zones with aligned fibers also appear in Family-1 simulations, albeit with important differences. First, they require much higher levels of cell contraction and second, they reveal a different instability mechanism, namely snap-through buckling of larger fiber groups, such as triangular elements. This distinct compression instability mechanism is also evident in simulations with the linear model and has not been addressed by previous studies involving discrete networks. These observations show that the presence of compression instability is critical and essential for localized densification and fiber alignment.
2 Methods
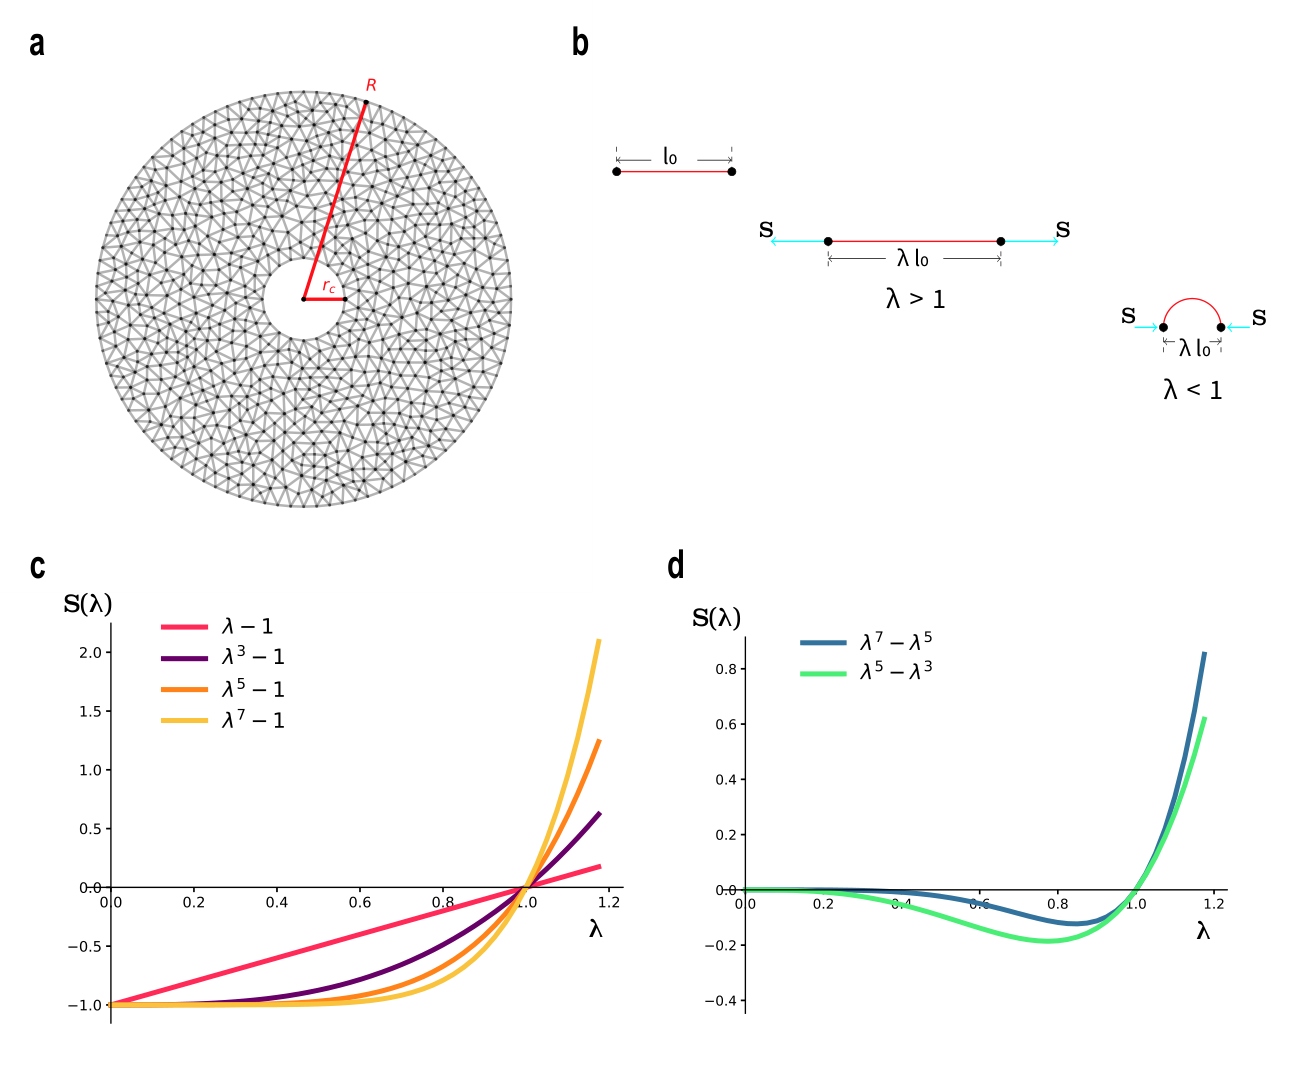
We have developed a 2D discrete model of a fiber network representing the natural ECM to explore its mechanical behavior under cell induced loading. In particular, we partition a circular domain into triangular elements. Each of the three sides of an element represents an individual fiber (Fig.1a). Triangle vertices are the nodes of the network, where fibers terminate, so that fiber length corresponds to the length of the segment between two nodes. The nodes are modeled as movable frictionless hinges with two degrees of freedom. In general, nodal displacements change the length of fibers, which are modelled as nonlinear elastic springs. As a result, the total energy of the network (sum of individual spring energies) is a function of all nodal displacements. This leads to the problem of minimizing the total energy over nodal displacements. This problem is solved numerically using advanced optimization techniques; see Subsection 2.3 below.
2.1 Mechanical properties
For a single fiber, we introduce the effective stretch , which equals the distance between its endpoints divided by its undeformed, or relaxed, length. The energy of a single fiber can be written as as a function of effective stretch . When the fiber is in tension, it is straight and equals the actual stretch (strain +1), while equals the elastic energy due to stretching of the fiber. When the fiber is in compression, it may be buckled, in which case the elastic (mostly bending) energy of the fiber can still be expressed as a function of the distance between its endpoints, hence of the effective stretch . See Fig.1b. In that case is chosen to embody the post-buckling response of the fiber. If the deformed-position vectors of the fiber end points (nodes) are and and the undeformed fiber length is , the energy of the fiber is
| (1) |
the quantity within parentheses above being the effective stretch of the fiber between nodes i and j.
We explore various models of the mechanical behavior of fibers, characterized by the force-stretch relation of a single fiber , where
| (2) |
is the fiber force, nondimensionalized after dividing by a coefficient with dimensions of force. These models were designed to capture fiber stiffening in tension [25, 26], but also softening in compression due to buckling [17, 31, 18]. For direct observation of buckled fibers in collagen networks see [28, 30]. We introduce two families of models. Family 1, shown in Fig.1c,
| (3) |
which includes the linear case (k=1) and Family 2 shown in Fig.1d:
| (4) |
While for all models there is stiffening in tension (except for the linear one ), the difference between the two constitutive families is in compression. In all nonlinear models in Family 1, force and stiffness both increase monotonically with increasing stretch (Fig.1c). However, stiffness decreases monotonically with compression (as decreases to zero) until it vanishes in the crushing limit , whereas force reaches a plateau where it remains approximately constant as . Models differ in how abrupt the loss of stiffness is and at which level of compressive stretch it occurs. Thus Family-1 fibers can sustain a limited amount of compressive force even after buckling. See also [18] where similar fiber behavior is used to derive a continuum model. In contrast [17] use a bilinear model with piecewise constant stiffness that is lower in compression. Loss of stiffness in Family-1 type force response is intended to model the post buckling behavior (load versus distance between ends) of nonlinear elastic bars in compression by axial loads in the context of large deformations. Family-1 behaviour is consistent with experiments and simulations of post-buckling in certain homogeneous nonlinear elastic beams [46].
Actual ECM fibers are far from homogeneous, but exhibit a bundle-like morphology with a complex hierarchical structure [27, 41]. This gives rise to unexpected mechanical effects. In a recent study [44] with hierarchical beams, uniaxial compression experiments revealed a post-buckling response where the force-stretch relation changes from positive to negative stiffness (slope) for high enough compression. This also occurs in beams composed of metamaterials [46]. Family-2 models were designed to capture this instability (Fig.1d). Stiffness decreases monotonically with decreasing as the fiber initially resists the compressive load, after which stiffness becomes negative with further compression, entering a compression instability regime (negative stiffness) up to final collapse as .
Suppose one of the models from (3) or (4) has been chosen. The corresponding elastic energy of a fiber is then given by
| (5) |
with a minimum at when the fiber is unstretched. Let be the stretch of fiber j, where j = 1,2,…, F and F is the total number of fibers in the network. Therefore, the total fiber network strain energy is equal to
| (6) |
Here F is the number of fibers, N the number of nodes and if there is a fiber joining nodes i and j, 0 otherwise.
2.2 Nonconvexity and Instability
Our initial attempt is to impose displacements or applied forces on boundary nodes of the network and minimize the total network energy with respect to all positions of interior nodes . However, allowing for large contractile deformations can result in nonphysical solutions due to interpenetration of matter. This happens when triangular elements fold over and snap through to the other side, as there is no resistance against fibers crossing through each other in the model. Examples are shown in Supplementary SFig.1I. This is an instance of the well-known snapthrough instability of structural mechanics, e.g., [47] and shows that the energy is nonconvex and likely to have multiple local minima, as well as unstable extrema, even in the case of the linear fiber model () as schematically shown in Fig.2a,b. This and other instabilities also occur in a regular (lattice) network of linear springs [40].
Solutions with snapthrough involve interpenetration of matter and orientation reversal, which are both physically unacceptable. In order to exclude such solutions, an energy penalty term is introduced that resists any two fibers with a node in common from crushing into each other. That would be equivalent to the oriented area of the associated triangular element going to zero, then becoming negative with orientation reversal. Interpolating the deformation from nodes to the entire domain in a piecewise affine way (continuous overall and linear in each triangle), we define to be the Jacobian determinant of the deformation. Hence is piecewise constant and equal to the ratio of deformed to undeformed oriented triangle area. Letting x and z be two undeformed vector sides of a triangle, and , be the deformed sides, we have
| (7) |
in terms of the vector product, where k is the out-of-plane vector. Negative denotes orientation reversal of the respective elements, i.e. folding over and interpenetration of matter. The penalty term is chosen as a function of ,
| (8) |
where is a small constant and is large (Supplementary SFig.1II, we usually choose Q=50 and b=1/4). Thus is very small for and becomes very large for . Thus it serves in maintaining positive orientation in the network, as negative orientation is costly in energy. For elements with positive area ratio, is very small, thereby having essentially no contribution to the network’s total energy. Physically it corresponds to fibers (which actually have nonzero thickness) resisting being crushed together when network elements are close to collapsing. The modified network potential energy has the form:
| (9) |
where is the total number of fibers in the network, the total number of elements, the potential energy of an individual fiber, the reference area that element occupies and its oriented area ratio. Even after modifying the energy by adding the penalty term, instabilities due to nonconvexity are still present. We identify some instability modes next:
Nonconvexity due to Large Rotations
Even if the single fiber energy from (5) is strictly convex with a minimum at , the corresponding energy in (1) is a nonconvex function of nodal positions because of rotational invariance (Fig.4 in [40]). This is a source of nonconvexity of the total energy , that is typically entirely missed when small rotations are assumed [40].
Element Collapse Instability
Before an element undergoes snapthrough (its oriented area changes signs) it buckles, or collapses, when a node touches the opposite side. This is actually an unstable equilibrium of the triangle energy which is thus a nonconvex function of element oriented area ratio . Compressing an element triangle along its height keeping its base fixed (Fig.2a), we observe that the energy of the triangle as a function is minimal and vanishes at and at (Fig.2b) after the triangle has snapped through to its mirror image. Since is odd it must be nonconvex with an unstable equilibrium at . In our model, such total collapse is prevented by the penalty term , but bistability and noncovexity of the penalized energy remains (Fig.2c), with an additional, highly compressed solution for some values of compressive force (Fig.2d). This occurs in both model Families, even in the linear model; it is an example of the well-known snapthrough instability of structural mechanics, e.g., [47]. In order to identify this instability mode in our simulations we define the densification ratio of each triangular element to be the ratio of deformed to reference density of a hypothetical continuum deforming as the triangle. This gives
| (10) |
Fiber Collapse Instability
In Family-2 networks there is an additional instability: when a fiber is compressed past the point where the slope of the curve becomes negative (Fig.1d), it enters an unstable regime, tending to collapse to zero effective stretch. For example, the unstable regime for () is .
Clearly, fiber collapse would imply area collapse of any element (triangle) with this fiber as a side (Fig.2e). Eventually the penalty term (8),(9) restabilizes the element against total collapse. An unstable regime remains in general, rendering fiber compression response essentially biphasic, similar to Fig.2d.
To summarize, all fiber networks are susceptible to element collapse (triangle buckling) instability. Family-2 networks suffer from an additional fiber collapse instability brought about by total loss of strength due to buckling of hierarchical fibers. Simple geometry shows that fiber collapse implies element collapse (Fig.2e), but not vice versa (Fig.2f).
2.3 Formulation, Software and statistical analysis
By expressing stretches and Jacobians in terms of variable nodal positions , , we express the total energy in (9) as a function of nodal positions. See (6) for the first term. We then perform energy minimization on .
The discrete model has been implemented in Python [48]. The triangulation has been implemented in FEniCS [49] and the optimization method (for finding energy minima) is explained in [18]. The statistical analysis has been done in R [50] and for multi-group comparisons we used one-way analysis of variance (ANOVA).
2.4 Model Geometry
Cells are modelled as circular cavities of radius within the domain of outside radius . Thus, the domain containing the ECM network is an annulus with , where is the radial distance from the domain center and x is the position vector. In particular, we model contractile cells. We simulate contraction by prescribing an inward radial displacement of cell boundary nodes given by:
| (11) |
for nodes with position vector x such that . Simulations with two cells involve two distinct cavities with contractile displacement applied on the boundary of each. The outer boundary of the network is free (no applied forces or prescribed displacements) in all simulations.

3 Results
3.1 Single-cell simulations
3.1.1 Severe localized densification patterns are observed in Family-2 models, moderate ones for Family 1
We simulate a single cell contracting within a fibrous network for each one of the models introduced in (3), (4). Simulations at cell contraction exhibit patterns of highly localized, severe densification shown in Fig.3a-c, SFig.2a-c. These patterns take the form of bands, emanating from the periphery of the contracting cell into the surrounding matrix. Plotting the densification ratio of each element versus distance from the cell shows that in Family-2 models, highly densified elements have densification ratio and reach up to six cell radii into the ECM (Fig.3c). In contrast, Family-1 densified triangles are confined within two cell radii (Fig.3a,b), with densification ratio at most .
The distribution of fiber stretches within the deformed networks illustrates similarities and differences between models (Fig.3d-k, SFig.2). Fibers under tension () align roughly with the radial direction, forming continual paths that propagate a few cell diameters into the matrix (Fig.3d-f, SFig.2d-f). This happens regardless of the model, though in Family-2 simulations the paths extend further into the matrix (Fig.3f, SFig.2f). When it comes to compressed fibers, things differ significantly between models (Fig.3g-k, SFig.2g-k). Fibers under compression () are oriented close to the angular direction, forming loops around the cell (Fig.3g-k). Within each of these loops, and close to the cell boundary, the stretch is nearly uniform for Family-1 models (Fig.3g,h). Similar behavior is seen in [39, Fig.6].
Simulations with Family 2 exhibit two differences: the distribution of compressive stretch around the cell is strongly inhomogeneous (Fig.3k), and the maximum compression is up to twice as high as in Family-1 simulations, compressive strain (or stretch 0.4) compared to ( 0.7) for Family 1 (colorbars in Fig.3g-k and SFig.2g-k). Compressed Family-2 fibers are still roughly in the angular direction. The most compressed fibers occur within narrow bands emanating radially from the cell and reaching as far as 6 deformed cell radii into the matrix (Fig.3k,m, SFig.2k,n). Furthermore, in Family 2, network triangles comprising the densified bands are excessively compressed (Fig.3m), as they contain fibers that have nearly collapsed. Fibers under tension are aligned along the axis of densification bands, roughly perpendicular to fibers under compression (Fig.3n). When the densification ratio of the networks in Fig.3c is compared to the compressed fiber distribution of Fig.3k, it becomes clear that regions of localized excessive densification () coincide with the bands containing severely compressed fibers (Fig.3c,k-n, SFig.2c,k).
In Family-1 simulations, severe compressive stretch is not observed at contraction level, with remaining above 0.7, compared to 0.4 for Family 2. Densified zones are much shorter and confined to the immediate vicinity of the cell (Fig.3a,b, SFig.2a,b) with triangles less compressed ( at most 2 compared to 3 for Family-2).

Colorbars: (a-c) densification ratio of the deformed networks, (d-k) fiber stretch .
3.1.2 Comparing critical levels for densification pattern formation in the two model families
Since the main difference between the two model families is the unstable compression regime in Family-2 models, where the curve has negative slope (Fig.1d), the results of 3.1.1 suggest that fiber collapse instability is responsible for the sudden growth of localized densification bands. In order to test this hypothesis, we simulate network response under gradual cell contraction, to study the onset of densified band formation.
Fig.4a-e shows a Family-2 network with a cell contracting at five consecutive levels, from to reduction of cell initial radius. Initially, as contraction progresses, the densification ratio of essentially the same few triangles proximal to the cell increases linearly with cell contraction (Fig.4,a-d) up to . Remarkably, at the next level of () contraction, densified bands around the contracting cell have appeared, extending noticeably further into the matrix (Fig.4e). Below each plot of Fig.4a-e, in a "tree diagram", we plot the stretch of each individual fiber (abscissa) versus distance from the cell center (ordinate) for each contraction level; color indicates orientation relative to the radial direction. The evident asymmetry near the base of each tree at larger contractions shows the difference of compressive versus tensile stretches. Tensile stretches grow gradually with increasing contraction. In fibers under compression (), the stretch first decreases slowly, with only a few fibers in the unstable regime (red dotted line), all of whom are close to the cell up to contraction. At there is a steep increase in the number of fibers below the threshold, with stretches down to 0.4 and reaching more than 6 cell radii into the network by contraction. Going back to the respective densification ratio configurations, we observe that the jump in fiber compressive stretch and the abrupt appearance of densified bands occur at the same contraction level between and .
This trend in densification localization is reflected in plots of the maximum over the network of the densification ratio inverse , and the minimum stretch , at each contraction level (Fig.4f). We note that , the minimum area ratio, corresponding to the most compressed triangular element. The densification ratio first increases slowly with contraction, then there is a steep rise between 35 and contraction, the level at which extensive localized densification is spotted (Fig.4e). The minimum fiber stretch follows exactly the same behavior as , the two curves in Fig.4f being nearly identical. Initially, decreases approximately linearly with contraction, namely the minimum stretch occurs at the cell boundary as dictated by the boundary conditions
| (12) |
with the fractional cell diameter decrease. Then there is a sudden drop in stretch magnitude at contraction, exactly the level of sudden drop in Fig.4f and band growth in Fig.4e. This shows that element densification is driven by fiber collapse as explained in Fig.2e. We recall also Fig.3m showing a collapsed red fiber within each densified green triangle (See Methods 2.2, Fiber collapse instability)
The behaviour of Family-1 networks is different (Fig.4g, SFig.3, SFig.4). The minimal stretch follows (12) all the way up to the largest simulated contraction (red line in Fig.4g), occurs on the cell boundary, and is equal to cell boundary contraction prescribed by boundary conditions. This shows that fiber collapse is not observed, as expected. In contrast, the maximal densification ratio does undergo a sudden leap ( drop in Fig.4g) as in Family-2 models, albeit at a higher contraction level of . This is evidence of an element collapse instability (See Methods 2.2) that is weaker and requires higher cell contraction than the fiber collapse instability of Family-2 models. Notably, this instability occurs in the linear fiber model (SFig.3) as well as the nonlinear ones (SFig.4).

Colorbars: Densification ratio and fiber radial orientation (in degrees).
3.2 Intercellular tether formation in two-cell simulations
We report on simulations involving a pair of cells contracting at of their initial radius, separated by either or , where is the cell radius (Fig.5, SFig.5, SFig.6). What distinguishes these from singe-cell simulations is the spontaneous appearance of intercellular tethers, composed of thin, roughly parallel bands of high densification and fiber alignment, that connect the two cells (Fig.5c, SFig.5c). When cells are separated by a larger distance, , tethers are generated only with Family-2 models. Additional densified bands emanate radially from each cell (Fig.5c, SFig.5c) as before. In contrast, in Family-1 simulations, matrix densification is limited close to the cell boundary and cells remain isolated and disconnected (Fig.5a,b, SFig.5a,b). When cells are closer together, tethers are generated by all models, even the linear one (SFig.6). In this case, we observe that they are substantially stronger in Family-2 simulations, as they extend from one cell to the other and are noticeably wider compared to Family-1 tethers (SFig.6a-c).
When tethers form, we observe a fraction of fibers, located almost entirely in the intercellular region, to be highly stretched (SFig.6d-f). These fibers are densely packed and aligned with the horizontal direction passing through the cell centers, generating straight paths of fibers connecting the two cells. These paths comprise the tether. At the same time, fibers under extreme compression occupy the same region as the tensile ones, but their orientation is nearly perpendicular to the paths of the tensed and aligned fibers (SFig.6g-k). This is true for all models, though fiber compression magnitude is almost twice as large with Family 2, reaching approximately compression (SFig.6k). This indicates that in Family-2 tethers, compressed fibers are well within the regime of the fiber collapse instability. In addition, we observe highly compressed fibers within the densified bands that emanate radially from the cell periphery (SFig.6k).
When cells are separated by a greater distance, , and tethers are generated only with Family-2 models, fiber stretches highlight a significant difference between families (Fig.5d-k, SFig.5d-k). In Family-2 simulations, fiber distributions and orientations within the tether are the same as for shorter distances (Fig.5f,m, SFig.5f,k). For Family-1 models, this is no longer true, as the fiber paths are disrupted and tensile stretches are distributed in a broader region between cells, without the strong alignment we have with Family-2 models (Fig.5d,e, SFig.5d,e). This is reflected in angle distributions of the tensile fiber orientation, which are substantially different across models within the intercellular region (SFig.5m). This distribution is more localised for Family-2 models, consistent with greater alignment.
Excessively tensed fiber angles within the densified region are narrowly distributed about zero (horizontal direction through cell centers) (Fig.5m). Compressed fibers are distributed about within the densified region, compared to a uniform distribution in non-densified regions (Fig.5m). On the contrary, compressive stretches in Family-1 models are confined to concentric loops around each individual cell instead of the region between cells, and oriented in the circumferential direction (Fig.5g,h, SFig.5g,h).
The previous findings hold for contraction. When cells contract more, tethers are eventually generated for Family-1 models as well. In Fig.6 we present the case of Family-1 model (eq. (3), Fig.1c) with two cells separated by at four contraction levels and . We observe that densification between the two cells progressively strengthens. Fiber compression in the cell-cell vicinity is ever-increasing with contraction level, resulting finally in a solid tether at contraction (Fig.6d).
Working in the same manner for each model separately, we have tested different contraction levels ranging from to decrease in cell radii, for multiple distances separating the two cells. Results are summarized in Fig.6e. In particular, for each model we obtain a curve that indicates the minimum contraction cells should undergo to produce a tether, expressed as a function of cell distance. That is, above each curve a tether is predicted to form for the respective model. Clearly, Family-2 models are able to sustain tether formation for moderate contraction levels , and for relatively large cell-cell distances (up to ). On the contrary, regarding Family-1 models for the same contraction levels , a full tether is formed when cells have a distance at most .
What are the mechanisms responsible for the differences between tethers in the two Family models? Extremely compressed fibers occur in Family-2 tethers () but not in Family 1, where (Fig.7a,b). In Family 2, fiber collapse (extreme fiber compression, sudden drop in Fig.7b) occurs at the same time as extreme densification (sudden drop , Fig.7b). On the contrary, in Family 1, we see extreme densification without fiber collapse (Fig.7a). In Family 2, most collapsed triangles within the tether contain a highly compressed fiber, oriented within of the vertical (Fig.7d as in Fig2e). In contrast, in Family-1, collapsed triangles have nearly horizontal bases, while the other two sides are under moderate compression, and are closer to horizontal than vertical after collapse (Fig.7c as in Fig.2f). These findings indicate that fiber collapse instability is the main player in Family-2 tethers, whereas the dominant role in Family-1 tethers is played by element (triangle) collapse instability.

Colorbars: (a-c) densification ratio of the deformed networks, (d-k) fiber stretch.


4 Discussion
Extracellular Matrix (ECM) mechanical remodelling by cellular forces brings about unique deformation patterns of excessive matrix densification and fiber alignment, both playing a central role in intercellular communication [12, 13, 15, 17] and in cell motility and invasion [8, 20]. In order to explore this type of cell-induced ECM deformations, we develop a discrete model that accounts for individual fibers and their intrinsic mechanics. The discrete fiber network model featured in this study complements our prior work [18] where we demonstrated through continuum modelling and experiments that the aforementioned phenomena are the result of a material instability. The latter is caused by a special nonlinearity due to fiber buckling under compression. To understand how discreteness affects these results, here we implement two different families of fiber constitutive relations, with distinct nonlinearity and stability features. Family 1 displays a positive but decreasing stiffness with increasing compression, while Family 2 entails a stretch instability phase, where stiffness becomes negative at extreme compressions. Family 1 represents the traditional view of post-buckling behavior. Family 2 is a more radical model, incorporating recent experimental observations on buckling of hierarchical beams [44].
Our simulations results have revealed instability mechanisms that have not been identified in previous work. In particular, all nonlinear spring networks are susceptible to element collapse (triangle buckling) instability; see Methods. This includes linear spring networks provided large rotations are accounted for [47]. In Family-2 networks, an additional fiber collapse instability occurs because of total loss of strength due to buckling of fibers in compression (Methods). Simple geometry shows that fiber collapse implies element collapse (Fig.2e), but not vice versa. Thus both instabilities can occur in Family-2 networks. In contrast, Family-1 networks can undergo element collapse, despite the fact that individual fibers exhibit stable behavior. The distinction of these different instabilities is an effect of discreteness and is not captured by continuum models, including ones that allow instability [18].
In Family-2 models we observe a sudden increase in densification simultaneously with abrupt fiber collapse, both in single and two-cell simulations (Fig.4f and Fig.7b). The majority of the elements in the densified regions contains a severely compressed fiber (red fibers in Fig.7d). This is strong evidence that the mechanism behind densification in Family-2 networks is fiber collapse instability (Methods and Fig.2e), driven by cell compression. Densification also occurs in Family-1 networks, but requires higher levels of cell compression. Fiber collapse is not encountered in this case (Fig.4g and Fig.7a). Instead, densification is due to triangular elements collapsing (Fig.7c). Element collapse instability (Methods and Fig.2f) is the main player behind the appearance of densified zones in Family-1 networks. These observations apply both to intercellular tethers and densified zones around single cells.
One important finding concerns fiber alignment. Regardless of the model, simulations show that fiber excessive alignment occurs simultaneously with densification and at the same locations in the ECM, both in single and two-cell cases (Fig.3, Fig.5). In particular, in Family 1 we see that severe element compression forces all sides of the densified triangles to align with each other (Fig.7c), a direct effect of element collapse instability (Fig.2f). Especially in two-cell cases, before tethers form we observe a moderate tendency of fibers to align (Fig.6a,b). After tethers form, fibers within the tethers are aligned almost perfectly (Fig.6d) and the elements they belong to are the ones that show extreme densification. In Family-2 tethers and bands, we see the stretched sides of the densified elements aligned with each other while the highly compressed one is roughly perpendicular to them (Fig.3m, Fig.7d), evidence that fiber collapse instability brings about the alignment of stretched fibers within the densified regions. These significant observations indicate that ECM compression instabilities are responsible for both matrix densification and fiber alignment.
In general it is much easier to form a tether with Family-2 models than with Family-1. For the same distance between two cells, a Family-1 tether requires a much higher compression in order to form. For example, for a distance , where is cell radius, the linear model requires compression whereas is sufficient with (Fig.6e). Given a level of compression, say , a Family-1 tether is formed when cells are very close, less than . On the contrary, a Family-2 tether can form when cells are more than twice as far away from each other (Fig.6e).
Our most prominent prediction is the formation of densified tethers between two cells, and densified radial bands emanating from each cell. Zones of high densification (tethers) have been observed experimentally joining two clusters of contractile cells [12] [13] [16] [51] while thinner bands were seen to emerge from each cluster [12] [13], extending and gradually diminishing within the matrix. Densified tethers and radial bands were also observed in [18] where contracting active particles were used in place of living cells, thereby excluding non-mechanical causes behind densification. Fibers within the tethers are highly aligned along the tether axis. Individual cells from each explant [12] [13] or acinus [16] start migrating along the tether in an attempt to reach the neighbouring cluster. Moreover, isolated fibroblasts grew protrusions towards each other, along the tether that formed following their contraction [17]. These studies illustrate the significance of tethers and radial bands in cell migration, motility and intercellular communication. Our simulations identify the formation of these densified zones as a direct consequence of compression instabilities. An additional effect of these instabilities is the close alignment of fibers within the densified zones. Alignment and densification are therefore seen to be part of the same mechanism.
The most essential application of this work is cancer invasion and metastasis. Tumor explants cultured in an initially randomly organized matrix aligned the collagen fibers around them by contracting. This allowed individual cancer cells to use the tracts of aligned fibers as highway paths to invade the ECM [7] [8]. In fact, both densification [52] and fiber alignment [7] are considered prognostic biomarkers for breast carcinoma [53], specifically, “bundles of straightened and aligned collagen fibers that are oriented perpendicular to the tumor boundary” [53]. Contractility is a necessary ingredient in their formation [8]. All these observations apply to both tethers and radial densified bands. A different phenomenon is seen in expanding tumors where the densified layer surrounding them consists of fibers parallel (not perpendicular) to their boundary [53]. Remarkably, our simulations of an expanding cell confirm this, see Supplementary Material, SFig.7. Additionally, aligned collagen fibers offer biochemical molecules transportation between cells [54]. Focusing on the elevated fiber alignment within the tethers, our predictions highlight the contribution of compression instability to cancer related ECM mechanisms.
Family-2 models (unstable stretch responses) result in well-defined tethers with highly localised densification and fiber alignment very close to the tether axis. These results are in qualitative agreement with experiments [13, 16, 18]. On the contrary, in models with stable stretch response (Family 1) tethers are diffused and not localized, while fibers under tension distribute in the broader intercellular region. In addition, tethers with Family 2 occur under experimentally observed physiological levels of cell contraction [16, 17, 18], in contrast to Family 1 where extreme contraction is required. Considering the above, Family-2 models are preferable over Family-1 as they describe experimental observations better. The unstable response of Family-2 fibers is justified by recent work [44] on post-buckling behavior of beams with hierarchical structure, such as ECM fibers [27] (see Methods).
There have been considerable efforts in ECM modelling [17, 31, 32, 33, 34, 35, 36, 37, 39, 38]. In these studies, ECM fibers are usually modelled as Timoshenko beams [32, 36] or as elements with asymmetric elastic responses to extension and compression, obeying either piecewise linear stress-strain curves or combining strain-stiffening with compression softening intended to model fiber buckling [17, 31, 34, 37, 39, 35, 38]. Even though these approaches have explored nonlinear aspects of fiber behavior, they are limited by stable stretch responses (monotonic) and sometimes small deformations. As far as the stretch response is concerned, all these models are similar in spirit to our Family-1 models. None of these works address instability. Here, we recognise that instability plays a central role in the appearance of ECM densification and fiber alignment. Our work shows that instability can occur even in models with stable stretch response (Family 1), but it does so at unreasonably high cell contraction levels. This prompts us to introduce models (Family 2) whose stretch response becomes unstable in compression. This particular instability allows tether formation and fiber alignment under experimentally observed cell contraction levels.
Fiber alignment has been explored by previous studies [37],[39], yet as a separate ECM mechanism involved together with compression buckling in intercellular force transmission [37] or matrix elastic anisotropy [39]. Sopher et al., [37] suggest that elevated tension in the intercellular region obliges fibers to stretch and align. In our simulations densification and fiber alignment suddenly jump to much higher values compared to aforementioned works. This transition occurs when a compression instability is activated. For models with stable stretch response (Family 1), this would occur in much higher contraction levels than considered in previous works [17, 31, 34, 37, 39, 35, 38], which explains the lower levels of densification and alignment observed there. Family-2 models not only require moderate cell contraction, but also densification is much stronger, tethers are solid and substantially wider and fibers almost perfectly aligned to the tether axis.
Deformation induced anisotropy has been studied [39] as a possible mechanism for long-range cell communication. We remark that the compressive instabilities studied here create strong anisotropy in the densified state of the network, because they create a strongly aligned and dense uniaxial distribution of fibers from an originally roughly isotropic random fiber distribution. Our results show that there is a single unifying mechanism behind densification, fiber alignment and matrix anisotropy, and this is compression instability. These phenomena occur simultaneously within the same localized zones as soon as compression instability is triggered either due to fiber buckling (collapse) or element collapse (snapthrough buckling).
Compression instability due to buckling of elastic fibers in networks was first identified in [42] as a mechanism of localized densification. The continuum model of [55, 18], obtained from a fiber model through orientational averaging, also exhibits a compression instability, and predicts highly localized densified tethers and radial bands. Their morphology is qualitatively similar to the ones reported here. In general, it is practically impossible to obtain an explicit continuum constitutive law for a random network through a rigorous limit as the fiber length approaches zero [56, 40]. The advantage of our model is that it captures the discrete nature of the actual fibrous network. As a result it can distinguish between different types of compression instabilities (buckling of fibers versus fiber elements) and it clarifies the close connection of instability with fiber alignment and densification.
Possible extensions of our work include three-dimensional network models, more sophisticated modelling of joints and crosslinking between fibers, viscoelastic effects in fiber behavior, and the possibility of larger scale instabilities in analogy with periodic discrete networks [40, 57].
Our models highlight compression instability due to buckling as a crucial nonlinear mechanism underlying the mechanical behavior of fibrous ECM and give rise to new insights in exploring the nature of cell-induced deformations that underlie matrix densification and fiber alignment and their implications in intercellular biomechanical interaction, cancer metastasis and cell motility.
Competing interests.
We declare we have no competing interests.
Funding. This work was financially supported by Fonds National de la Recherche (FNR), Luxembourg through AFR PhD programme (AFR2020/14582656) and under the PRIDE programme (PRIDE17/12252781, DTU DRIVEN). Georgios Grekas was partially supported by the Vannevar Bush postdoctoral fellowship.
References
- Lu et al. [2011] P. Lu, K. Takai, V. M. Weaver, Z. Werb, Extracellular matrix degradation and remodeling in development and disease, Cold Spring Harbor Perspectives in Biology 3 (2011).
- Winkler et al. [2020] J. Winkler, A. Abisoye-Ogunniyan, K. J. Metcalf, Z. Werb, Concepts of extracellular matrix remodelling in tumour progression and metastasis, Nature Communications 11 (2020) 5120.
- Discher et al. [2005] D. E. Discher, P. Janmey, Y.-L. Wang, Tissue Cells Feel and Respond to the Stiffness of Their Substrate, Science 310 (2005) 1139–1143.
- Peyton et al. [2007] S. R. Peyton, Æ. C. M. Ghajar, C. B. Khatiwala, Æ. A. J. Putnam, The emergence of ECM mechanics and cytoskeletal tension as important regulators of cell function, Cell Biochemistry and Biophysics (2007) 300–320.
- Lo et al. [2000] C. M. Lo, H. B. Wang, M. Dembo, Y. L. Wang, Cell movement is guided by the rigidity of the substrate, Biophysical Journal 79 (2000) 144–152.
- Wells [2005] R. G. Wells, The Role of Matrix Stiffness in Hepatic Stellate Cell Activation and Liver Fibrosis, Journal of Clinical Gastroenterology 39 (2005).
- Provenzano et al. [2006] P. P. Provenzano, K. W. Eliceiri, J. M. Campbell, D. R. Inman, J. G. White, P. J. Keely, Collagen reorganization at the tumor-stromal interface facilitates local invasion, BMC MED (2006) 1–15.
- Provenzano et al. [2008] P. P. Provenzano, D. R. Inman, K. W. Eliceiri, S. M. Trier, P. J. Keely, Contact guidance mediated three-dimensional cell migration is regulated by Rho/ROCK-dependent matrix reorganization, Biophysical Journal 95 (2008) 5374–5384.
- Riching et al. [2014] K. Riching, B. L. Cox, M. Salick, C. Pehlke, A. Riching, S. M. Ponik, B. Bass, W. Crone, Y. Jiang, A. M. Weaver, K. Eliceiri, P. Keely, 3D Collagen Alignment Limits Protrusions to Enhance Breast Cancer Cell Persistence, Biophysical Journal 107 (2014) 2546–2558.
- Engler et al. [2007] A. J. Engler, F. Rehfeldt, S. Sen, D. E. Discher, Microtissue Elasticity: Measurements by Atomic Force Microscopy and Its Influence on Cell Differentiation, in: Cell Mechanics, volume 83 of Methods in Cell Biology, Academic Press, 2007, pp. 521–545. ISSN: 0091-679X.
- Gattazzo et al. [2014] F. Gattazzo, A. Urciuolo, P. Bonaldo, Biochimica et Biophysica Acta Extracellular matrix : A dynamic microenvironment for stem cell niche, BBA - General Subjects 1840 (2014) 2506–2519.
- Harris et al. [1981] A. K. Harris, D. Stopak, P. Wild, Fibroblast traction as a mechanism for collagen morphogenesis, Nature 290 (1981) 249–251.
- Stopak and Harris [1982] D. Stopak, A. K. Harris, Connective tissue morphogenesis by fibroblast traction: I. tissue culture observations, Developmental Biology 90 (1982) 383–398.
- Yeung et al. [2005] T. Yeung, P. C. Georges, L. A. Flanagan, B. Marg, M. Ortiz, M. Funaki, N. Zahir, W. Ming, V. Weaver, P. A. Janmey, Effects of Substrate Stiffness on Cell Morphology , Cytoskeletal Structure , and Adhesion, Cell Motility and the Cytoskeleton 34 (2005) 24–34.
- Vader et al. [2009] D. Vader, A. Kabla, D. Weitz, L. Mahadevan, Strain-Induced Alignment in Collagen Gels, PLoS ONE 4 (2009).
- Shi et al. [2014] Q. Shi, R. P. Ghosh, H. Engelke, C. H. Rycroft, L. Cassereau, J. A. Sethian, V. M. Weaver, J. T. Liphardt, Rapid disorganization of mechanically interacting systems of mammary acini, Proceedings of the National Academy of Sciences 111 (2014) 658–663.
- Notbohm et al. [2015] J. Notbohm, A. Lesman, P. Rosakis, D. A. Tirrell, G. Ravichandran, Microbuckling of fibrin provides a mechanism for cell mechanosensing, J. R. Soc. Interface (2015).
- Grekas et al. [2021] G. Grekas, M. Proestaki, P. Rosakis, J. Notbohm, C. Makridakis, G. Ravichandran, Cells exploit a phase transition to mechanically remodel the fibrous extracellular matrix, J. R. Soc. Interface (2021).
- Yu et al. [2011] H. Yu, J. K. Mouw, V. M. Weaver, Forcing form and function: Biomechanical regulation of tumor evolution, 2011.
- Ferruzzi et al. [2019] J. Ferruzzi, M. Sun, A. Gkousioudi, A. Pilvar, D. Roblyer, Y. Zhang, M. H. Zaman, Compressive Remodeling Alters Fluid Transport Properties of Collagen Networks – Implications for Tumor Growth, Scientific Reports 9 (2019) 17151.
- Janmey et al. [2007] P. A. Janmey, M. E. M. C. Cormick, S. Rammensee, J. L. Leight, P. C. Georges, F. C. M. A. C. Kintosh, Negative normal stress in semiflexible biopolymer gels, Nature Materials 6 (2007) 4–7.
- Wen and Janmey [2013] Q. Wen, P. A. Janmey, Effects of non-linearity on cell – ECM interactions, Experimental Cell Research 319 (2013) 2481–2489.
- Rudnicki et al. [2013] M. S. Rudnicki, H. A. Cirka, M. Aghvami, E. A. Sander, Q. Wen, K. L. Billiar, Nonlinear strain stiffening is not sufficient to explain how far cells can feel on fibrous protein gels, Biophysical Journal 105 (2013) 11–20.
- Storm et al. [2005] C. Storm, J. J. Pastore, F. C. MacKintosh, T. C. Lubensky, P. A. Janmey, Nonlinear elasticity in biological gels, Nature 435 (2005) 191–194.
- van der Rijt et al. [2006] J. A. J. van der Rijt, K. O. van der Werf, M. L. Bennink, P. J. Dijkstra, J. Feijen, Micromechanical testing of individual collagen fibrils, Macromolecular Bioscience 6 (2006) 697–702.
- Hudson et al. [2010] N. E. Hudson, J. R. Houser, E. T. O’Brien, R. M. Taylor, R. Superfine, S. Lord, M. R. Falvo, Stiffening of individual fibrin fibers equitably distributes strain and strengthens networks, Biophysical Journal 98 (2010) 1632–1640.
- Piechocka et al. [2010] I. K. Piechocka, R. G. Bacabac, M. Potters, F. C. Mackintosh, G. H. Koenderink, Structural Hierarchy Governs Fibrin Gel Mechanics, Biophysj 98 (2010) 2281–2289.
- Münster et al. [2013] S. Münster, L. M. Jawerth, B. A. Leslie, J. I. Weitz, B. Fabry, D. A. Weitz, Strain history dependence of the nonlinear stress response of fibrin and collagen networks, Proceedings of the National Academy of Sciences 110 (2013) 12197–12202.
- Kim et al. [2014] O. V. Kim, R. I. Litvinov, J. W. Weisel, M. S. Alber, Biomaterials Structural basis for the nonlinear mechanics of fi brin networks under compression, Biomaterials 35 (2014) 6739–6749.
- Burkel and Notbohm [2017] B. Burkel, J. Notbohm, Mechanical response of collagen networks to nonuniform microscale loads, Soft Matter 13 (2017) 5749–5758.
- Rosakis et al. [2015] P. Rosakis, J. Notbohm, G. Ravichandran, Journal of the Mechanics and Physics of Solids A model for compression-weakening materials and the elastic fields due to contractile cells, Journal of the Mechanics and Physics of Solids 85 (2015) 16–32.
- Abhilash et al. [2014] A. S. Abhilash, B. M. Baker, B. Trappmann, C. S. Chen, V. B. Shenoy, Remodeling of fibrous extracellular matrices by contractile cells: Predictions from discrete fiber network simulations, Biophysical Journal 107 (2014) 1829–1840.
- Ronceray et al. [2016] P. Ronceray, C. P. Broedersz, M. Lenz, Fiber networks amplify active stress, Proceedings of the National Academy of Sciences 113 (2016) 2827–2832.
- Xu and Safran [2015] X. Xu, S. A. Safran, Nonlinearities of biopolymer gels increase the range of force transmission, Phys. Rev. E 032728 (2015) 1–10.
- Liang et al. [2016] L. Liang, C. Jones, S. Chen, B. Sun, Y. Jiao, Heterogeneous force network in 3d cellularized collagen networks, Physical Biology 13 (2016) 066001.
- Grimmer and Notbohm [2018] P. Grimmer, J. Notbohm, Displacement Propagation in Fibrous Networks Due to Local Contraction, Journal of Biomechanical Engineering 140 (2018).
- Sopher et al. [2018] R. S. Sopher, H. Tokash, S. Natan, M. Sharabi, O. Shelah, O. Tchaicheeyan, A. Lesman, Nonlinear Elasticity of the ECM Fibers Facilitates Efficient Intercellular Communication, Biophysj 115 (2018) 1357–1370.
- Mann et al. [2019] A. Mann, R. S. Sopher, S. Goren, O. Shelah, O. Tchaicheeyan, A. Lesman, Force chains in cell–cell mechanical communication, J. R. Soc. Interface (2019).
- Goren et al. [2020] S. Goren, Y. Koren, X. Xu, A. Lesman, Elastic anisotropy governs the range of cell-induced displacements, Biophysical Journal 118 (2020) 1152–1164.
- Friesecke and Theil [2002] Friesecke, Theil, Validity and Failure of the Cauchy-Born Hypothesis in a Two-Dimensional Mass-Spring Lattice, Journal of Nonlinear Science 12 (2002) 445–478.
- Burla et al. [2019] F. Burla, B. E. Vos, A. A. Roberts, From mechanical resilience to active material properties in biopolymer networks, Nature Reviews Physics (2019).
- Lakes et al. [1993] R. Lakes, P. Rosakis, A. Ruina, Microbuckling instability in elastomeric cellular solids, Journal of Materials Science 28 (1993) 4667–4672.
- Kim et al. [2015] O. V. Kim, X. Liang, R. I. Litvinov, J. W. Weisel, M. S. Alber, P. K. Purohit, Foam-like compression behavior of fibrin networks, Biomechanics and Modeling in Mechanobiology (2015).
- Tarantino and Danas [2019] M. Tarantino, K. Danas, Programmable higher-order euler buckling modes in hierarchical beams, International Journal of Solids and Structures 167 (2019) 170–183.
- Kalaitzidou [2019] C. Kalaitzidou, Modelling and Simulation of Deformation Localization in Fibrous Extracellular Matrix induced by Contractile Cells, Master’s thesis, University of Crete, 2019.
- Coulais et al. [2015] C. Coulais, J. T. B. Overvelde, L. A. Lubbers, K. Bertoldi, M. van Hecke, Discontinuous buckling of wide beams and metabeams, Phys. Rev. Lett. 115 (2015) 044301.
- Pecknold et al. [1985] D. A. Pecknold, J. Ghaboussi, T. J. Healey, Snap-through and bifurcation in a simple structure, Journal of Engineering Mechanics 111 (1985) 909–922.
- Python Core Team [2015] Python Core Team, Python: A dynamic, open source programming language., Python Software Foundation, 2015. https://www.python.org/.
- Alnæs et al. [2015] M. S. Alnæs, J. Blechta, J. Hake, A. Johansson, B. Kehlet, A. Logg, C. Richardson, J. Ring, M. E. Rognes, G. N. Wells, The FEniCS Project Version 1.5, Archive of Numerical Software 3 (2015) 9–23.
- R Core Team [2014] R Core Team, R: A Language and Environment for Statistical Computing, R Foundation for Statistical Computing, Vienna, Austria, 2014. http://www.R-project.org/.
- Ban et al. [2018] E. Ban, J. M. Franklin, S. Nam, L. R. Smith, H. Wang, R. G. Wells, O. Chaudhuri, J. T. Liphardt, V. B. Shenoy, Article Mechanisms of Plastic Deformation in Collagen Networks Induced by Cellular Forces, Biophysj 114 (2018) 450–461.
- Provenzano et al. [2008] P. P. Provenzano, D. R. Inman, K. W. Eliceiri, J. G. Knittel, L. Yan, C. T. Rueden, J. G. White, P. J. Keely, Collagen density promotes mammary tumor initiation and progression, BMC Medicine 6 (2008) 11.
- Conklin et al. [2011] M. W. Conklin, J. C. Eickhoff, K. M. Riching, C. A. Pehlke, K. W. Eliceiri, P. P. Provenzano, A. Friedl, P. J. Keely, Aligned collagen is a prognostic signature for survival in human breast carcinoma, Am J Pathol 178 (2011) 1221–1232.
- Gomez et al. [2019] D. Gomez, S. Natan, Y. Shokef, A. Lesman, Mechanical Interaction between Cells Facilitates Molecular Transport, Adv. Biosyst. 1900192 (2019) 1–12.
- Grekas [2019] G. Grekas, Modelling, analysis and computation of cell-induced phase transitions in fibrous biomaterials, Ph.D. thesis, University of Crete, 2019.
- Gloria et al. [2014] A. Gloria, P. Le Tallec, M. Vidrascu, Foundation, analysis, and numerical investigation of a variational network-based model for rubber, Continuum Mechanics and Thermodynamics 26 (2014) 1–31.
- Müller et al. [1993] S. Müller, N. Triantafyllidis, G. Geymonat, Homogenization of nonlinearly elastic materials, microscopic bifurcation and macroscopic loss of rank-one convexity, Springer-Verlag (1993).
5 Supplementary Material


Colorbars: (a-c) densification ratio of the deformed networks, (d-k) fiber stretch


Colorbars: (a-c) densification ratio of the deformed networks, (d-k) fiber stretch.

Colorbars: (a-c) densification ratio of the deformed networks, (d-k) fiber stretch.
