Mapping the circumnuclear regions of the Circinus galaxy with the Imaging X-ray Polarimetry Explorer2022Mapping the circumnuclear regions of the Circinus galaxy with the Imaging X-ray Polarimetry Explorer–Authors’ affiliations
Abstract
We report on the Imaging X-ray Polarimetry Explorer (IXPE) observation of the closest and X-ray brightest Compton-thick active galactic nucleus (AGN), the Circinus galaxy. We find the source to be significantly polarized in the 2–6 keV band. From previous studies, the X-ray spectrum is known to be dominated by reflection components, both neutral (torus) and ionized (ionization cones). Our analysis indicates that the polarization degree is per cent (at 68 per cent confidence level) for the neutral reflector, with a polarization angle of , roughly perpendicular to the radio jet. The polarization of the ionized reflection is unconstrained. A comparison with Monte Carlo simulations of the polarization expected from the torus shows that the neutral reflector is consistent with being an equatorial torus with a half-opening angle of 45°–55°. This is the first X-ray polarization detection in a Seyfert galaxy, demonstrating the power of X-ray polarimetry in probing the geometry of the circumnuclear regions of AGNs, and confirming the basic predictions of standard Unification Models.
Keywords:
galaxies: active – galaxies: individual: Circinus – galaxies: Seyfert – polarization – scattering – X-rays: galaxies1 Introduction
A large fraction of active galactic nuclei (AGNs) are obscured by gas and dust (Ramos Almeida & Ricci 2017, per cent of local AGNs; e.g.). According to Unification Models (Antonucci 1993, e.g.), the obscuring medium is a geometrically thick and axisymmetric structure, and is generally referred to as the “torus”. Sources obscured by material with a column density cm-2 (where is the Thomson cross-section) are called Compton-thick, and make up a sizeable fraction of local AGNs (Malizia et al. 2009; Ricci et al. 2015; Torres-Albà et al. 2021, per cent; e.g.). In general, the X-ray nuclear radiation from Compton-thick Seyfert 2 galaxies is completely obscured, at least up to 10 keV (Arévalo et al. 2014; Marinucci et al. 2016, e.g.). The X-ray spectrum is thus dominated by reflection, from both neutral and ionized matter surrounding the nucleus (Matt et al. 2000, e.g.). For unobscured objects, the direct emission dominates and the reflection component is weak or even invisible. Compton-thick AGN are therefore ideal candidates for X-ray polarimetric observations aimed at determining the geometry of the circumnuclear scattering material. In fact, the X-ray polarization produced by the reprocessing of the nuclear emission carries information about the cold reflector (i.e. the torus), responsible for the intense iron K emission line and Compton reflection continuum, and the ionized reflector, responsible for the soft X-ray continuum and line emission. In particular, it has been shown that measurements of the half-opening angle of the torus and of the inclination angle with respect to the line of sight are possible, along with a comparison of the main axes of the X-ray reflecting structures with those of optical/IR emitting regions, like the ionization cone (Goosmann & Matt 2011, e.g.).
The Circinus galaxy is one of the closest AGN (Freeman et al. 1977, redshift ; distance Mpc,). It has been extensively observed by X-ray satellites in the last 30 years. It was detected by ROSAT during the All Sky Survey for the first time in the X-rays (Brinkmann et al. 1994) and later on by the Advanced Satellite for Cosmology and Astrophysics (ASCA), showing a spectrum dominated by a Compton reflection component (Matt et al. 1996), with a prominent iron K emission line and several other lines from lighter elements (Bianchi et al. 2001). Beppo-SAX confirmed the ASCA results below 10 keV and the Compton-thick nature of the source at higher energies (Guainazzi et al. 1999; Matt et al. 1999). The properties of the nuclear and circumnuclear emission have then been investigated in more details thanks to the better angular and spectral resolution of Chandra (Sambruna et al. 2001a; Sambruna et al. 2001b; Marinucci et al. 2013; Kawamuro et al. 2019) and XMM-Newton (Molendi et al. 2003; Massaro et al. 2006). NuSTAR, more recently, confirmed the Compton-thick nature of the source (Arévalo et al. 2014, cm-2,). The extranuclear activity of Circinus has been well studied also at longer wavelengths, showing a prominent [O iii] ionization cone (Marconi et al. 1994), two starburst rings at 2″ and 10″ from the nucleus (Wilson et al. 2000, and references therein), and a radio jet has been observed as part of an overall complex extended radio structure (Elmouttie et al. 1998b; Curran et al. 2008). The 100-pc bipolar jet emanates from the compact core in the same direction of kpc-scale radio plumes (Elmouttie et al. 1998b). On the subparsec scales, the source shows an edge-on, warped accretion disc, traced by H2O maser emission at 1.3 cm with very long baseline interferometry (Greenhill et al. 2003).
The Circinus galaxy is the X-ray brightest (Bianchi et al. 2002, erg cm-2 s-1,) Compton-thick Seyfert 2 galaxy in the sky. Therefore, it has been chosen as the first Compton-thick AGN to be observed by the Imaging X-ray Polarimetry Explorer (Weisskopf et al. 2022; Soffitta et al. 2021, IXPE,). Here we report on this observation, performed jointly with Chandra to enable a spatially resolved spectro-polarimetric study.
The paper is organized as follows. In Sect. 2, we describe the IXPE and Chandra observations and data reduction. In Sect. 3, we report on the data analysis and results. In Sect. 4, we discuss the constraints on the geometry of the system by comparing the results with detailed Monte Carlo simulations of the polarization expected from the torus.
2 Observations and data reduction
2.1 IXPE
IXPE observed the Circinus galaxy starting on 2022 July 12 with its three Detector Units (DU)/Mirror Module Assemblies (MMA), for a net exposure time of 771.5 ks (Table 1). Cleaned level 2 event files were produced and calibrated using standard filtering criteria with the dedicated ftools tasks11 1 https://heasarc.gsfc.nasa.gov/docs/ixpe/analysis/IXPE-SOC-DOC-009-UserGuide-Software.pdf and the latest calibration files available in the IXPE calibration database (CALDB 20220314).
The Stokes , , background spectra were extracted from source-free circular regions with a radius of 100″. Extraction radii for the Stokes spectra of the source were computed via an iterative process which leads to the maximization of the signal-to-noise ratio (SNR) in the 2–8 keV energy band, similar to the approach described in Piconcelli et al. 2004. This procedure consists in the extraction of several source spectra, monotonically increasing the value of the radius, until the maximum SNR is found. We eventually adopted circular regions centered on the source with radii of 52″, 52″ and 47″ for DU1, DU2 and DU3, respectively. The same extraction radii were then applied to the and Stokes spectra. The weighted analysis method presented in Di Marco et al. 2022 (parameter stokes=Neff in xselect) was applied. We used a constant energy binning of 0.2 keV for , Stokes spectra and required a 2–8 keV SNR higher than 3 in each spectral channel, in the flux spectra. , , Stokes spectra from the three DU/MMAs are always fitted independently in the following. Background represents 17.0, 19.7 and 16.4 per cent of the total DU1/MMA1, DU2/MMA2 and DU3/MMA3 flux spectra, respectively. The same extraction regions were used in ixpeobssim (Baldini et al. 2022, version 28.2.0:), which implements the method of Kislat et al. 2015 to reconstruct the polarization properties. The information is represented as data cubes containing images of the Stokes parameters, binned in sky coordinates. Polarization cubes from the source and from the background were extracted, following the same procedure as for MCG-05-23-16 (Marinucci et al. 2022), including background subtraction. We created one polarization cube for each DU in the 2–8 keV band and then combined them; we then computed the Stokes parameters, the corresponding polarization degree and angle, and the associated uncertainties.
2.2 Chandra
The central region of the Circinus galaxy is heavily populated by ultraluminous X-ray (ULX) sources (Bauer et al. 2001; Smith & Wilson 2001), and the IXPE point spread function () does not allow us to spatially resolve some of them. For this reason, Chandra observed the Circinus galaxy at the beginning and end of the IXPE observation. These two Chandra observations allowed us to monitor the flux state of the ULXs and in particular of CG X-1, which is highly variable, reaching in the past fluxes almost as large as that of the AGN (Bianchi et al. 2002).
The two Chandra observations were performed on 2022 July 11 and July 24 (see Table 1) with the Advanced CCD Imaging Spectrometer (Garmire et al. 2003, ACIS;) for elapsed times of 10 ks each. To reduce pileup effects, the frame time was set to 0.5 s and custom CCD subarrays were used. Data were reduced with the Chandra Interactive Analysis of Observations (Fruscione et al. 2006, CIAO;) 4.14 and the Chandra Calibration Data Base 4.9.8, adopting standard procedures. At the distance of the source 1″ corresponds to 19 pc. We generated event files for the two observations with the CIAO tool chandra-repro and, after cleaning for background flaring, we got net exposure times of 9.3 ks each.
The spectra from the CG X-1 and CG X-2 were extracted from circular regions centered on the two sources with 3″ radii. We used a 10″ radius circle for background extraction. For the AGN, we used an ellipse with a semi-minor axis of 15″ and semi-major axis of 23″ (Fig. 1). Co-adding the two exposures, in the 2–8 keV band 800 counts are measured for the two ULXs and 4910 counts for the AGN.
After the two ULXs, the brightest point sources in the field, both outside of the AGN extraction region, are CXOU J141312.6–652052 and CXOU J141312.2–652007 (Bauer et al. 2001). However, only 210 counts (2–8 keV) are measured in total for the two sources together. Within the AGN extraction region, three other point sources are detected, namely CXOU J141309.2–652017, CXOU J141310.1–652029, and CXOU J141310.3–652017 (Bauer et al. 2001). Evaluating their counts is less obvious due to the contamination of the AGN, however we estimate a total of 250 counts (2–8 keV) summing all the three sources. Given the overall small contribution of these sources, for simplicity we only take into account the contribution from CG X-1 and CG X-2 in the following spectral analysis.
Spectra were binned in order to oversample the instrumental resolution by a factor of 3 and to have no less than 30 counts in each background-subtracted spectral channel. This allows the applicability of the statistic. We ignored channels between 8 and 10 keV due to pileup, which is not unexpected owing to the decreased effective area of the detector and the decline of the intrinsic source spectrum.22 2 For more details, see the Chandra ABC Guide to Pileup, online at: https://cxc.harvard.edu/ciao/download/doc/pileup_abc.pdf. We estimate the fraction of detected events that are in fact piled using the ciao tool pileup-map. We infer that in the central pixels region the average pileup fraction is 6 per cent, ranging from 3 to 9 per cent (in the central pixel) for both observations. Details on the analysis of Chandra images and spectra are reported in the Appendix. Since the AGN emission is consistent with being constant (see Appendix), we use the co-added spectrum for the spectro-polarimetric analysis.

| Satellite | Obs. Id. | Start time (UTC) | Net exp. (ks) |
|---|---|---|---|
| IXPE | 01003501 | 2022-07-12 | 771.5 |
| Chandra | 25365 | 2022-07-11 | 9.3 |
| 25366 | 2022-07-24 | 9.3 |
| Energy | P.D. (%) | P.A. (deg) |
|---|---|---|
| 2–8 keV | ||
| 2–4 keV | ||
| 4–6 keV | ||
| 2–6 keV | ||
| 6–8 keV | - |
3 Polarization properties of the circumnuclear matter
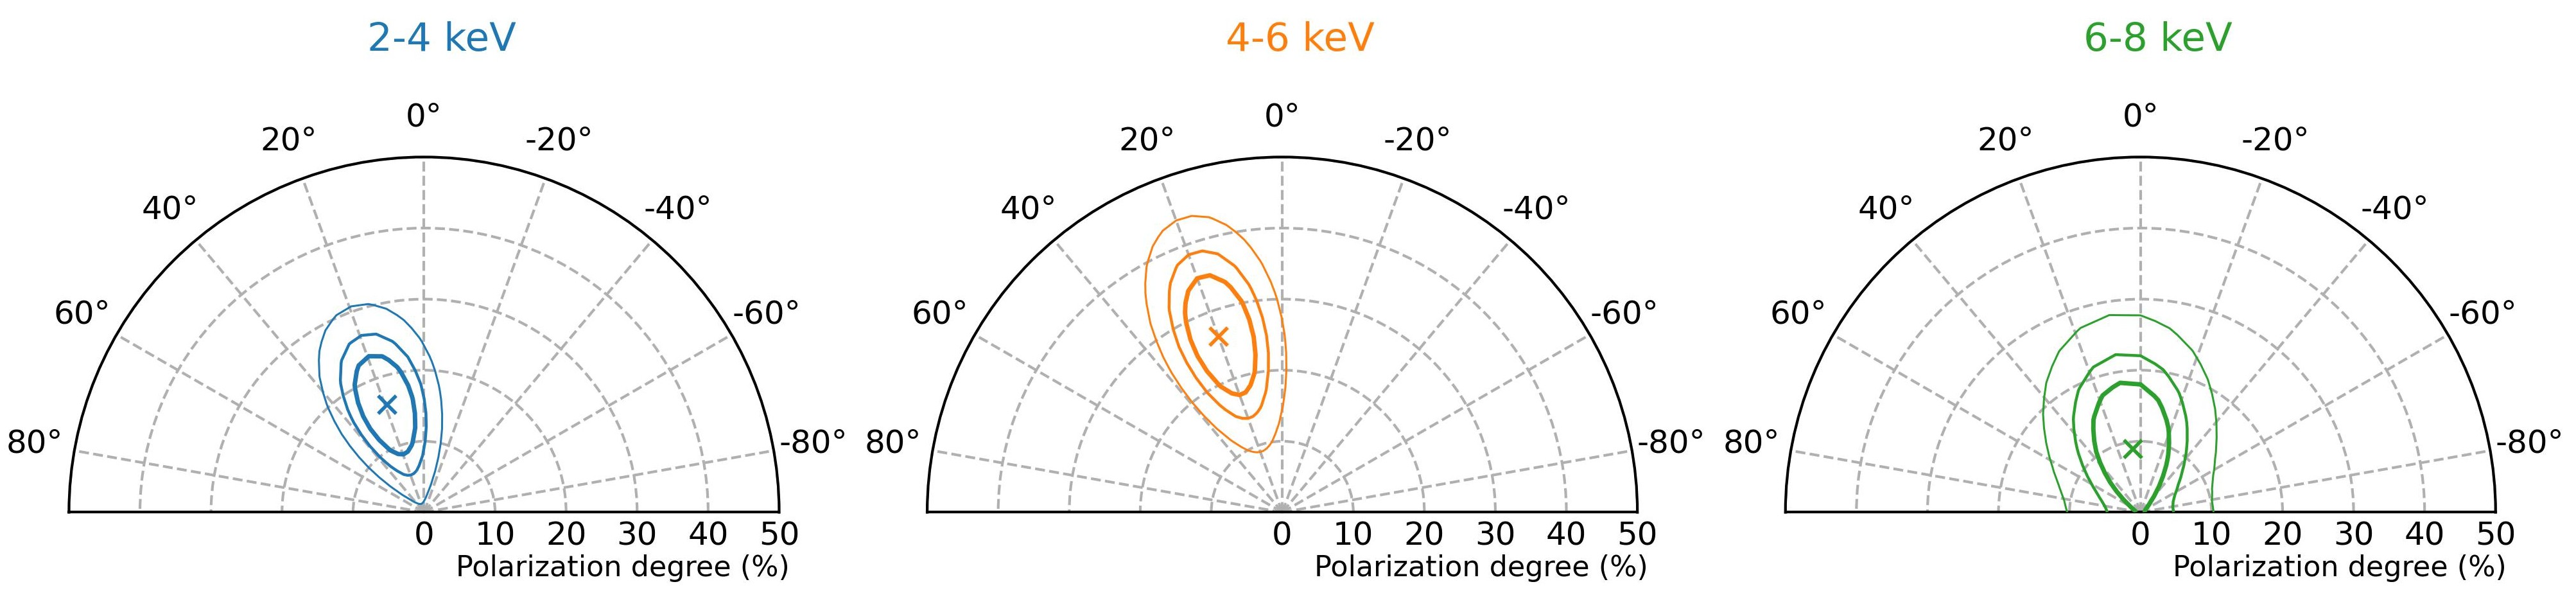
In the IXPE energy range, the spectrum of the Circinus galaxy is known to be dominated by two components: emission from a warm reflector, likely due to ionized, optically thin matter and mostly contributing below 3 keV, and from a cold reflector dominating the spectrum above 4 keV, due to the optically thick torus (Bianchi et al. 2001; Sambruna et al. 2001a; Sambruna et al. 2001b; Massaro et al. 2006, e.g.). The spectra of both reflectors are composed of a continuum (expected to be significantly polarized) and emission lines (expected to be unpolarized, apart from the contribution by resonant scattering). In Table 2 we report the polarization degree and angle at different energies. We show these parameters as measured from the IXPE spectra using xspec 12.12.1 (Arnaud 1996), with the 68 per cent confidence level uncertainty for one parameter of interest. The parameters found from the polarization cubes extracted with ixpeobssim are well consistent within the errors. We obtain a significant detection in the 2–6 keV band, with a polarization degree of per cent (at 68 per cent confidence level). The lack of a significant detection in the 6–8 keV band is likely due to the prominent iron lines present in the spectrum. Indeed, the flux of the iron lines between 6.4 and 7.057 keV reaches 50 per cent of the total flux in the 6–8 keV band (Massaro et al. 2006). The ranges of polarization degree and angle shown in Table 2 are one-dimensional, in the sense that they are derived for each parameter independently of the other. In Fig. 2, we show two-dimensional contour plots of the polarization degree and angle at different energies. We note that in the 2–4 and 4–6 keV bands the detection significance is greater than 99 per cent, and greater than at least in the 4–6 keV band. Finally, the polarization angle is consistent with being constant in energy.
| Parameter | Value |
|---|---|
| CG X-1 (powerlaw) | |
| (f) | |
| (f) | |
| CG X-2 (raymond+zgauss) | |
| (keV) | (f) |
| (f) | |
| (keV) | (f) |
| (keV) | (f) |
| Cold reflector (pexrav) | |
| (f) | |
| P.D. (%) | |
| P.A. (deg) | |
| Warm reflector (powerlaw) | |
| (f) | |
| (f) | |
| P.D. (%) | unconstrained |
| P.A. (deg) | |
| Cross-calibration constants | |
| Observed flux | |
| /d.o.f. | |
We then fit simultaneously the Chandra and IXPE , , Stokes spectra with a model composed of a power law (for the warm reflector continuum), a pexrav (Magdziarz & Zdziarski 1995) component (for the scattered cold reflection continuum) and a number of gaussian lines.33 3 The choice of using the pexrav model plus emission lines instead of more sophisticated models which treat continuum and lines together is just due to the fact that the polarization of the continuum reflected emission and of the emission lines are expected to be different. We fix the photon index of pexrav at 1.6, consistent with BeppoSAX, Suzaku and NuSTAR previous measurements (Matt et al. 1999; Yang et al. 2009; Arévalo et al. 2014). We also fix the energy and flux of the gaussian lines to those derived from the spectrum (Massaro et al. 2006, not reported here for the sake of brevity; see Table 2 of). No strong variability is expected for these lines, since they are associated with extended emission at kpc scales from the central nuclear source. The warm reflector is partly ionized and it produces a complex emission (Guainazzi et al. 1999; Kallman et al. 2014, e.g.). However, it is phenomenologically well described by a soft power law (Bianchi et al. 2001; Marinucci et al. 2013; Arévalo et al. 2014), as often found in obscured Seyfert 2 galaxies (Bianchi et al. 2001; Matt et al. 2003; Matt et al. 2013; Bauer et al. 2015, e.g.). We fix its photon index at 3.0 (see Appendix). For the IXPE spectra, we also include the best-fitting model for the ULXs CG X-1 and CG X-2 derived from Chandra, keeping all spectral parameters fixed (see Appendix). The continuum components are multiplied by the polconst model, which provides the (energy-independent) polarization degree and angle of each component. We assume the emission lines and the ULXs to be unpolarized.44 4 If we fit for the polarization of the Fe K line complex, we obtain an upper limit of 20 per cent, consistent with the expectation for unpolarized fluorescence emission. On the other hand, the Compton shoulder, due to the downscattering of line photons, could theoretically be polarized up to 15 per cent (Ghisellini et al. 1994, as computed with the code of). However, its flux is at most 20 per cent of that of the line core (Bianchi et al. 2002; Molendi et al. 2003). Therefore, the overall polarization of the line complex should be in any case less than 3 per cent, and we choose to neglect it in the spectral fit. In xspec, the model is:
| lines | |||||
| CG X-1 | |||||
| CG X-2 | |||||
| warm refl. | |||||
| cold refl. |
where c_cal denotes the cross-calibration constant. We keep the polarization degree of polconst(0) fixed at zero, which is needed to assume an unpolarized component in xspec. Assuming that the warm and cold reflectors are both axially symmetric structures, their polarization angle is expected to be either parallel or perpendicular to the common symmetry axis. For simplicity, we assume the same polarization angle for the warm and cold reflectors. However, we obtain consistent results assuming orthogonal vectors, or by leaving the two polarization angles untied. The fit is very good, with /d.o.f.=702/662. The data and best-fitting model are shown in Figs. 3 and 4. The best-fitting parameters, and in particular the polarization degree and angle, are reported in Table 3 and Fig. 5. The polarization degree of the warm reflector is unconstrained, due to its relatively low flux ( per cent of the total flux in the 2–4 keV band, see also Fig. 4). For the cold reflector, instead, we obtain significant constraints: a polarization degree of per cent and a polarization angle of (68 per cent confidence for one parameter; see also the two-parameter contours in Fig. 5). Interestingly, the polarization angle is consistent with being perpendicular to the radio jet (Elmouttie et al. 1998b, position angle of 295°,), which also roughly coincides with the axis of the H ionization cone (Elmouttie et al. 1998a), and is close to the direction of the inner H2O maser disc (Greenhill et al. 2003, position angle of ,).
We also note that the ULXs could in principle be polarized, however they are subdominant at all energies (see Fig. 4). Even if we assume a polarization degree of 10 per cent for the ULXs, the fit discussed above is essentially unchanged. Thus, unless highly polarized (Vink et al. 2022; Krawczynski et al. 2022, which is unlikely, see e.g.), the ULXs cannot affect the AGN measurement.
4 Discussion and conclusions
The radiation reflected off the torus, assumed to have an axial symmetry, is expected to be highly polarized (Ghisellini et al. 1994; Goosmann & Matt 2011; Marin et al. 2018; Ratheesh et al. 2021), with a polarization degree depending on the geometrical parameters (namely the torus aperture and the system’s inclination) and a polarization angle orthogonal to the torus axis. To better explore the polarization properties of the reflecting torus, we perform calculations with the Monte Carlo radiative transfer code described in Ghisellini et al. 1994. The code takes into account Compton scattering and photoelectric absorption in a neutral medium with solar abundances (Matt et al. 1991, see also). Ratheesh et al. 2021 applied the code to compute the polarization degree of radiation scattered by a torus-like distribution. We show in Fig. 6 (left panel) a sketch of the assumed geometry. The shape of the torus is defined by the half-opening angle and the ratio between the inner and outer radius. Like Ratheesh et al. 2021, we assume two different values and 0.5. As for the equatorial column density, we assume cm-2, consistent with the X-ray measurements of Arévalo et al. 2014.
In Fig. 6 (right panel), we show the contours of the polarization degree, calculated as a function of the inclination and of the torus aperture. The 68 per cent confidence level region for the observed value of polarization is also shown. We only plot the case with , because yields very similar results. Assuming an observer inclination of 65°, namely that of the host galaxy (Freeman et al. 1977), we would obtain a torus aperture roughly in the range 45°–55°. However, the actual inclination might be larger, and different measurements are consistent with an edge-on torus. From the CO(3-2) emission within the central 10 pc, Izumi et al. 2018 estimate and note that the inclination could increase at lower radii. Indeed, for the 1-pc scale mid-infrared disc, Tristram et al. 2014 estimate , while Isbell et al. 2022 report . As suggested by Izumi et al. 2018 and Isbell et al. 2022, the inclination could reach 90° for the H2O maser disc (Greenhill et al. 2003). Assuming a torus close to edge-on, we obtain an aperture of 40°–50°. Finally, Elmouttie et al. 1998a estimate a value of 33° for the half-opening angle of the H cone, while Fischer et al. 2013 estimate 41° for the [O iii] cone. This implies a lower limit to the torus aperture which is consistent with our calculations.
A torus-like distribution of gas and dust surrounding the central engine is the cornerstone of AGN Unification Models, notwithstanding their continuing development (Antonucci & Miller 1985; Antonucci 1993; Bianchi et al. 2012; Marin 2014; Netzer 2015; Marin 2016; Ramos Almeida & Ricci 2017, e.g.). In the current understanding, the torus is actually a clumpy structure, as was early on suggested by Krolik & Begelman 1988. Especially in the case of the Circinus galaxy, this is strongly supported by infrared interferometry (Tristram et al. 2007; Tristram et al. 2014; Stalevski et al. 2017; Stalevski et al. 2019; Isbell et al. 2022) and by the imaging analysis of the X-ray reflector (Marinucci et al. 2013; see also Andonie et al. 2022). In any case, the X-ray polarimetric properties are in qualitative agreement with the expected results for a geometrically thick torus having an aspect ratio , meaning a covering factor . This result is consistent with the estimate obtained for local AGNs from the average X-ray absorption properties (see Ramos Almeida & Ricci 2017, and references therein).
We note that the Unification Model was introduced after the detection of broad emission lines in the optical polarized spectrum of Seyfert 2 galaxies, with the first one being the Compton-thick AGN NGC 1068 (Antonucci & Miller 1985; see also Oliva et al. 1998 for the case of the Circinus galaxy). Adding a crucial piece of information, X-ray polarimetry now confirms the basic picture of this scenario. A comprehensive discussion of its implications, taking into account polarimetric information at all wavelengths (Marin 2018, e.g.), is beyond the scope of this paper and will be the subject of a future work.
Acknowledgements
The Imaging X ray Polarimetry Explorer (IXPE) is a joint US and Italian mission. The US contribution is supported by the National Aeronautics and Space Administration (NASA) and led and managed by its Marshall Space Flight Center (MSFC), with industry partner Ball Aerospace (contract NNM15AA18C). The Italian contribution is supported by the Italian Space Agency (Agenzia Spaziale Italiana, ASI) through contract ASI-OHBI-2017-12-I.0, agreements ASI-INAF-2017-12-H0 and ASI-INFN-2017.13-H0, and its Space Science Data Center (SSDC) with agreements ASI-INAF-2022-14-HH.0 and ASI-INFN 2021-43-HH.0, and by the Istituto Nazionale di Astrofisica (INAF) and the Istituto Nazionale di Fisica Nucleare (INFN) in Italy. This research used data products provided by the IXPE Team (MSFC, SSDC, INAF, and INFN) and distributed with additional software tools by the High-Energy Astrophysics Science Archive Research Center (HEASARC), at NASA Goddard Space Flight Center (GSFC). JPou and SST were supported by the Academy of Finland grants 349373 and 349906. AIng acknowledges support from the Royal Society. MDov, JSvo and VKar acknowledge the support from the GACR project 21-06825X. POP acknowledges financial support from the French High Energy Program (PNHE/CNRS) and from the french spatial agency (CNES).
Data Availability
The data used in this paper are publicly available in the HEASARC database. The code by Ghisellini et al. 1994 used to perform the numerical simulations is proprietary; simulation data supporting the findings of the article will be shared on reasonable request.
References
- Andonie et al. (2022) Andonie C., Ricci C., Paltani S., Arévalo P., Treister E., Bauer F., Stalevski M., 2022, MNRAS, 511, 5768
- Antonucci (1993) Antonucci R., 1993, ARA&A, 31, 473
- Antonucci & Miller (1985) Antonucci R. R. J., Miller J. S., 1985, ApJ, 297, 621
- Arévalo et al. (2014) Arévalo P., et al., 2014, ApJ, 791, 81
- Arnaud (1996) Arnaud K. A., 1996, in Jacoby G. H., Barnes J., eds, Astronomical Society of the Pacific Conference Series Vol. 101, Astronomical Data Analysis Software and Systems V. p. 17
- Baldini et al. (2022) Baldini L., Bucciantini N., Di Lalla N., Ehlert S. R., Manfreda A., Omodei N., Pesce-Rollins M., Sgrò C., 2022, arXiv e-prints, p. arXiv:2203.06384
- Bauer et al. (2001) Bauer F. E., Brandt W. N., Sambruna R. M., Chartas G., Garmire G. P., Kaspi S., Netzer H., 2001, AJ, 122, 182
- Bauer et al. (2015) Bauer F. E., et al., 2015, ApJ, 812, 116
- Bianchi et al. (2001) Bianchi S., Matt G., Iwasawa K., 2001, MNRAS, 322, 669
- Bianchi et al. (2002) Bianchi S., Matt G., Fiore F., Fabian A. C., Iwasawa K., Nicastro F., 2002, A&A, 396, 793
- Bianchi et al. (2012) Bianchi S., Maiolino R., Risaliti G., 2012, Advances in Astronomy, 2012, 782030
- Brinkmann et al. (1994) Brinkmann W., Siebert J., Boller T., 1994, A&A, 281, 355
- Curran et al. (2008) Curran S. J., Koribalski B. S., Bains I., 2008, MNRAS, 389, 63
- Di Marco et al. (2022) Di Marco A., et al., 2022, AJ, 163, 170
- Elmouttie et al. (1998a) Elmouttie M., Koribalski B., Gordon S., Taylor K., Houghton S., Lavezzi T., Haynes R., Jones K., 1998a, MNRAS, 297, 49
- Elmouttie et al. (1998b) Elmouttie M., Haynes R. F., Jones K. L., Sadler E. M., Ehle M., 1998b, MNRAS, 297, 1202
- Esposito et al. (2015) Esposito P., Israel G. L., Milisavljevic D., Mapelli M., Zampieri L., Sidoli L., Fabbiano G., Rodríguez Castillo G. A., 2015, MNRAS, 452, 1112
- Fischer et al. (2013) Fischer T. C., Crenshaw D. M., Kraemer S. B., Schmitt H. R., 2013, ApJS, 209, 1
- Freeman et al. (1977) Freeman K. C., Karlsson B., Lynga G., Burrell J. F., van Woerden H., Goss W. M., Mebold U., 1977, A&A, 55, 445
- Fruscione et al. (2006) Fruscione A., et al., 2006, in Silva D. R., E. D. R., eds, SPIE Conf. Ser. Vol. 6270, Observatory Operations: Strategies, Processes, and Systems. p. 62701V, doi:10.1117/12.671760
- Garmire et al. (2003) Garmire G. P., Bautz M. W., Ford P. G., Nousek J. A., Ricker G. R., 2003, in Truemper J. E., D. T. H., eds, SPIE Conf. Ser. Vol. 4851, X-Ray and Gamma-Ray Telescopes and Instruments for Astronomy. pp 28–44
- Ghisellini et al. (1994) Ghisellini G., Haardt F., Matt G., 1994, MNRAS, 267, 743
- Goosmann & Matt (2011) Goosmann R. W., Matt G., 2011, MNRAS, 415, 3119
- Greenhill et al. (2003) Greenhill L. J., et al., 2003, ApJ, 590, 162
- Guainazzi et al. (1999) Guainazzi M., et al., 1999, MNRAS, 310, 10
- Isbell et al. (2022) Isbell J. W., et al., 2022, A&A, 663, A35
- Izumi et al. (2018) Izumi T., Wada K., Fukushige R., Hamamura S., Kohno K., 2018, ApJ, 867, 48
- Kallman et al. (2014) Kallman T., Evans D. A., Marshall H., Canizares C., Longinotti A., Nowak M., Schulz N., 2014, ApJ, 780, 121
- Kawamuro et al. (2019) Kawamuro T., Izumi T., Imanishi M., 2019, PASJ, 71, 68
- Kislat et al. (2015) Kislat F., Clark B., Beilicke M., Krawczynski H., 2015, Astroparticle Physics, 68, 45
- Krawczynski et al. (2022) Krawczynski H., et al., 2022, arXiv e-prints, p. arXiv:2206.09972
- Krolik & Begelman (1988) Krolik J. H., Begelman M. C., 1988, ApJ, 329, 702
- Magdziarz & Zdziarski (1995) Magdziarz P., Zdziarski A. A., 1995, MNRAS, 273, 837
- Malizia et al. (2009) Malizia A., Stephen J. B., Bassani L., Bird A. J., Panessa F., Ubertini P., 2009, MNRAS, 399, 944
- Marconi et al. (1994) Marconi A., Moorwood A. F. M., Origlia L., Oliva E., 1994, The Messenger, 78, 20
- Marin (2014) Marin F., 2014, MNRAS, 441, 551
- Marin (2016) Marin F., 2016, MNRAS, 460, 3679
- Marin (2018) Marin F., 2018, MNRAS, 479, 3142
- Marin et al. (2018) Marin F., Dovčiak M., Muleri F., Kislat F. F., Krawczynski H. S., 2018, MNRAS, 473, 1286
- Marinucci et al. (2013) Marinucci A., Miniutti G., Bianchi S., Matt G., Risaliti G., 2013, MNRAS, 436, 2500
- Marinucci et al. (2016) Marinucci A., et al., 2016, MNRAS, 456, L94
- Marinucci et al. (2022) Marinucci A., et al., 2022, MNRAS, 516, 5907
- Massaro et al. (2006) Massaro F., Bianchi S., Matt G., D’Onofrio E., Nicastro F., 2006, A&A, 455, 153
- Matt et al. (1991) Matt G., Perola G. C., Piro L., 1991, A&A, 247, 25
- Matt et al. (1996) Matt G., et al., 1996, MNRAS, 281, L69
- Matt et al. (1999) Matt G., et al., 1999, A&A, 341, L39
- Matt et al. (2000) Matt G., Fabian A. C., Guainazzi M., Iwasawa K., Bassani L., Malaguti G., 2000, MNRAS, 318, 173
- Matt et al. (2003) Matt G., Bianchi S., Guainazzi M., Brandt W. N., Fabian A. C., Iwasawa K., Perola G. C., 2003, A&A, 399, 519
- Matt et al. (2013) Matt G., Bianchi S., Marinucci A., Guainazzi M., Iwawasa K., Jimenez Bailon E., 2013, A&A, 556, A91
- Molendi et al. (2003) Molendi S., Bianchi S., Matt G., 2003, MNRAS, 343, L1
- Netzer (2015) Netzer H., 2015, ARA&A, 53, 365
- Oliva et al. (1998) Oliva E., Marconi A., Cimatti A., di Serego Alighieri S., 1998, A&A, 329, L21
- Piconcelli et al. (2004) Piconcelli E., Jimenez-Bailón E., Guainazzi M., Schartel N., Rodríguez-Pascual P. M., Santos-Lleó M., 2004, MNRAS, 351, 161
- Qiu et al. (2019) Qiu Y., et al., 2019, ApJ, 877, 57
- Ramos Almeida & Ricci (2017) Ramos Almeida C., Ricci C., 2017, Nature Astronomy, 1, 679
- Ratheesh et al. (2021) Ratheesh A., Matt G., Tombesi F., Soffitta P., Pesce-Rollins M., Di Marco A., 2021, A&A, 655, A96
- Ricci et al. (2015) Ricci C., Ueda Y., Koss M. J., Trakhtenbrot B., Bauer F. E., Gandhi P., 2015, ApJ, 815, L13
- Sambruna et al. (2001a) Sambruna R. M., Brandt W. N., Chartas G., Netzer H., Kaspi S., Garmire G. P., Nousek J. A., Weaver K. A., 2001a, ApJ, 546, L9
- Sambruna et al. (2001b) Sambruna R. M., Netzer H., Kaspi S., Brandt W. N., Chartas G., Garmire G. P., Nousek J. A., Weaver K. A., 2001b, ApJ, 546, L13
- Smith & Wilson (2001) Smith D. A., Wilson A. S., 2001, ApJ, 557, 180
- Soffitta et al. (2021) Soffitta P., et al., 2021, AJ, 162, 208
- Stalevski et al. (2017) Stalevski M., Asmus D., Tristram K. R. W., 2017, MNRAS, 472, 3854
- Stalevski et al. (2019) Stalevski M., Tristram K. R. W., Asmus D., 2019, MNRAS, 484, 3334
- Torres-Albà et al. (2021) Torres-Albà N., et al., 2021, ApJ, 922, 252
- Tristram et al. (2007) Tristram K. R. W., et al., 2007, A&A, 474, 837
- Tristram et al. (2014) Tristram K. R. W., Burtscher L., Jaffe W., Meisenheimer K., Hönig S. F., Kishimoto M., Schartmann M., Weigelt G., 2014, A&A, 563, A82
- Vink et al. (2022) Vink J., et al., 2022, arXiv e-prints, p. arXiv:2206.06713
- Weisskopf et al. (2004) Weisskopf M. C., Wu K., Tennant A. F., Swartz D. A., Ghosh K. K., 2004, ApJ, 605, 360
- Weisskopf et al. (2022) Weisskopf M. C., et al., 2022, Journal of Astronomical Telescopes, Instruments, and Systems, 8, 026002
- Wilson et al. (2000) Wilson A. S., Shopbell P. L., Simpson C., Storchi-Bergmann T., Barbosa F. K. B., Ward M. J., 2000, AJ, 120, 1325
- Yang et al. (2009) Yang Y., Wilson A. S., Matt G., Terashima Y., Greenhill L. J., 2009, ApJ, 691, 131
Appendix: observations and analysis
performed two 10-ks observations at the beginning (2022 July 11, obs1) and end (2022 July 24, obs2) of the IXPE observation, to monitor the flux state of the variable ULXs in the Circinus Galaxy, as well as the AGN spectrum. The Chandra image of obs1 is shown in Fig. 1. We analysed the spectra of CG X-1 and CG X-2 to account for these sources in the IXPE spectral analysis.
The nature of CG X-1 has been debated in the literature (Bauer et al. 2001; Bianchi et al. 2002; Weisskopf et al. 2004; Esposito et al. 2015), however its spectral and variability properties are consistent with an eclipsing Wolf-Rayet ULX (Esposito et al. 2015; Qiu et al. 2019). In any case, its spectrum is well described by a variable power law. We find a good fit of the two spectra from obs1 and obs2 (/d.o.f. = 109/106), with a photon index in obs1 and in obs2. The 1–8 keV flux increases by a factor of between the two pointings, from to erg cm-2 s-1. The spectra are shown in Fig. 7 (top panel). When modeling the IXPE spectrum, we opt to include a power law with average parameters, namely and a 1–8 keV flux of erg cm-2 s-1.
CG X-2 is a supernova remnant candidate (Bauer et al. 2001). Following Bauer et al. 2001, we fit the spectrum with a Raymond-Smith thermal plasma with a temperature of 10 keV, plus a Gaussian line for ionized iron emission (Bianchi et al. 2002, see also). We jointly fit the two observations, as we find no significant variability among them. We find a decent fit (/d.o.f. = 118/102) with a narrow Gaussian line at keV having a flux of ph cm-2 s-1. The total model flux is erg cm-2 s-1. We show the spectra in Fig. 7 (bottom panel).
Besides Chandra, Swift/XRT also performed two observations of the Circinus field, centered on CG X-2, on 2022 July 18 and July 20 (ObsIds 00045807010 and 00045807011) for an exposure time of 4.3 ks and 4.6 ks, respectively. The small number of counts in XRT prevents a detailed analysis; however, we find no evidence for a significant flux variability of CG X-1 and CG X-2 during these observations.
Finally, we fit the spectrum of the AGN, with a model including cold reflection (pexrav) and Gaussian emission lines (Massaro et al. 2006). As a first step, we jointly fit obs1 and obs2 keeping all parameters tied. We obtain a poor fit with /d.o.f. = 340/135, with significant residuals below 2 keV. Next, we include a power law to describe warm reflection, and we fix the pexrav photon index at 1.6 to avoid model degeneracies. We obtain an acceptable fit with /d.o.f. = 179/134, with no prominent residuals (see Fig. 8). For the warm reflection power law, we obtain a photon index of , consistent with the value reported by Marinucci et al. 2013 from Chandra data. The flux contribution of this component is 5–10% of the total in the 1–8 keV band, raising to 20% in the 2–4 keV band. We do not find a significant improvement by leaving the parameters free to vary between the two observations. We also do not find a significant improvement by leaving free the pexrav photon index. In the IXPE energy band (2–8 keV), the flux of the AGN is erg cm-2 s-1, while that of CG X-1 and CG X-2 is respectively 3–6 and 4 per cent of the AGN flux.
Authors’ affiliations
- 1
Dipartimento di Matematica e Fisica, Università degli Studi Roma Tre, via della Vasca Navale 84, 00146 Roma, Italy
- 2
ASI - Agenzia Spaziale Italiana, Via del Politecnico snc, 00133 Roma, Italy
- 3
Université de Strasbourg, CNRS, Observatoire Astronomique de Strasbourg, UMR 7550, 67000 Strasbourg, France
- 4
Kavli Institute for Astrophysics and Space Research, Massachusetts Institute of Technology, 77 Massachusetts Ave., Cambridge, MA 02139, USA
- 5
Department of Physics and Astronomy, 20014 University of Turku, Finland
- 6
Space Research Institute of the Russian Academy of Sciences, Profsoyuznaya Str. 84/32, Moscow 117997, Russia
- 7
INAF Istituto di Astrofisica e Planetologia Spaziali, Via del Fosso del Cavaliere 100, 00133 Roma, Italy
- 8
California Institute of Technology, Pasadena, CA 91125, USA
- 9
Department of Physics - Astrophysics, University of Oxford, Denys Wilkinson Building, Keble Road, Oxford OX1 3RH, UK
- 10
School of Mathematics, Statistics and Physics, Newcastle University, Herschel Building, Newcastle upon Tyne, NE1 7RU, UK
- 11
Dipartimento di Fisica, Università degli Studi di Roma "La Sapienza", Piazzale Aldo Moro 5, 00185 Roma, Italy
- 12
Dipartimento di Fisica, Università degli Studi di Roma "Tor Vergata", Via della Ricerca Scientifica 1, 00133 Roma, Italy
- 13
Physics Department and McDonnell Center for the Space Sciences, Washington University in St. Louis, St. Louis, MO 63130, USA
- 14
Astronomical Institute of the Czech Academy of Sciences, Boční II 1401/1, 14100 Praha 4, Czech Republic
- 15
Istituto Nazionale di Fisica Nucleare, Sezione di Roma "Tor Vergata", Via della Ricerca Scientifica 1, 00133 Roma, Italy
- 16
Department of Astronomy, University of Maryland, College Park, Maryland 20742, USA
- 17
NASA Marshall Space Flight Center,Huntsville,AL 35812,USA
- 18
Astronomical Institute, Charles University, V Holešovičkách 2, CZ-18000 Prague, Czech Republic
- 19
Instituto de Astrofísica de Andalucía—CSIC, Glorieta de la Astronomía s/n, 18008 Granada, Spain
- 20
INAF Osservatorio Astronomico di Roma, Via Frascati 33, 00078 Monte Porzio Catone (RM), Italy
- 21
Space Science Data Center, Agenzia Spaziale Italiana, Via del Politecnico snc, 00133 Roma, Italy
- 22
INAF Osservatorio Astronomico di Cagliari, Via della Scienza 5, 09047 Selargius (CA), Italy
- 23
Istituto Nazionale di Fisica Nucleare, Sezione di Pisa, Largo B. Pontecorvo 3, 56127 Pisa, Italy
- 24
Dipartimento di Fisica, Università di Pisa, Largo B. Pontecorvo 3, 56127 Pisa, Italy
- 25
Istituto Nazionale di Fisica Nucleare, Sezione di Torino, Via Pietro Giuria 1, 10125 Torino, Italy
- 26
Dipartimento di Fisica, Università degli Studi di Torino, Via Pietro Giuria 1, 10125 Torino, Italy
- 27
INAF Osservatorio Astrofisico di Arcetri, Largo Enrico Fermi 5, 50125 Firenze, Italy
- 28
Dipartimento di Fisica e Astronomia, Università degli Studi di Firenze, Via Sansone 1, 50019 Sesto Fiorentino (FI), Italy
- 29
Istituto Nazionale di Fisica Nucleare, Sezione di Firenze, Via Sansone 1, 50019 Sesto Fiorentino (FI), Italy
- 30
Department of Physics and Kavli Institute for Particle Astrophysics and Cosmology, Stanford University, Stanford, California 94305, USA
- 31
Institut für Astronomie und Astrophysik, Universität Tübingen, Sand 1, 72076 Tübingen, Germany
- 32
RIKEN Cluster for Pioneering Research, 2-1 Hirosawa, Wako, Saitama 351-0198, Japan
- 33
Yamagata University, 1-4-12 Kojirakawa-machi, Yamagata-shi 990-8560, Japan
- 34
University of British Columbia,Vancouver,BC V6T 1Z4,Canada
- 35
Department of Physics, Faculty of Science and Engineering, Chuo University, 1-13-27 Kasuga, Bunkyo-ku, Tokyo 112-8551, Japan
- 36
Institute for Astrophysical Research, Boston University, 725 Commonwealth Avenue, Boston, MA 02215, USA
- 37
Department of Astrophysics, St. Petersburg State University, Universitetsky pr. 28, Petrodvoretz, 198504 St. Petersburg, Russia
- 38
Finnish Centre for Astronomy with ESO, 20014 University of Turku, Finland
- 39
Graduate School of Science, Division of Particle and Astrophysical Science, Nagoya University, Furo-cho, Chikusa-ku, Nagoya, Aichi 464-8602, Japan
- 40
Hiroshima Astrophysical Science Center, Hiroshima University, 1-3-1 Kagamiyama, Higashi-Hiroshima, Hiroshima 739-8526, Japan
- 41
Department of Physics, The University of Hong Kong, Pokfulam, Hong Kong
- 42
Department of Astronomy and Astrophysics, Pennsylvania State University, University Park, PA 16802, USA
- 43
Université Grenoble Alpes,CNRS,IPAG,38000 Grenoble,France
- 44
Center for Astrophysics | Harvard & Smithsonian, 60 Garden St, Cambridge, MA 02138, USA
- 45
INAF Osservatorio Astronomico di Brera, Via E. Bianchi 46, 23807 Merate (LC), Italy
- 46
Dipartimento di Fisica e Astronomia, Università degli Studi di Padova, Via Marzolo 8, 35131 Padova, Italy
- 47
Mullard Space Science Laboratory, University College London, Holmbury St Mary, Dorking, Surrey RH5 6NT, UK
- 48
Anton Pannekoek Institute for Astronomy & GRAPPA, University of Amsterdam, Science Park 904, 1098 XH Amsterdam, The Netherlands
- 49
Guangxi Key Laboratory for Relativistic Astrophysics, School of Physical Science and Technology, Guangxi University, Nanning 530004, China