Laser-driven first-order spin reorientation and Verwey
phase transitions
in the magnetite Fe3O4
beyond the range of thermodynamic equilibrium
Preprint: APS/123-QED
Abstract
Ultrafast photo-induced phase transitions occurring under the impact of femtosecond laser pulses provide versatile opportunities for switching solids between distinctly-different crystalline, electronic, and magnetic states and thus modify their functional properties in a significant way. In this paper, we report on the laser-induced spin reorientation and Verwey phase transitions in a single crystalline ferrimagnetic magnetite Fe3O4. Using femtosecond optical and magneto-optical pump-probe techniques, we define the range of the initial sample temperatures and laser fluences when partial or complete photo-induced phase transitions occur from a monoclinic insulating to a cubic metallic state with concomitant switching of magnetic anisotropy from the uniaxial to the cubic one. We thus reveal a connection between these phase transitions when driven by femtosecond laser pulses. Using transient linear and quadratic magneto-optical effects, we examine magnetization dynamics launched the switching of the magnetic anisotropy axis. We unveil the presence of the domains undergoing the laser-induced phase transitions even below the established threshold fluence for the transitions, as well as when the material is initially in the cubic phase. This is the manifestation of the first-order of these both laser-induced phase transitions beyond the range of thermodynamic equilibrium.
I Introduction
Solid-solid phase transitions can lead to significant changes of particular material parameters under moderate stimuli. Electronic, structural, magnetic and ferroelectric phase transitions and related changes of electronic conductivity, crystal structure, magnetic and ferroelectric ordering offer an opportunity to create functional elements for memories Wuttig and Yamada 2007, neuromorphic computing Yi et al. 2018, nanoactuators Ma et al. 2018, smart windows Chen et al. 2019; Huang et al. 2012, field-effect transistors Li et al. 2011; Shukla et al. 2015; Ahn et al. 2003, sensors Hu et al. 2010. Due to such a diversity of potential applications, identification of stimuli for switching materials between different phases with the highest efficiency in terms of energy consumption and timescale is an essential task. Clearly, pico- and femtosecond laser pulses in optical, infrared, and terahertz ranges are unmatched stimuli for phase transitions, allowing both switching between the different states at the comparable timescale and for studying dynamics of various medium subsystems during such a conversion.
The task of revealing involved mechanisms of photo-induced phase transitions is hindered by highly-nonequilibrium nature of the state of matter occurring during and directly after the excitation, and often involving hidden and metastable phases unknown in equilibrium Wegkamp and Stähler 2015; Ichikawa et al. 2011; De Jong et al. 2013. Furthermore, a spatial inhomogeneity of the excitation and of an emerging new phase also plays a crucial role and affects how the system as a whole is switched between the different phases Li et al. 2022; Dolgikh et al.; Ju et al. 2004.
Among numerous materials with phase transitions, magnetite Fe3O4 occupies a unique place possessing linked electronic and structural Verwey Verwey 1939 and spin-reorientation (SR) transitions Bickford Jr 1953; Belov et al. 1976, relying on quenching of charge- and orbital ordering as the temperature exceeds a range of 123–130 K Lorenzo et al. 2008; Senn et al. 2012. It has been already shown that the photo-induced Verwey transition from a monoclinic insulating phase to a cubic metallic phase in Fe3O4 is non-thermal at an early, subpicosecond, stage De Jong et al. 2013, and the role of laser-induced heating consists in stabilizing the latter phase. On the other hand, photo-induced SR transition when the magnetic anisotropy changes from uniaxial to cubic and the anisotropy axes reorient by , is still to be demonstrated. If the link between Verwey and SR transitions still holds for the photo-induced transitions, such a change of magnetic anisotropy would also occur at subpicosecond timescale. The latter would distinguish photo-induced SR transition in magnetite from those demonstrated in a group of rare-earth orthoferrites Kimel et al. 2004; de Jong et al. 2012; Afanasiev et al. 2016, with SR transition time exceeding several picoseconds due to slow response of the rare-earth subsystem to the excitation de Jong et al. 2011.
In this Article we report on the time-resolved optical and magneto-optical study of excitation of a single crystalline magnetite sample with femtosecond near infrared laser pulses in a temperature range of 80–180 K below and above transitions temperature. By examining laser fluence and temperature dependence of transient reflectivity and linear polar (PMOKE) and quadratic (QMOKE) magneto-optical Kerr effects, we reveal coupled photo-induced Verwey and SR transitions with the same fluence and temperature thresholds. Remarkably, photo-induced magnetization precession with the frequency characteristic of a cubic phase, being a signature of the SR transition, is found in the whole studied range of temperatures, as well as upon laser excitation with the fluence below threshold required to heat the sample up to the transition temperature. Comparison of PMOKE and QMOKE transients reveals that there is extended range of laser fluences and sample temperatures, where the photo-induced transition occurs in separate domains of material, which highlights the first-order of these phase transitions beyond the range of thermodynamic equilibrium.
This Article is organized as follows. In Sec. II we discuss the main properties of magnetite, Verwey and SR phase transitions, introduce the sample and outline the experimental strategy. Sec. III presents the experimental data on laser-induced dynamics of reflectivity and magneto-optical effects, which allows identifying photo-induced Verwey and SR transitions. In Sec. IV we discuss the experimental results and show how the features of photo-induced SR transition can be extracted from the comparative analysis of the PMOKE and QMOKE transients. In Conclusions we summarize our findings and suggest an outlook of further development of studies of photo-induced SR transition in magnetite.
II Sample and experimental details
The magnetite Fe3O4 at a room temperature is in the spinel type cubic crystal structure with the number of molecular units in the crystallographic unit cell Fleet 1981. Magnetite is a ferrimagnet with a high Curie temperature 860 K. A characteristic feature of magnetite is the presence of tetrahedral and octahedral positions in the unit cell, which can both be occupied by Fe3+(3d5) and Fe2+(3d6) cations. In fact, the possibility of magnetic ions to occupy both types of positions changes with temperature, thus determining many of the properties of magnetite, and the presence of structural and magnetic phase transitions Verwey 1939; Iizumi et al. 1982; Lorenzo et al. 2008.
Below room temperature, Fe3O4 possesses two phase transitions. The first-order structural insulator-to-metal transition from monoclinic (space group 2) to cubic (space group ,) phase known as a Verwey transition occurs at K Verwey 1939. An important consequence of this process is an abrupt increase of conductivity by about two orders of magnitude that allows to trace equilibrium and ultrafast Verwey transition, in particular, by measuring static and laser-induced transient reflectivity changes Sokoloff 1971; Rlinger and Samokhvalov 1977; De Jong et al. 2013.
The magnetocrystalline anisotropy is intrinsically linked to the crystal structure symmetry. Below , in the monoclinic phase, magnetite possesses uniaxial anisotropy with the easy magnetization axis lying along the crystallographic direction, as shown in Fig. 1 (a). Above , magnetite is characterized by a cubic magnetocrystalline anisotropy. Anisotropy energy is expressed as Calhoun 1954:
| (1) |
where , are the uniaxial, are the cubic anisotropy parameters, and are the directional cosines of the magnetization vector with respect to the monoclinic and cubic axes, respectively. In the temperature range of 123–130 K, parameters and are positive and the easy axes are oriented along the crystallographic directions Bickford et al. 1957. At K, the anisotropy constants change sign that results in a SR transition marked by reorientation of the easy axes to the cube diagonals Muxworthy and McClelland 2000 as illustrated in Fig. 1 (a). Equilibrium and laser-induced SR transitions can thus be detected by tracing magnetization orientation by means of magneto-optical effects.
Bulk single crystal Fe3O4 was grown by the floating zone method Balbashov and Egorov 1981. A 1-mm thick plane parallel plate was cut perpendicularly to the crystallographic axis (in the cubic phase) and polished to optical quality. This sample orientation was chosen because in the cubic phase the plane contains two axes and [001] axis as well as -axis in the monoclinic phase, i.e. the SR transition occurs in this plane, given the presence of a demagnetizing field , as illustrated in Fig. 1 (a).
The laser-induced phase transitions in a bulk sample of magnetite were studied using a femtosecond two-color magneto-optical pump-probe technique. Pump and probe pulses with duration 170 fs were emitted by Yb3+:KGd(WO4)2 regenerative amplifier at a repetition rate of 100 kHz. Pump pulses with a central photon energy 1.2 eV were focused normally to the sample surface into an area with a diameter of 80 m. Probe pulses with double photon energy are focused into the spot with a diameter of 25 m at an incidence angle of 45∘. The pump fluence was varied in a range of 0.7–11 mJ/cm2, exceeding probe fluence by up to 50 times. Pump-induced reflectivity change and magneto-optical rotation of the probe polarization were measured as a function of pump-probe time delay to monitor laser-induced Verwey and SR transitions, respectively.
Experiments were performed at the sample temperature in a range of 80–180 K. The external magnetic field 50–250 mT was applied in the sample plane along the cubic crystallographic axis and close to the monoclinic axis. Cooling the sample down below and was carried out in an external field mT applied along the same direction which suppresses emergence of structural domains in the monoclinic phase with orthogonal orientations of axes Bickford Jr 1953.
In order to characterize magnetic anisotropy of the sample at equilibrium, probe polarization rotation was measured at different temperatures as a function of an external magnetic field without pump excitation [Fig. 1 (b)]. In our experimental geometry with equilibrium in-plane orientation of magnetization, was determined by the magnetization component along the field via longitudinal magneto-optical Kerr effect Zvezdin and Kotov 1997. Hysteresis loops measured at K and 145 K correspond to the magnetization easy-axis directed along -axis in monoclinic phase and along in cubic phase, respectively [Fig. 1 (b)]. Noticeably, at intermediate temperatures the dependence on represents the superposition of these two types of hysteresises. This indicates the coexistence of phases with uniaxial and cubic anisotropies in a wide temperature range in agreement with the first-order of phase transitions Kukreja et al. 2018.
For further characterization, ferromagnetic resonance (FMR) absorption measurements were performed using the vector-network analyzer method Kalarickal et al. 2006; Maksymov and Kostylev 2015; Neudecker et al. 2006. Absorption maps were obtained as a series of frequency sweeps measured at fixed magnetic field. The sample was placed on the coplanar waveguide attached to the cold finger of the cryostat. The response of the system is studied by analyzing the transmitted microwave signal S21 [Fig.1 (c, d)]. The signal from the sample was normalized on the response from the waveguide. The external magnetic field was applied as described above, i.e. in the sample plane along the cubic [001] crystallographic axis.

III Results
First we verify that the Verwey transition is induced in the sample by the pump pulses. Figure 2 (a) shows typical laser-induced reflectivity change measured as a function of pump-probe time delay for three values of pump fluence at the initial sample temperature K well below . Abrupt change of reflectivity followed by slow relaxation is typical for the ultrafast Verwey transition De Jong et al. 2013; Lysenko et al. 2006. Laser-induced change at ns is plotted as a function of pump fluence in Fig. 2 (b). There are two features marked with vertical dashed lines, at which the slope of changes. Such a nonlinear behaviour of is a clear indication of the laser-induced first-order insulator-to-metal transition and typically interpreted as follows.
At fluences below the threshold mJ/cm2, the transient reflectivity is dominated by the optical response of the material which remains in a low-temperature phase. In a range between and saturation fluence mJ/cm2, the superlinear increase indicates that the increasing fraction of the excited material switches to the cubic metallic phase and gives rise to the reflectivity change Randi et al. 2016. Above , the response is dominated by material which experienced laser-induced phase transition. We note that the threshold and saturation fluences are in a good agreement with the literature data Pontius et al. 2011a.

Also, laser-induced reflectivity change at various initial sample temperatures was measured with the fixed pump fluence mJ/cm2 [Fig. 2 (c)]. Temperature dependence of demonstrates two features as well [Fig. 2 (d)]. Increase of the slope of at K suggests that starting from this temperature fraction of material, switched to the metallic phase, starts to contribute to the transient reflectivity signal, i.e. decreases down to 1.6 mJ/cm2 at this temperature. The second feature coincides with K. As exceeds the slope of becomes negative, and the underlying picture of this is discussed below.
In order to demonstrate ultrafast pump-induced SR transition in magnetite we measured transient magneto-optical response to the laser excitation. Typical signals measured in the external field mT are shown in Fig. 3 (b). Field dependence of the frequency of the observed oscillations indicates that there is a magnetization precession triggered by pump pulses [Fig. 3 (c)]. In our experimental geometry, measured probe polarization change is sensitive to oscillations of both in-plane (IP) and perpendicular-to-plane (PP) magnetization components via QMOKE and PMOKE, respectively, as illustrated in Fig. 3 (a). We note that linear and quadratic MOKE in a ferrimagnet Fe3O4 can be comparable, as was indeed reported for the probe photon energy Silber et al. 2018.
Taking into account that QMOKE and PMOKE are even and odd effects with respect to magnetization reversal, respectively, we distinguish contributions from oscillations of the IP () and PP () components of magnetization to the measured rotation as . Thus obtained both show oscillatory behaviour and are fitted with the exponentially damped sine-function [Fig. 3 (d)]:
| (2) |
where , , and are the amplitude, frequency, damping time and initial phase of the oscillations, respectively, stands for PP, IP.
In Fig. 4 parameters of oscillations and measured at K are plotted as a function of pump fluence in a range of 0.7–11 mJ/cm2. Note, that in the whole range of fluences, frequencies [Fig. 4 (c)], while initial phases differ by [Fig. 4 (f)], thus confirming that and stem from oscillations of the PP and IP components of magnetization [Fig. 3 (a, d)].

Importantly, there is a qualitative correspondence between fluence dependences of the reflectivity transient change and of some of the oscillations parameters. To highlight it, we plot in Fig. 4(b) the fitting curve of alongside with the oscillations amplitude, and show corresponding ranges and in the fluence dependences of all the parameters in Fig. 4. First, when pump fluence exceeds , amplitudes , their ratio , damping time and frequency are independent from . In the range there is a linear growth of , similarly to , whereas the precession frequency changes only slightly. Such behaviour agrees in general with the laser-induced SR transition. When pump fluence becomes sufficient for SR transition, magnetization precession is triggered due to switching of magnetic anisotropy axis from the -axis to the cubic direction. Herewith, increase and saturation of the amplitude is associated with a gradual increase of the probed material fraction where SR transition occurred until it reaches 100 %.
However, in the range of pump fluence between and there is also a growth of [Fig. 4 (d)]. This is related to the fact that and vary with pump fluence differently [Fig. 4 (b)]. Even more intriguing result is seen at when reflectivity data are dominated by the optical response of the insulating phase [Fig. 2 (b)]. grows much faster with than , and the dependence can be extrapolated down to [Fig. 4 (b)], showing no threshold behaviour. Furthermore, the precession frequency in this range remains the same as at the higher fluences showing no features when is swept through , while initial phase and the damping time significantly change [Fig. 4 (f, e)].
We have also obtained pump-probe signals at different with a fixed fluence which is below at K. Fig. 5 summarizes oscillation parameters as a function of . Similarly to the fluence dependence, there is nontrivial behaviour of the amplitudes, damping times and initial phases below , while varies only weakly.
These observations naturally rise a question on the origin of the precession excited by pump pulses with fluence below at low temperatures, on the interpretation of results at as the manifestation of the laser-induced SR transition, as well as on the mechanism undelying the precession excitation at .

IV Discussion
IV.1 Precession frequency as a fingerprint
of a laser-induced SR transition
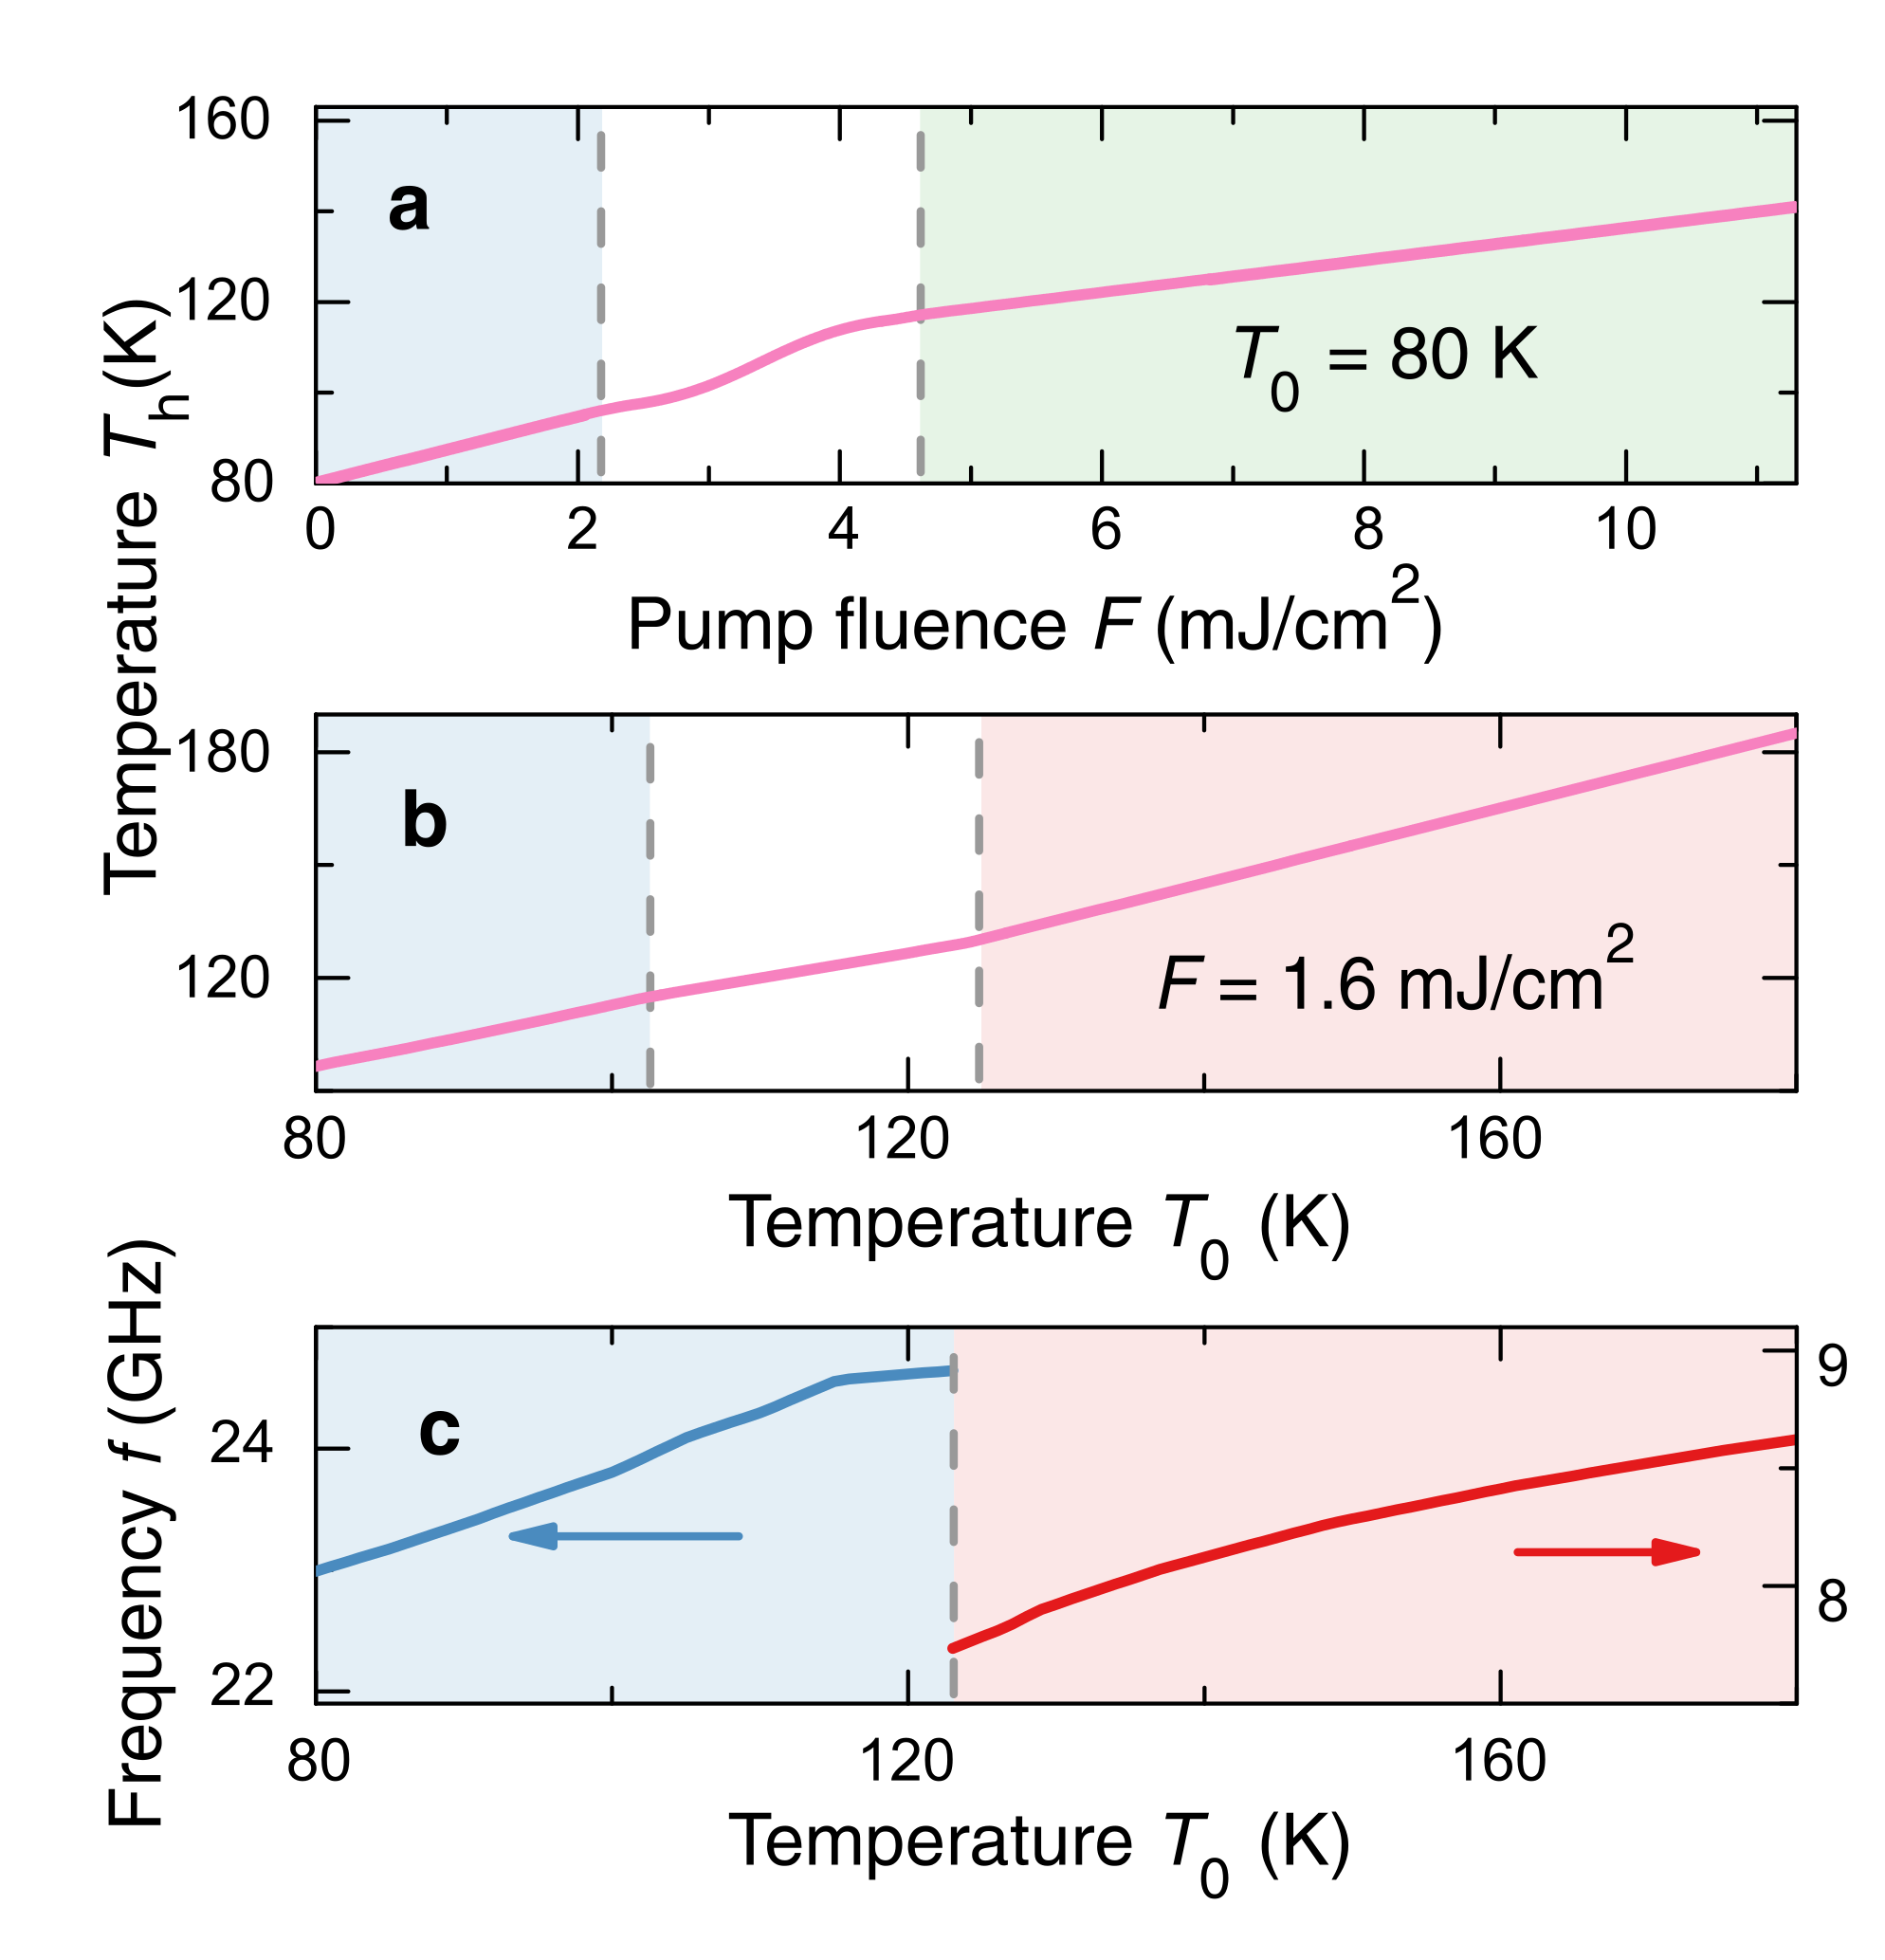
Experimental results of laser-induced reflectivity change, in particular, presence of the threshold and saturation fluences, suggest that the laser-induced heating is responsible for stabilizing the laser-induced metallic cubic phase De Jong et al. 2013; Park et al. 1998. Using literature data on latent heat Matsui et al. 1977 and specific heat capacities for metallic and insulator phases of magnetite Westrum Jr and Grønvold 1969, the temperature increase and the resulting temperature were calculated Mogunov et al. 2020 as a function of at K (See App. A and Fig. 7 (a) therein). According to that, pump fluence exceeding is sufficient for stabilizing cubic metallic phase emerged because of laser-induced Verwey transition. Slow relaxation of indicates that the sample remains in the laser-induced phase longer than 1 ns. Thus, we can use the frequency of the excited precession as a fingerprint for identifying particular magnetic phase state of the sample within this time range after the excitation.
In order to illustrate this, we show in Fig.1 (c, d) FMR frequency as a function of external magnetic field measured at equilibrium at and K. As shown in Fig. 4 (c) and Fig. 5 (c), precession frequency in the pump-probe experiment in the whole fluence and temperature ranges is close to the above , i.e. in the cubic phase. Note, the frequency in the monoclinic phase is expected to be twice as high, as was calculated using anisotropy parameters from Bickford et al. 1957; Abe et al. 1976 (See App. B and Fig. 7 (c) therein). At mT and K, it exceeds GHz available in the FMR experiments [Fig. 1 (c)]. Thus, the frequency of the observed precession clearly indicates that SR transition takes place even when the sample is excited at =80 K with low-fluence pulses insufficient for heating above the transitions temperatures. On the other hand, experimental data on the ratio , the decay time and the initial phases [Figs. 4 (d-f)] reveal that there is a difference between precession excited at and , despite similar precession frequency observed in the whole laser fluence range.
Absence of the laser-induced precession with frequency corresponding to the low-temperature uniaxial state can be understood from the following arguments. The direction of the easy magnetization axis in the low-temperature phase coincides with the applied external field. This along with a strong uniaxial anisotropy ensures that no magnetization precession is excited by the laser pulses unless the SR transition is induced. Thus, presence of the oscillations in the MOKE signal suggests that precession is excited only in the fraction of the material undergoing laser-induced SR transition.
IV.2 Three regimes of SR transition
at various pump fluences

We argue that our experimental observations are the manifestation of peculiarities of laser-induced SR transition being the first-order at equilibrium. At K and , the precession excitation can be described as follows. Before the excitation, magnetization orientation is defined by the effective field directed close to the axis, where is the uniaxial anisotropy field. Laser pulse causes ultrafast Verwey transition and, thus, switching of the crystal structure to the cubic phase, which is stabilized by the laser-induced heating above De Jong et al. 2013; Pontius et al. 2011b. Structural transition is accompanied by the change of magnetic anisotropy to the cubic one. Since is just a few Kelvin above , change sign, and the anisotropy field reorients to one of axes lying in the sample plane, e.g. to . As a result, there is a PP torque . The torque triggers the precession of magnetization around , where . Initial phases of the oscillations of the PP and IP components are and , respectively, in agreement with experimental observations [Fig. 6 (a)].
Even at stable domains with cubic magnetic anisotropy are present within host with uniaxial anisotropy, as evident from the static hysteresis loops [Fig. 1 (b)]. This suggests that the below-threshold excitation can still yield emergence of the domains of a cubic phase within the monoclinic host although laser-induced heating is . These domains are expected to be isolated from each other, and thus possess the easy magnetization axes along either of the four cubic axes in the sample plane or at an angle to it. Thus, laser-induced precession in the different domains is then triggered with a different initial phase:
| (3) |
where is the precession ellipticity, stands for a particular domain, and is the precession amplitude given by an angle by which total effective field reorients as a result of SR transition. Integer number depends on the particular cubic axis which sets . for domains with cubic axis oriented in the sample plane (at an angle to it) with the corresponding laser-induced torque () as illustrated in Fig. 6 (a, b).
In the experiment, measured signal is integrated over the large area of the sample. Precession with different initial phases in different domains contribute to yielding very low value of and intermediate initial phase of oscillations . Contributions of the precession in different domains to add up resulting in non-vanishing value of observed even at low values of [Fig. 4 (a)] and to the intermediate initial phase of oscillations. Such averaging also explains faster decay at being a result of dephasing of precession in different domains and of the enhanced damping within them Józsa 2006; Barman and Barman 2009.
Onset of increase of and at the fluence [Fig. 4 (d, e)] and the change of to [Fig. 4 (f)] suggests that ever increasing areas and networks where SR transition occurs start to contribute to the magneto-optical response instead of isolated domains Hilton et al. 2007; Cocker et al. 2012. This leads to an increase of a precession damping time in the range . Increase of along with the switching of the close to shows that the magnetization precession within the probed spot is mostly in-phase and the laser-induced magnetic anisotropy axis is along one particular axis in the sample plane [Fig. 6 (a)]. At any of the studied , the whole excited and probed volume experiences laser-induced SR transition, leading to saturation of the parameters of transients. is then defined by the precession ellipticity and the magneto-optical parameters responsible for PMOKE and QMOKE.
IV.3 Three regimes of SR transition
at various sample temperatures
Joint analysis of the evolution of the transients parameters with the initial temperature enables to identify three regimes of laser-induced dynamics. At the fixed laser fluence mJ/cm2, temperature ranges and correspond to the same regimes of laser-induced SR transition, as those seen at the fixed at and , respectively.
Interestingly, our data suggest that even at the precession is excited due to laser-induced SR transition. Indeed, along with the laser-induced SR transition, precession can be triggered by the laser-induced thermal change of magnetic anisotropy parameters while the material remains in the same phase Shelukhin et al. 2018. Below , laser-induced changes of the uniaxial anisotropy parameters as a mechanism of the precession excitation can be ruled out, since the precession frequency corresponds to the cubic phase (see Sec. III). However, the question arises on the mechanism of the precession excitation at . We ascribe it to the SR transition in remaining metastable monoclinic domains. For this we put forward the following arguments.

In the range of K absolute value of the magnetocrystalline constant increases with temperature, as illustrated in Fig. 6 (f) following Abe et al. 1976. Since laser-induced heating does not exceed 40 K for any fluence used in the experiment (see App. A), increase of upon laser excitation is the case for measurements in the whole range of initial temperatures. As a result, reorientation of due to the laser-induced change of and SR transition would occur in the same way, as shown in Fig. 6 (a, c), leading to the same phase of precession excited by these two mechanisms. However, a simple geometrical analysis shows that the temperature dependences of the amplitude of the precession excited via these two mechanisms are expected to be drastically different. Indeed, precession amplitude is set by the angle between direction of effective field before and after excitation (Fig. 6). At any of studied , const [see App. A and Fig. 7 (b)]. Due to nearly linear dependence of on temperature in the range K [Fig. 6 (f)], the angle between and should also be nearly independent from . Thus, the amplitude of precession excited above via laser-induced change of should vary with temperature only weakly.
On the other hand, the amplitude of the observed oscillations triggered by SR transition is dictated by the amount of metastable domains remaining in the monoclinic phase , in which transition can occur. decreases with temperature leading to reduction of the precession amplitude excited due to the SR transition. In Fig. 5 (b) one can see that precession amplitude significantly decreases with temperature at indicating that underlying mechanism of excitation is the laser-induced SR transition in these metastable domains. Such scenario accounts well also for the decrease of with temperature in the same range [Fig. 2 (d)].
Further confirmation of the SR transition responsible for the precession observed at is provided by the temperature dependences of obtained at low mJ/cm2 and high mJ/cm2 pump fluence. As can be seen in Fig.6 (e), both amplitudes show exponential decrease, which is faster at higher excitation fluence. Excitation with a pulse of the higher fluence would affect the amount of monoclinic metastable domains available for SR transition as follows. Each excitation event leads to a heating-cooling cycle , with . At the heating stage, SR transition occurs in some domain. At the cooling stage, they remain in cube phase. As a result of such a cycle, the number of monoclinic domains would decrease [Fig. 6 (d)]. Upon excitation with the next pulse, a lesser number of monoclinic domains is available for laser-induced SR transition. At the higher excitation fluence, , decrease of in each heating-cooling cycle is even more pronounced. Therefore, at each , averaged over many excitation events appears to be lower at higher pump fluences. This may account for the observed faster decrease of with at higher fluences [Fig. 6 (d)]. In contrast, in the case of excitation via change of in the cubic phase, heating-cooling cycles do not affect the initial state of the system [Fig. 6 (f)]. As a result, increase of the pump fluence would result just in the increase of the detected amplitude and would not affect the rate with which changes with .
We note, that the FMR linewidth in magnetite has been reported to narrow down as the equilibrium transition occurs concomitantly with decrease of the FMR frequency Srivastava et al. 2020. However, in our pump-probe experiments only the damping time changes with fluence or temperature, indicating a different origin of the damping at low fluences and temperatures related to the spatial inhomogeneity of laser-induced SR transition under such conditions. We also note that the laser-driven precession associated with the first-order transition, Morin point, has been reported in dysprosium orthoferrite and also showed nontrivial dependence of the precession damping on the laser pulse fluence Afanasiev et al. 2016. However, in orthoferrites the damping of the precession was found to be correlated with the timescale of the transition in the orthoferrite, which is intrinsically limited to picosecond range and thus can be traced by precessional reorientation of the magnetization towards the new equilibrium axis. In magnetite, timescale of the SR transition appears to be well below the resolution of our experiment and clearly happens faster than the half a period of the precession, ps. Given the subpicosecond timescale of the crystal and electronic structure switching De Jong et al. 2013, the initial change of the magnetic anisotropy can have similar speed.
V Conclusion
In conclusions, we have demonstrated laser-induced magnetization precession in bulk single crystal magnetite, and have shown that the underlying mechanism of the excitation is the switching of anisotropy axis due to ultrafast SR transition. This expands our knowledge about response of this iron oxide to ultrafast optical excitation, along with earlier demonstrated insulator-metal and structural, i.e. Verwey, transition. We found that SR transition can be triggered even by laser pulse with a fluence mJ/cm2, i.e. below the threshold for the laser-induced heating required for material to overcome the transition temperature. Furthermore, signatures of photo-induced SR transition are present in a wide range of initial sample temperatures both below and above transition temperature. Joint detection of the precession via transient linear and quadratic magneto-optical effects reveal that under such conditions the photo-induced transition occurs in separate domains, signifying the first-order character of it taking place also beyond the thermal equilibrium. Revealing such broad range of conditions supporting photo-induced transitions was elusive in the transient reflectivity measurements.
Importantly, we show that there is a striking similarity in the threshold and saturation fluences and threshold sample temperatures for the Verwey and SR transition, suggesting their intrinsic link to the same driving mechanism. The latter for the case of Verwey transition was shown in to be a subpicosecond melting of specific charge and orbital ordering - trimerons, i.e. Fe3+-Fe2+– Fe3+ complexes De Jong et al. 2013. Thus, our results sets up a basis for further studies aiming at revealing timescale of magnetic anisotropy change in Fe3O4. Such research could rely, e.g., on joint X-ray study of femtosecond dynamics of spin and orbital momenta Boeglin et al. 2012. In our experiments, we used the ferromagnetic mode of the magnetization precession as a fingerprint of the photo-induced magnetic transition, which is intrinsically slow in low applied magnetic fields and thus hinders realistic timescale of the anisotropy change. Examining ultrafast SR in thin and ultrathin magnetite films readily available by a pulsed laser deposition technique Suturin et al. 2018 may provide access to shorter timescales via observing higher-order laser-induced standing spin-wave modes Scherbakov et al. 2019.
Acknowledgements.
Single crystals of magnetite were grown by A. M. Balbashov. We thank I. V. Karpovskii for fruitful discussions. This work was done with partial financial support of the Russian Foundation for Basic Research (grant No. 20-02-00938).Appendix A Calculation of the laser-induced heating
Using data from the literature on latent heat = 0.85 mJ/cm3 Matsui et al. 1977 and specific heat capacities for the metallic and insulating phases of magnetite Westrum Jr and Grønvold 1969, the temperature increase and the resulting temperature were calculated Mogunov et al. 2020 as a function of pump fluence (at K) and of the initial temperature of magnetite (at =1.6 mJ/cm2).
For calculations, volumetric absorbed pump energy density was founded from the incident fluence as
| (4) |
where stands for the insulating or metallic properties of the material at a particular . = 0.15 and = 0.27 are a reflection coefficients and = 0.72105 cm-1 are the absorption coefficients of magnetite at the pump photon energy Schlegel et al. 1979. Threshold J/m3 and saturation energy densities J/m3 are found from the corresponding fluences .
For the temperatures below and fluences below the threshold, , the temperature increase was calculated as
| (5) |
where J/(m3K) is a volumetric heat capacity at K. For the pump fluences above the saturation threshold, , we consider that the absorbed pump energy firstly drives the phase transition () and the rest of it heats the material in the metallic phase:
| (6) |
where J/(m3K) is a volumetric heat capacity at K.
At the intermediate fluences both fractions of material, the one remaining in insulating phase and that experiencing the transition, contribute to heating. The temperature increase is found as Mogunov et al. 2020:
| (7) |
where
| (8) |
| (9) |
are weight factors of contributions from the insulator and metal phases. In the calculations, values =, ==/10, were used.
Figure 7 (a) shows the dependence of the heating temperature on the pump fluence at initial temperature 80 K calculated using the formulas described above.
Using dependences of the reflection coefficient Schlegel et al. 1979 and volumetric heat capacity on temperature, the heating of the magnetite was calculated with the same formulas for different temperatures at fixed pump fluence 1.6 mJ/cm2 [Fig. 7(b)]. In calculations we assumed that linearly decreases from 2.2 mJ/cm2 at 80 K down to 1.6 mJ/cm2 at .
Appendix B Calculation of the FMR frequency
Ferromagnetic resonance frequency in magnetite at different temperatures was calculated with the Smit-Suhl approach Gurevich and Melkov 1996:
| (10) |
where the gyromagnetic ratio is taken according to the reported value of the factor Bickford Jr 1950. , , , at equilibrium direction of and .
Below Verwey transition, , magnetite is a monoclinic crystal and has a uniaxial anisotropy. At , magnetite structure is cubic and it possesses the corresponding magnetic anisotropy. Magnetization dependent part of free energy is written as:
| (11) |
where are the leading uniaxial anisotropy parameters, are the cubic anisotropy parameters, is the Zeeman energy. and are azimuthal and polar angles of magnetization.
Figure 7 (c) shows the FMR frequencies as a function of the sample temperature calculated for the field mT applied along the axis. As expected, the FMR frequency is at least twice as high in the low-temperature phase as compared to the high-temperature phase, in agreement with experimental data [Fig. 1 (c, d)]. We note some discrepancy between measured and calculated data, which may stem from somewhat different anisotropy parameters of the studied sample and a possible effect of the demagnetizing fields on the FMR frequency. Nevertheless, calculations confirm the experimentally observed disappearance of the low-frequency FMR peak as the temperature becomes lower than .
References
- Wuttig and Yamada (2007) M. Wuttig and N. Yamada, Phase-change materials for rewriteable data storage, Nature Materials 6, 824 (2007).
- Yi et al. (2018) W. Yi, K. K. Tsang, S. K. Lam, X. Bai, J. A. Crowell, and E. A. Flores, Biological plausibility and stochasticity in scalable VO2 active memristor neurons, Nat. Commun. 9, 4661 (2018).
- Ma et al. (2018) H. Ma, X. Zhang, R. Cui, F. Liu, M. Wang, C. Huang, J. Hou, G. Wang, Y. Wei, K. Jiang, L. Pan, and K. Liu, Photo-driven nanoactuators based on carbon nanocoils and vanadium dioxide bimorphs, Nanoscale 10, 11158–11164 (2018).
- Chen et al. (2019) S. Chen, Z. Wang, H. Ren, Y. Chen, W. Yan, C. Wang, B. Li, J. Jiang, and C. Zou, Gate-controlled VO2 phase transition for high-performance smart windows, Sci. Adv. 5, eaav6815 (2019).
- Huang et al. (2012) Z. Huang, S. Chen, C. Lv, Y. Huang, and J. Lai, Infrared characteristics of VO2 thin films for smart window and laser protection applications, Appl. Phys. Lett. 101, 191905 (2012).
- Li et al. (2011) W. Li, J. Zhu, J. Liang, Z. Hu, J. Liu, H. Chen, and J. Chu, External electric field manipulations on structural phase transition of vanadium dioxide nanoparticles and its application in field effect transistor, J. Phys. Chem. C 115, 23558 (2011).
- Shukla et al. (2015) N. Shukla, A. V. Thathachary, A. Agrawal, H. Paik, A. Aziz, D. G. Schlom, S. K. Gupta, R. Engel-Herbert, and S. Datta, A steep-slope transistor based on abrupt electronic phase transition, Nat. commun. 6, 1 (2015).
- Ahn et al. (2003) C. H. Ahn, J.-M. Triscone, and J. Mannhart, Electric field effect in correlated oxide systems, Nature 424, 1015 (2003).
- Hu et al. (2010) B. Hu, Y. Ding, W. Chen, D. Kulkarni, Y. Shen, V. V. Tsukruk, and Z. L. Wang, External-strain induced insulating phase transition in VO2 nanobeam and its application as flexible strain sensor, Advanced Materials 22, 5134 (2010).
- Wegkamp and Stähler (2015) D. Wegkamp and J. Stähler, Ultrafast dynamics during the photoinduced phase transition in VO2, Progress in Surface Science 90, 464 (2015).
- Ichikawa et al. (2011) H. Ichikawa, S. Nozawa, T. Sato, A. Tomita, K. Ichiyanagi, M. Chollet, L. Guerin, N. Dean, A. Cavalleri, S.-i. Adachi, T.-h. Arima, H. Sawa, Y. Ogimoto, M. Nakamura, R. Tamaki, K. Miyano, and S.-y. Koshihara, Transient photoinduced ‘hidden’ phase in a manganite, Nat. Materials 10, 101 (2011).
- De Jong et al. (2013) S. De Jong, R. Kukreja, C. Trabant, N. Pontius, C. F. Chang, T. Kachel, M. Beye, F. Sorgenfrei, C. H. Back, B. Bräuer, et al., Speed limit of the insulator–metal transition in magnetite, Nat. mater. 12, 882 (2013).
- Li et al. (2022) G. Li, R. Medapalli, J. Mentink, R. Mikhaylovskiy, T. Blank, S. Patel, A. Zvezdin, T. Rasing, E. Fullerton, and A. Kimel, Ultrafast kinetics of the antiferromagnetic-ferromagnetic phase transition in FeRh, Nat. Commun. 13, 1 (2022).
- (14) I. A. Dolgikh, T. G. Blank, H. Li, K. H. S. Prabhakara, K. K. Patel, A. G. Buzdakov, R. Medapalli, E. E. Fullerton, O. V. Koplak, J. H. Mentink, K. A. Zvezdin, A. K. Zvezdin, P. C. M. Christianen, and A. V. Kimel, Ultrafast emergence of ferromagnetism in antiferromagnetic FeRh in high magnetic fields, arXiv:2202.03931 .
- Ju et al. (2004) G. Ju, J. Hohlfeld, B. Bergman, R. J. M. van de Veerdonk, O. N. Mryasov, J.-Y. Kim, X. Wu, D. Weller, and B. Koopmans, Ultrafast generation of ferromagnetic order via a laser-induced phase transformation in FeRh thin films, Phys. Rev. Lett. 93, 197403 (2004).
- Verwey (1939) E. J. W. Verwey, Electronic conduction of magnetite (Fe3O4) and its transition point at low temperatures, Nature 144, 327 (1939).
- Bickford Jr (1953) L. R. Bickford Jr, The low temperature transformation in ferrites, Rev. Mod. Phys. 25, 75 (1953).
- Belov et al. (1976) K. P. Belov, A. K. Zvezdin, A. M. Kadomtseva, and R. Z. Levitin, Spin-reorientation transitions in rare-earth magnets, Sov. Phys. Uspekhi 19, 574 (1976).
- Lorenzo et al. (2008) J. E. Lorenzo, C. Mazzoli, N. Jaouen, C. Detlefs, D. Mannix, S. Grenier, Y. Joly, and C. Marin, Charge and orbital correlations at and above the Verwey phase transition in magnetite, Phys. Rev. Lett. 101, 226401 (2008).
- Senn et al. (2012) M. S. Senn, J. P. Wright, and J. P. Attfield, Charge order and three-site distortions in the Verwey structure of magnetite, Nature 481, 173 (2012).
- Kimel et al. (2004) A. V. Kimel, A. Kirilyuk, A. Tsvetkov, R. V. Pisarev, and T. Rasing, Laser-induced ultrafast spin reorientation in the antiferromagnet TmFeO3, Nature 429, 850 (2004).
- de Jong et al. (2012) J. A. de Jong, I. Razdolski, A. M. Kalashnikova, R. V. Pisarev, A. M. Balbashov, A. Kirilyuk, T. Rasing, and A. V. Kimel, Coherent control of the route of an ultrafast magnetic phase transition via low-amplitude spin precession, Phys. Rev. Lett. 108, 157601 (2012).
- Afanasiev et al. (2016) D. Afanasiev, B. A. Ivanov, A. Kirilyuk, T. Rasing, R. V. Pisarev, and A. V. Kimel, Control of the ultrafast photoinduced magnetization across the Morin transition in DyFeO3, Phys. Rev. Lett. 116, 097401 (2016).
- de Jong et al. (2011) J. A. de Jong, A. V. Kimel, R. V. Pisarev, A. Kirilyuk, and T. Rasing, Laser-induced ultrafast spin dynamics in ErFeO3, Phys. Rev. B 84, 104421 (2011).
- Fleet (1981) M. E. Fleet, The structure of magnetite, Acta Crystallogr. B 37, 917 (1981).
- Iizumi et al. (1982) M. Iizumi, T. F. Koetzle, G. Shirane, S. Chikazumi, M. Matsui, and S. Todo, Structure of magnetite (Fe3O4) below the Verwey transition temperature, Acta Crystallogr. B 38, 2121 (1982).
- Sokoloff (1971) J. B. Sokoloff, Phenomenological molecular-field theory of the Mott-Wigner transition in magnetite, Phys. Rev. B 3, 3162 (1971).
- Rlinger and Samokhvalov (1977) M. I. Rlinger and A. A. Samokhvalov, Electron conduction in magnetite and ferrites, Phys. Status Solidi 79, 9 (1977).
- Calhoun (1954) B. A. Calhoun, Magnetic and electric properties of magnetite at low temperatures, Phys. Rev. 94, 1577 (1954).
- Bickford et al. (1957) L. Bickford, J. Brownlow, and R. Penoyer, Magnetocrystalline anisotropy in cobalt-substituted magnetite single crystals, Proceedings of the IEE-Part B: Radio and Electronic Engineering 104, 238 (1957).
- Muxworthy and McClelland (2000) A. R. Muxworthy and E. McClelland, Review of the low-temperature magnetic properties of magnetite from a rock magnetic perspective, Geophys. J. Int. 140, 101 (2000).
- Balbashov and Egorov (1981) A. M. Balbashov and S. K. Egorov, Apparatus for growth of single crystals of oxide compounds by floating zone melting with radiation heating, J. Cryst. Growth 52, 498 (1981).
- Zvezdin and Kotov (1997) A. K. Zvezdin and V. A. Kotov, Modern magnetooptics and magnetooptical materials (CRC Press, 1997).
- Kukreja et al. (2018) R. Kukreja, N. Hua, J. Ruby, A. Barbour, W. Hu, C. Mazzoli, S. Wilkins, E. E. Fullerton, and O. G. Shpyrko, Orbital domain dynamics in magnetite below the verwey transition, Phys. Rev. Lett. 121, 177601 (2018).
- Kalarickal et al. (2006) S. S. Kalarickal, P. Krivosik, M. Wu, C. E. Patton, M. L. Schneider, P. Kabos, T. J. Silva, and J. P. Nibarger, Ferromagnetic resonance linewidth in metallic thin films: Comparison of measurement methods, Journal of Applied Physics 99, 093909 (2006).
- Maksymov and Kostylev (2015) I. S. Maksymov and M. Kostylev, Broadband stripline ferromagnetic resonance spectroscopy of ferromagnetic films, multilayers and nanostructures, Physica E: Low-dimensional Systems and Nanostructures 69, 253 (2015).
- Neudecker et al. (2006) I. Neudecker, G. Woltersdorf, B. Heinrich, T. Okuno, G. Gubbiotti, and C. H. Back, Comparison of frequency, field, and time domain ferromagnetic resonance methods, Journal of Magnetism and Magnetic Materials 307, 148 (2006).
- Lysenko et al. (2006) S. Lysenko, A. Rua, V. Vikhnin, J. Jimenez, F. Fernandez, and H. Liu, Light-induced ultrafast phase transitions in VO2 thin film, Applied Surface Science 252, 5512 (2006).
- Randi et al. (2016) F. Randi, I. Vergara, F. Novelli, M. Esposito, M. Dell’Angela, V. Brabers, P. Metcalf, R. Kukreja, H. A. Dürr, D. Fausti, M. Grüninger, and F. Parmigiani, Phase separation in the nonequilibrium Verwey transition in magnetite, Phys. Rev. B 93, 054305 (2016).
- Pontius et al. (2011a) N. Pontius, T. Kachel, C. Schüßler-Langeheine, W. Schlotter, M. Beye, F. Sorgenfrei, C. Chang, A. Föhlisch, W. Wurth, P. Metcalf, et al., Time-resolved resonant soft x-ray diffraction with free-electron lasers: Femtosecond dynamics across the verwey transition in magnetite, Applied physics letters 98, 182504 (2011a).
- Silber et al. (2018) R. Silber, M. Tomíčková, J. Rodewald, J. Wollschläger, J.and Pištora, M. Veis, T. Kuschel, and J. Hamrle, Quadratic magnetooptic spectroscopy setup based on photoelastic light modulation, Photonics Nanostructures - Fundam. Appl. 31, 60 (2018).
- Park et al. (1998) S. K. Park, T. Ishikawa, and Y. Tokura, Charge-gap formation upon the verwey transition in Fe3O4, Phys. Rev. B 58, 3717 (1998).
- Matsui et al. (1977) M. Matsui, S. Todo, and S. Chikazumi, Specific heat and electrical conductivity of low temperature phase of magnetite, J. Phys. Soc. Jpn. 42, 1517 (1977).
- Westrum Jr and Grønvold (1969) E. F. Westrum Jr and F. Grønvold, Magnetite (Fe3O4) heat capacity and thermodynamic properties from 5 to 350 K, low-temperature transition, J. Chem. Thermodyn. 1, 543 (1969).
- Mogunov et al. (2020) I. A. Mogunov, S. Lysenko, A. E. Fedianin, F. E. Fernández, A. Rúa, A. J. Kent, A. V. Akimov, and A. M. Kalashnikova, Large non-thermal contribution to picosecond strain pulse generation using the photo-induced phase transition in VO2, Nat. Commun. 11, 1690 (2020).
- Abe et al. (1976) K. Abe, Y. Miyamoto, and S. Chikazumi, Magnetocrystalline anisotropy of low temperature phase of magnetite, J. Phys. Soc. Jpn. 41, 1894 (1976).
- Pontius et al. (2011b) N. Pontius, T. Kachel, C. Schüßler-Langeheine, W. F. Schlotter, M. Beye, F. Sorgenfrei, C. F. Chang, A. Föhlisch, W. Wurth, P. Metcalf, I. Leonov, A. Yaresko, N. Stojanovic, M. Berglund, N. Guerassimova, S. Düsterer, H. Redlin, and H. A. Dürr, Time-resolved resonant soft x-ray diffraction with free-electron lasers: Femtosecond dynamics across the Verwey transition in magnetite, Appl. Phys. Lett. 98, 182504 (2011b).
- Józsa (2006) C. Józsa, Optical detection of the magnetization precession, Eindhoven University of Technology (2006).
- Barman and Barman (2009) A. Barman and S. Barman, Dynamic dephasing of magnetization precession in arrays of thin magnetic elements, Phys. Rev. B 79, 144415 (2009).
- Hilton et al. (2007) D. J. Hilton, R. P. Prasankumar, S. Fourmaux, A. Cavalleri, D. Brassard, M. A. El Khakani, J. C. Kieffer, A. J. Taylor, and R. D. Averitt, Enhanced photosusceptibility near for the light-induced insulator-to-metal phase transition in vanadium dioxide, Phys. Rev. Lett. 99, 226401 (2007).
- Cocker et al. (2012) T. L. Cocker, L. V. Titova, S. Fourmaux, G. Holloway, H.-C. Bandulet, D. Brassard, J.-C. Kieffer, M. A. El Khakani, and F. A. Hegmann, Phase diagram of the ultrafast photoinduced insulator-metal transition in vanadium dioxide, Phys. Rev. B 85, 155120 (2012).
- Shelukhin et al. (2018) L. A. Shelukhin, V. V. Pavlov, P. A. Usachev, P. Y. Shamray, R. V. Pisarev, and A. M. Kalashnikova, Ultrafast laser-induced changes of the magnetic anisotropy in a low-symmetry iron garnet film, Phys. Rev. B 97, 014422 (2018).
- Srivastava et al. (2020) A. Srivastava, A. V. Singh, J. B. Mohammadi, C. Mewes, A. Gupta, and T. Mewes, Ferromagnetic resonance study of the Verwey phase transition of magnetite thin film on MgGa2O4(001) substrate, IEEE Trans. Magn. 56, 1 (2020).
- Boeglin et al. (2012) C. Boeglin, E. Beaurepaire, V. Halté, V. López-Flores, C. Stamm, N. Pontius, H. A. Dürr, and J.-Y. Bigot, Distinguishing the ultrafast dynamics of spin and orbital moments in solids, Nature 465, 458 (2012).
- Suturin et al. (2018) S. M. Suturin, A. M. Korovin, S. V. Gastev, M. P. Volkov, A. A. Sitnikova, D. A. Kirilenko, M. Tabuchi, and N. S. Sokolov, Tunable polymorphism of epitaxial iron oxides in the four-in-one ferroic-on-GaN system with magnetically ordered -, -, - Fe2O3, and Fe3O4 layers, Phys. Rev. Materials 2, 073403 (2018).
- Scherbakov et al. (2019) A. Scherbakov, A. Danilov, F. Godejohann, T. Linnik, B. Glavin, L. Shelukhin, D. Pattnaik, M. Wang, A. Rushforth, D. Yakovlev, A. Akimov, and M. Bayer, Optical excitation of single- and multimode magnetization precession in - nanolayers, Phys. Rev. Applied 11, 031003 (2019).
- Schlegel et al. (1979) A. Schlegel, S. F. Alvarado, and P. Wachter, Optical properties of magnetite (Fe3O4), J. Phys. C: Solid State Phys. 12, 1157 (1979).
- Gurevich and Melkov (1996) A. Gurevich and G. Melkov, Magnetization Oscillations and Waves (Taylor & Francis, 1996).
- Bickford Jr (1950) L. R. Bickford Jr, Ferromagnetic resonance absorption in magnetite single crystals*, Phys. Rev. B 78, 449 (1950).