Network Based Approach to Gene Prioritization at Genome-Wide Association Study Loci
Abstract
Motivation: Genome-wide association studies (GWAS) have successfully identified thousands of genetic risk loci for complex traits and diseases. Most of these GWAS loci lie in regulatory regions of the genome and the gene through which each GWAS risk locus exerts its effects is not always clear. Many computational methods utilizing biological data sources have been proposed to identify putative casual genes at GWAS loci; however, these methods can be improved upon.
Results: We present the Relations-Maximization Method, a dense module searching method to identify putative causal genes at GWAS loci through the generation of candidate sub-networks derived by integrating association signals from GWAS data into the gene co-regulation network. We employ our method in a chronic obstructive pulmonary disease GWAS. We perform
an extensive, comparative study of Relations-Maximization Method’s performance against
well-established baselines.
Availability: The code and the datasets used in this manuscript are available at the following website:
1 Introduction
Genome-wide associations studies (GWAS) have successfully identified thousands of genetic risk loci for complex traits and diseases; however, translation of the risk loci to disease-causing genes and biologic pathways is challenging. Often, researchers approach genetic risk loci one at a time using a series of bioinformatics methods. A typical approach involves assessing if the top variant at each disease risk locus is an expression quantitative trait locus (eQTL) - meaning that the disease risk variant is associated with gene expression levels - in disease-relevant tissues[Con15]. Statistical colocalization of GWAS and eQTL association signals can further increase confidence in the most likely effector gene at each GWAS risk locus[GVS+14]. However, considering each locus in isolation does not leverage the fact that genetic risk for complex diseases is additive across many loci[KCA+18, KCW+19, MSS+20]. The genetic risk to most diseases is likely distributed across a large number of biologic processes[BLP17] with a network of molecular interactions contributing to disease biology[BO04].
For this reason, several tools have been designed to identify disease-causing genes starting from GWAS studies. Some leverage network topology to handle the complex interplay of biomolecules that lead to disease, we will refer as Network-based approaches[Fur13, LERR13]. While other methods functionally annotate GWAS findings and prioritize the most likely causal genes using several biological data sources[CGLL+21]. They are referred as integrative approaches.
Network-based approaches first build a weighted network of associations between gene and risk locus, and then they find a subset of highly scored genes and locus that are functionally-related and densely connected. LEAN[GBV+17] predicts a ”star” disease module in which a gene and its direct interactors are associated with the disease. DmGWAS[JZL+11], EWdmGWAS[WYZJ15] and Heinz[DKR+08] find a disease module consisting of genes with a high association score. HotNet2[LVW+15], and SigMod[LBR+17] find disease modules of densely connected genes but not necessarily high scoring. SCoES[AGS+13] leverages the SNP network, consisting of SNPs that interact if there exists a protein-protein interaction between their associated genes, to discover a disease module. DOMINO[LES21] leverages differential gene expression data to detect active network modules that are statistically significant in GO terms that do not appear to be enriched in random permutations.
Integrative approaches, instead, combine different biological information to prioritize candidate disease genes. DEPICT[FKK+15] leverages co-regulation of gene expression to predict gene function based on a guilt-by-association procedure and prioritizing genes at different risk loci that have similar predicted functions. FUMA [WTVBP17] is an integrative platform that combines positional mapping, expression quantitative trait loci (eQTL) mapping, chromatin interaction mapping, and MAGMA[dLMHP15] gene analysis to predict candidate disease genes. MendelVar[SGP21] prioritize candidate genes by mapping GWAS traits to known phenotypically relevant Mendelian disease genes near loci.
Our Contribution.
In the following manuscript, we present the Relations-Maximization Method, a network-based approach that leverages co-regulatory networks and biological annotations to find the most likely functional set of genes associated to the risk loci of a complex disease. It is built on the hypothesis that disease-relevant genes across GWAS loci share biological processes, pathways, and correlated gene expression levels. Thus, given a complex disease with multiple risk loci, the proposed algorithm prioritizes a set of genes, that belong to different loci, so that the number of co-regulatory interactions, weighted by the number of shared biological annotations, is maximized.
To demonstrate the application of our method, we chose chronic obstructive pulmonary disease (COPD) as our complex genetic disease of interest. COPD is a debilitating respiratory disease affecting millions of individuals across the globe and is estimated to be the third leading cause of death worldwide.[Wor21] The diagnosis and severity of COPD are defined by summary measures of lung function; however, COPD is clinically heterogeneous, and individuals with similar lung function impairment may have vastly different appearances of their lung parenchyma on computed tomography (CT) imaging.[HML+14] The clinical heterogeneity of COPD also likely contributes to the difficulty of developing broadly effective pharmacologic therapies for reducing COPD mortality. Only recently, in a trial of ¿10,000 individuals, inhaled therapy with steroids was shown to have a mortality benefit over inhaled therapy with bronchodilator medications alone[LBB+18]. These inhaled therapies are the mainstay of COPD treatment, though multiple previous trials of similar inhaled therapy regimens had failed to demonstrate a mortality benefit in COPD patients. New approaches to COPD therapy are needed. Drug targets with human genetics support, as from GWAS, are more likely to be successful through the rigorous clinical investigations required for drug approval[KDD19, NTP+15]. The genetic data we are employing for COPD is from a 2019 COPD GWAS, which identified up to 82 genetic loci associated with the risk of COPD[SPL+19a].
2 Methods
2.1 Data
2.1.1 Biological data sources
GWAS Summary Statistics:
We downloaded COPD GWAS Summary statistics from[SPL+19b]. We downloaded Breast Cancer GWAS Statistics from the GWAS catalog.
Gene-term associations.
We used two different sources of biological information:
- •
Gene Ontology Consortium11 1 http://geneontology.org/ : For each gene we downloaded its associated terms (cellular components, molecular pathways and biological processes), filtering out terms that not been manually reviewed (IEA evidence code).
- •
Reactome[FSG+16]: this is an open-source, curated and peer-reviewed database that associates genes with their biological pathways.
Drug-target associations.
We downloaded drug-target associations from the Drug Repurposing Hub Database[CBL+17].
Gene Ontology Graph.
We downloaded the Gene Ontology Graph from the Gene Ontology Consortium. This is a network in which each node is a gene ontology annotation/term, while edges represent relationships between annotations/terms. This network is loosely hierarchical, with child nodes more specialized than their parent nodes. Unlike a strict hierarchy, however, a node may have more than one parent. The relationships we used to filter the GO Graph are:
- •
“is a”: This relation forms the basic structure of GO. If a pair has this relationship code, then is a subtype of
- •
“part of”: This relation is used to represent part-whole relationships. This relation has a specific meaning in GO: it is associated to a pair if is necessarily part of . That is, the presence of the implies the presence of , though the converse may not be true.
Co-Regulation Network.
we downloaded co-regulation network from in Fehrmann et al .[FKK+15] (and www.genenetwork.nl), filtering out not statistically significant edges (i.e. P-value .
2.2 Data Pre-processing
2.2.1 Construction of risk locus - gene bipartite network
Starting from a set of SNPs in a GWAS study, we used bed tool to select overlapping genes within a 2Mb window around the SNPs selected by the GWAS study. Then, we assigned a set of genes to each risk locus as follows: a gene is associated to a locus if the index SNP resides within the gene, or if the gene overlaps with a window around the index SNP; whenever a gene overlaps with multiple loci, it is assigned to the nearest index SNP. In this way, i) each gene is associated with exactly one GWAS risk locus and ii) each risk locus corresponds to a unique set of genes. To assign each gene to its nearest risk locus, we first define the distance between risk locus (marked by the associated SNPs) and the genetic position of a gene (i.e its starting and ending positions ) as:
| (1) |
Where is the Chromosome. Secondly, we assign each gene to the risk locus that minimize the distance (i.e. where L is the set of COPD’s risk loci). We define positions in the human genome according to genome build GRCh37.
2.2.2 Filtering the Co-Regulation Network
To model the effects of correlations between genes assigned statistically GWAS risk loci, we combined the co-regulation network and the risk locus - gene associations bipartite graph discussed in section 2.2.1 to derive a sub-network, deleting those edges that link genes assigned to the same risk locus and deleting genes not associated to any locus. Then, we assign weights to the each edge of this filtered co-regulation network, using biological similarity among genes to this purpose (more details are given in section 2.2.3).
2.2.3 Weighting co-regulation network using Biological Information
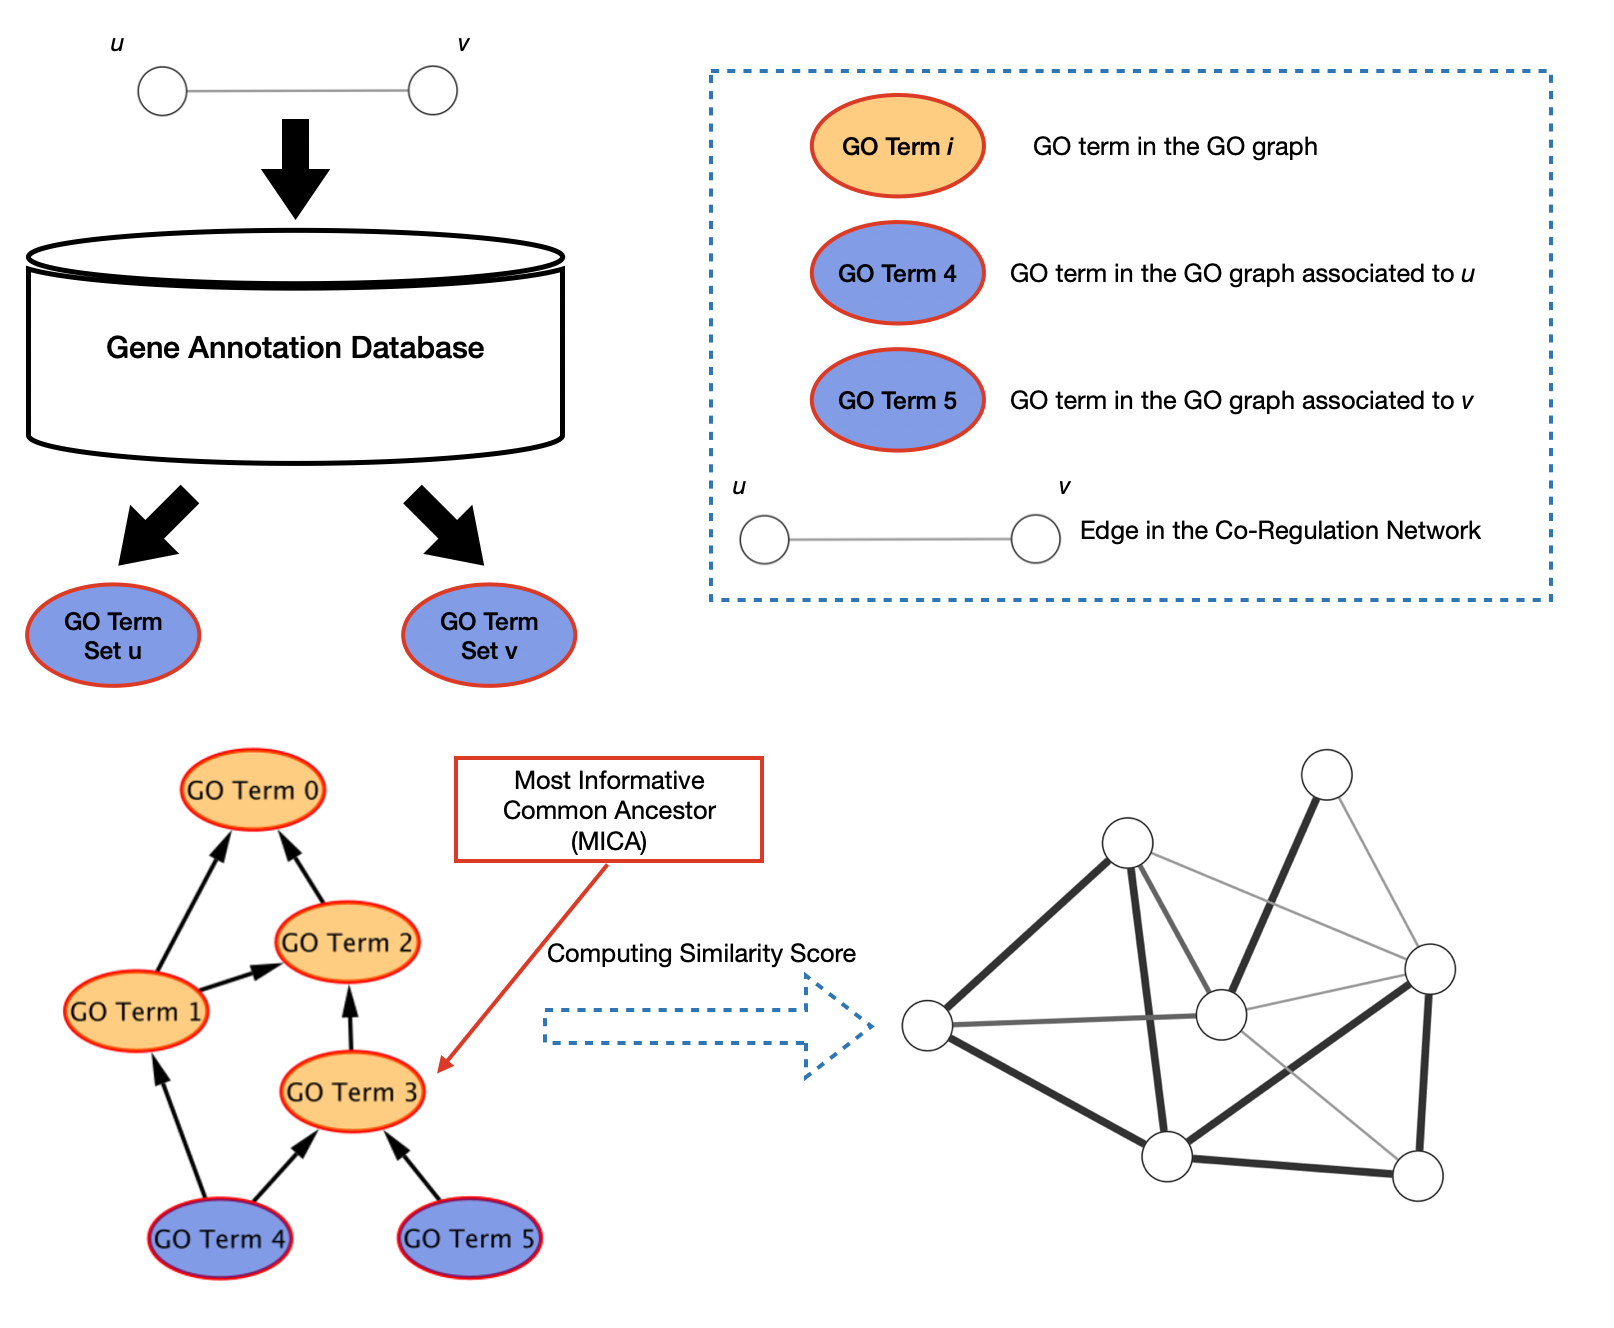
Each edge in the co-regulation network is assigned a weight that depends on the biological similarity between the genes corresponding to the edge’s endpoints. To do this, we leverage biological processes downloaded from Gene Ontology Consortium [Con04]. Similarity between two genes and is defined with respect to the GO annotations associated to and , To begin, we use Resnik’s method [Res95] to assign a semantic similarity score to a pair and of GO annotations. In more detail, Resnik’s method quantifies the similarity measure of a term pair as the information content (IC) of their Most Informative Common Ancestor (MICA), namely:
| (2) |
In (2), is the set of common ancestor terms between the terms and in the GO graph. denotes the information content value of term , defined as , with the probability that occurs in a certain corpus of GO annotation, such as the human annotation database. In other word, is the frequency with which one encounters the annotation within the corpus under consideration. This implies that if an annotation is a parent of another annotation , then we necessarily have (i.e the Information content is a monotonic function). Of course, a gene can be involved in multiple biological processes, thus it could be annotated with multiple GO terms. For this reason, we estimate the semantic similarity between pairs of genes that share an edge in the co-regulation network using the Best Match Average (BMA) Rule [AWB05], whereby the similarity measure between genes and is defined as the mean of the following two values: average of the maximum similarity scores between each GO term associated to gene and those annotated to gene , and the average of the maximum similarity scores between each GO term associated to gene and those annotated to gene . In formulas:
| (3) |
where is the number of annotations associated to (i.e ), is the number of annotations associated to (i.e ), and are the sets of ’s and ’s annotations respectively, while is the maximum Resnik’s similarity () between term and GO terms associated to gene . More formally:
| (4) |
Figure 1 describes the steps to weight each link in the network. The Final network returned by this biological preprocessing step consists of an undirected weighted graph, in which nodes are genes associated to the 82 loci of interest, and there is an weighted edge between two nodes if they are co-regulated by the same transcription factor and they are biologically similar according to the BMA rule that is used to weight each edge.
2.3 The Relations-Maximization Method
In this section, we describe our approach to translating GWAS loci to a set of likely functional genes. In particular, our aim is twofold: i) associating the most likely functional gene to each GWAS locus and ii) selecting a subset of genes that collectively share biological processes, pathways, and correlated gene expression levels, as discussed in the introduction. Information about genes’ biological similarity is encoded in the weighted, undirected network resulting from the biological preprocessing described in Section 2.2.3.
Formalization as a densest subgraph problem.
Our input is an undirected, weighted graph , where each node in is a gene and if genes and share biological features as discussed in Section 2.2.3, while assigns to each edge a positive weight, reflecting the degree of and ’s biological similarity. Moreover, each node has exactly one associated locus. This association is described by the function , for each gene providing the locus it is associated to. On the other hand, each locus can have multiple associated genes. For ease of exposition, we describe this second relationship as a second function which, for every locus , gives the list of the genes that are associated to it.22 2 Note that the use of functions and is only to make exposition more concise. For example, the set of genes associated to each locus can be simply derived from , by taking all genes , such that .
We next discuss how our two goals i) and ii) mentioned at the beginning of this section are mapped into a variant of a well-known optimization problem. Our goal is computing a subset of the nodes (i.e., a subset of genes), such that 1) , i.e., the number of genes returned is exactly equal to the number of loci, 2) for every , we have exactly one member , such that and 3) the subgraph induced by is the densest among those satisfying constraints 1) and 2) above. Before making point 3) more precise, it is worth noting that 1) and 2) together correspond to achieving goal i) above, returning exactly one associated gene per locus. As for point 3), given a weighted graph and , the (weighted) subgraph induced by is the graph , where consists of all edges in with both end nodes in , i.e., , while is simply the restriction of to the subset . Given and , the of the induced subgraph is
Intuitively, the higher , the higher the average, overall weight of the edges incident to each node. In our case, this translates to selecting a subset of genes that tend to form a densely connected component, with genes of the chosen pool exhibiting above average biological similarity.
Achieving points 1) - 3) above (corresponding to goals i) and ii)) thus translates into the following optimization problem. Given ,
| (5) | ||||
| subject to: | ||||
| (6) | ||||
| (7) |
33 3 Only for the sake of clarity, we have constraints (7) in the problem formulation even though they are redundant given the presence of constraints (6) and the belonging of a gene to exactly one locus. The unconstrained version of the above optimization problem (i.e., (5)) corresponds to the well-known densest subgraph problem [Gol84], which admits efficient algorithms that will return an optimal solution. Adding constraints (7) and (6) as in our case in general makes the problem considerably harder. Indeed, variants of the problem similar to the one above are unlikely to adimit efficient algorithms that are also optimal [ABF+20].
Overview of algorithm.
In the remainder of this Section, given a weighted graph with positive weights, we denote by its (weighted) adjacency matrix. Namely, is a symmetric matrix with non negative entries, such that if edge does not belong to . If , then equals the corresponding weight . The heuristic proposed in this paper proceeds along similar lines as the technique proposed by Anagnostopoulos et al. [ABF+20] for the extraction of a perfectly balanced dense community of nodes from a network. The general idea behind is that, as observed in [KV99], the (unconstrained) densest subgraph problem (i.e., (5)) admits a spectral, formulation, namely:
| (8) |
On the other hand, the following relaxation of (8):
corresponds to computing the main eigenvector of matrix . Moreover, as shown in Kannan et al. [KV99], the presence of a node of in the densest subgraph is correlated with the magnitude of the corresponding entry in the main eigenvector of , and a greedy technique based on this observation provides a provably approximate solution to the densest subgraph problem. Extending this idea, Anagnostopoulos et al. [ABF+20] proposed heuristics to compute dense, fair subgraphs of labelled graphs44 4 In our setting, the label of a node is the locus the corresponding gene is associated to., based on computing the main eigenvector of the following symmetric matrix, called a fair projection matrix:
In the setting of [ABF+20], a subgraph is fair if it contains the same number of nodes of each possible label. In the expression above, is a fair projection matrix, which enforces the above constraint. We refer the reader to [ABF+20, Section 2] for full details on and the arguments behind their proposed heuristics. Unfortunately, the techniques of Anagnostopoulos et al. [ABF+20] cannot be directly applied in our case, since we have the further constraint that the dense subgraph we compute should contain exactly one node for each label/locus. To achieve this, we modified and adapted the heuristic of Anagnostopoulos et al. [ABF+20] to our setting. While the pseudocode of our method is described in Algorithm 1, we provide an overview of the algorithm in the paragraphs that follow.
The Relations-Maximization Method (Algorithm 1), takes in input the K-Partite, undirected, and weighted graph resulting from the biological preprocessing step described in Section 2.2 and the associations between nodes/genes and loci, formally described by the functions and . It returns a subgraph that meets constraints (7) and (6), while ideally maximizing (5).
The algorithm starts with an iterative process that, in each iteration, computes a feasible solution for the constrained problem (5) - (7), and it terminates by providing the feasible solution with the highest density among all the produced ones. In more detail, in each iteration of the main while loop (line 4 of the algorithm), the algorithm processes a weighted subgraph of the original graph ( itself in the first iteration), computing a subset of size , so that exactly one node/gene in is associated to each locus in . To this purpose, modifying the approach proposed in [ABF+20], it computes the main eigenvector of the fair projection matrix corresponding to and (lines 5-6) and then (lines 7-9), for each locus , it adds to the node/gene associated to , whose component in is largest. Note that, since changes across consecutive iterations, so do the fair projection matrix and consequently . If the subgraph induced by has higher density than the previous best solution, the current best solution is updated (lines 10-11). Finally (lines 12-13), as long as has more than nodes, the node with the smallest corresponding entry in is removed, with chosen from the subset of nodes whose associated loci have at least two associated genes in . This amounts to a updating to and to , after which the next iteration of the while loop begins. Note that, this way, the number of iterations of the main while loop is .55 5 It should be noted that the algorithm only explores a linear size subset of the exponentially many solutions of the original problem.
3 Results
3.1 Experimental Set Up
To assess the validity of our approach, we compared its performance to FUMA, DEPICT, and MendelVar, which prioritize causal genes at disease risk loci. We further compare our framework with DOMINO, a network-based approach that leverages PPI network topology to find sets of highly connected nodes in the graph involved in the same biological processes. We compared them on two different axes:i) we externally validated various approaches using several data sources and ii) we internally validated them using a newer approach
External Validation.
We used gseapy to compute the enriched Reactome and Kegg pathways of each framework’s predicted gene set. Furthermore, we considered the precision P defined as:
| (9) |
As a Ground Truth, we choose two different test sets. We downloaded drug target association from the DrugHub and we considered as ground truth genes that are drug target of COPD, Bronchospasm and asthma. Then, we downloaded from the Open Target Platform genes involved in respiratory phenotype in mouse model.
Internal Validation.
There is increasing evidence that a set of proteins associated with a given disease do not function in an isolated way. Indeed, these causal proteins interact with each other to form a distinct network module within the universe of (physical) protein-protein interactions (the human protein-protein interactome), representing perturbed, dysfunctional pathways[BGL11, GNZ+14, MSK+15]. Consequently, starting from independent sets of disease risk loci, a disease-gene prioritization algorithm should prioritize genes involved in similar biological processes. To assess this property, we divided disease-associated SNPs into two groups: Even (E) set, consisting of SNPs located in Even Chromosomes, and Odd (O) set, consisting of SNPs located in the Odd Chromosomes. In this way, we created two independent, balanced inputs(i.e., The chromosome length in one set is similar to the other one)[PPA+19]. Finally, we analyze the sets of genes prioritized using E and O, using a biological similarity measure, named Biological Similarity, and the Network Distance. The former considers common biological processes between predicted gene sets to compute their similarity. While the latter measures the distance between predicted gene sets when projected on a Protein-Protein Interaction network. In the following paragraphs, we formalize these metrics:
Biological Similarity:
We designed the Biological Proximity function that compares gene sets and , predicted respectively starting from E and O, employing their associated biological pathways. It is based on the Best Match Average (BMA) rule and employs the Jaccard Index to score gene biological similarity. More formally, given and , the gene sets predicted using respectively Even and Odd Chromosomes, is defined as:
| (10) |
Where score is defined as and is the Jaccard Index between biological processes associated respectively with and .
Network Distance:
we measure the network proximity of modules and as reflected in their gene localizations on Protein Protein Interaction network using the recently introduced separation measure [MSK+15]:
| (11) |
which compares the mean shortest distance within the interactome between the predicted genes of each set, and , to the mean shortest distance between E–O genes pairs.
3.2 External Validation: Application to COPD

3.2.1 Biological Interpretation of prioritized disease genes
We performed gene-set enrichment analysis to gain functional insight into potentially causal genes assigned to GWAS loci. We compared the statistically significant pathways found by the gene sets associated with genes predicted by Relations-Maximization Method with those prioritized by DEPICT, FUMA, MendelVar, and DOMINO. Since Relations-Maximization Method is constrained to return one gene per locus, it is tough to have a fair comparison between the algorithm presented in this manuscript. Hence, we designed a different way to find statistically significant Reactome pathways given the set of genes predicted by other heuristics. For each algorithm exception for Relations-Maximization Method we grouped their predicted genes by the locus they belong to. Then, we randomly select one gene per locus and compute the enriched pathways using the gseapy, a python library that allowed us to run Enrichr on the python script. We repeated this process several times (i.e., we calculated their statistically significant pathways 1000 times). Finally, we obtained the final p-value of a pathway as an average of all the p-values computed. Table 1 shows the Reactome Pathways that are enriched ( ¡ 0.05) in at least one of the heuristics analyzed in this manuscript. FUMA, MendelVar, and DEPICT do not find any enrichment in their prioritized gene sets. Instead, Relations-Maximization Method and DOMINO returns gene sets that are significantly enriched in the Immune System and the Adaptive Immune System [PHTH+14]. Even If Relations-Maximization Method prioritizes only one gene per locus, It returns genes statistically significant In Immune System related pathways. Furthermore, It is the only one to find a gene set statistically significant in the Developmental pathways that are thought to play a crucial role in its pathophysiology. [BMP+16, CDA+20].

Furthermore, we also considered all set returned by each algorithm to compute Reactome P-values allowing DOMINO, MendelVar, FUMA, and DEPICT to produce more than one gene per locus. Supplementary Table 2 shows the Reactome Enrichment if all prioritized genes are considered. While there seems not to be an improvement in genes predicted by MendelVar, FUMA, and DEPICT, DOMINO enhances the P-values of several Immunological related pathways. One of the possible explanations for this behavior could be related to the input used by DOMINO. Indeed, it is the only one that leverages PPI networks, and it is well known that there is a high correlation between interacting proteins and their shared ontologies. Indeed, Supplementary Figure 2 a) shows the PPI network induced by the genes prioritized by DOMINO, and each gene has a color that depends on its locus location. Thus, DOMINO prioritizes several biologically related genes located in the same locus, creating a dense module in the PPI network. For instance, It predicts several HLA genes that are well known to be involved in the Immune System related pathways.
3.2.2 Identification of drug targets
We examined the 82 gene-locus associations returned by the Relations-Maximization Method and we compared them with the gene-locus associations predicted by the other heuristics. First, we compared the outputs of all algorithms by considering, as ground truth, only genes that are targets of “launched drugs” (i.e., approved by FDA) that are used to treat asthma, bronchospasm, bronchitis or chronic obstructive pulmonary disease. We found that Relations-Maximization Method is able to predict 2 drug targets, namely, KCNMA1 and HRH1 and DEPICT only predicts one: ADRB2. MendelVar prioritizes the highest number of COPD related drug targets: TNF, CHRM3, SLC6A4, HRH1, KCNMA1. Instead, FUMA and DOMINO does not prioritize any COPD related drug targets. We should notice that DEPICT, DOMINO and MendelVar in general associate a list of genes to each locus. For this reason, we compared each the portion of drug target found by each algorithm (Precision) with its random expectation. Figure 2 b) shows for each algorithm the portion of prioritiized genes that are targets of COPD, asthma, and bronchospasm FDA approved Drugs we downloaded from The Drug Hub.
We then broadened our scope, considering the entire drug target association data set. We found that 14 genes (EPHA2, PLK3, ITGA2, CACNB1, HRH1, PARP15, TIMP3, MARK1, RARB, FRK, EPHB4, STK10, WNT5A and KCNMA1) are drug targets of several in Development or Launched drugs (see Supp. Table 2 for more information 66 6 https://docs.google.com/spreadsheets/d/1cWy2fGU9BY6bZFzlr56fmz74z1o4kA3TZE80fXDYxmc). However, MendelVar is the algorithm that retrieves the largest number of drug targets. As we discussed previously, to make the comparison fair, we analyzed the precision of each algorithm (i.e., the portion of predicted genes that are target of any Launch or In Development Drugs). If we consider the precision, our heuristic has the highest value, followed by MendelVar and DEPICT. it is worth noticing that comparing each framework with its own random distribution, the onlyones that obtains statistically significant results are MendelVar () and Relations-Maximization Method ().
3.2.3 Identification of Genes involved in Mouse Respiratory Phenotypes
The use of non-human species to understand regular and pathobiology and to create models of human diseases tractable to the experimental investigation has been a dominant and successful paradigm in the biomedical sciences for many years[SHG12, RB07]. Consequently, we externally validate gene sets prioritized by the frameworks considered in this manuscript using the Open Target Platform, a resource of mouse phenotypes and mapped genes. We download all genes involved in ”respiratory phenotypes” from the Open Target Platform to derive a validation set. Then, we computed the precision (i.e., the fraction of prioritized genes in the validation set), and we compared each algorithm’s accuracy with their random distribution. Figure 2 d) shows the performance of each framework compared to its random expectation. Only three framework obtains a statistically significant accuracy: Relations-Maximization Method has the best prediction accuracy that is also statistically significant (i.e., ), MendelVar, that predicts the largest number of genes mapped in mouse phenotypes, and DEPICT. The list of genes predicted and their mouse phenotypes is visible on Supplementary Table 3.

3.3 Cross Study Validation: Application to Breast Cancer
To further understand the ability of our framework to predict robust, biologically meaningful results, we downloaded several studies on Breast Cancer from The GWAS Catalog and compared the gene sets returned by Relations-Maximization Method. Here we present the results using BC studies with enough information (i.e., a good amount of SNPs found in each study). First, we plot the heatmap representing the similarity between pairs of studies in terms of statistically significant SNPs. Indeed, Supplementary Figure 1 a) shows the Jaccard Index between enriched SNPs. As we can see, a bunch of studies shares more than 30% of SNPs, and as a consequence, the Jaccard Index of their predicted gene set is very similar, as shown in Supplementary Figure 1 b). This result depends on the fact that a good part of these studies (i.e., GCST001937, GCST003842, GCST90090980, GCST003845, GCST004950, GCST007236) is derived from the same population. However, one study (i.e., GCST90011804), that does not share common SNPs with the others, share part of its predicted gene set (i.e., IJ ¿ 0.16). Indeed, GCST90011804 uses a different cohort but nevertheless it can return genes that are involved in similar biological processes as show in Supplementary Figure 1 c). Furthermore, all predicted gene sets are closer in the Protein-Protein interaction network as shown in 1 d), where the network distance varies between 0.0 and 0.07.
3.4 Internal Validation
3.4.1 Odd vs. Even
Figure 4 a) and b) show for each algorithm the biological and network proximities between prioritized gene sets (i.e., odd and even split) and compares them with a random distribution. We calculated the biological proximity using ontologies (biological processes) downloaded from Gene Ontology Consortium. Furthermore, to avoid possible correlations between network proximity and the genes prioritized by DOMINO, we change the PPI network in which the network proximity is computed. Although DOMINO leverages the protein-protein interaction network, when we divide the seed set into two different sets, the resulting prioritized gene sets are very far from each other in terms of network proximity. Indeed, the associated empirical p-value is circa 1. Interestingly, all frameworks return gene sets (i.e., and ) that are biologically similar compared to random expectation (i.e., empirical p-value ¡ 0.05). However, when we compute the network proximity of odd and even prioritized sets, only MendelVar and Relations-Maximization Method return sets of genes located in the same protein-protein interaction network area. Furthermore, DEPICT cannot prioritize any genes since the input information (31 even loci and 50 odd risk loci) is not enough to return statistically significant annotations.
3.4.2 The General Approach
In section 3.4.1, we demonstrated the ability of the Relations-Maximization Method to find biologically related gene sets starting from independent inputs ( i.e. the 2 sets of SNPs associated respectively to Odd and Even Chromosomes). Here, we discuss a more general approach to show the ability of our framework to prioritize biologically similar gene sets when the information is missing.
To introduce noise (i.e missing information) on our dataset, consisting of 82 Statistically significant SNPs associated with Chronic Obstructive Pulmonary Disease, we first removed a portion of them uniformly at random and we repeated this process to get a fold of 100 inputs. Secondly, we execute the Relations-Maximization Method on each noisy input to prioritize a gene set. Finally, we computed the Biological and Network proximity between each prioritized gene set and the gene set induced by all the 82 enriched SNPs. To better understand how missing information affects our predictions, we repeated the overall experiment removing a portion of data in the interval [5%, 50%].
Figure 4 c) and d) show how missing data affect the similarity between a noisy dataset and the original one. a) and b) show how much biological and network proximity are affected by missing information. Each boxplot shows the distribution of biological and network proximities when a percentage of SNPs is removed from the algorithm’s inputs. When 50% of SNPs are removed, the output is noisy and very distant from the original solution in terms of biological similarity and network proximity. Furthermore, when the missing information is reduced (i.e., 75% to 95% of SNPs are the input of Relations-Maximization Method), we can see how biological proximity converges to 1 and network proximity to 0. Thus, Relations-Maximization Method can still find a suitable solution if we remove at most 25% percent of our knowledge from the input. Unfortunately, we can do this experiment only on Relations-Maximization Method since FUMA and MENDELVAR are web applications that we cannot run locally.
3.4.3 Randomization and Bias
Unlike other network-based approaches, Relations-Maximization Method weights the co-regulation network using Gene Ontologies as described in section 3.2.1. Since manually curated information creates a bias in the co-regulation network, we analyze if the set of genes predicted is driven exclusively by the bias induced by GO or if it depends on the risk locus-gene associations. Consequently, we create 100 random risk locus-gene bipartite graphs without changing the number of associations of each risk locus. Thus, the co-regulation network induced by a randomized bipartite network is always different (i.e., links between genes associated with the same risk locus are removed). For each generated co-regulation network, we ran the Relations-Maximization Method and computed the portion of predicted drug targets and the percentage of genes involved in mouse phenotypes. Figure 4 e) shows the distribution of the percentage of drug targets predicted using random networks compared with the score predicted using not randomized data (). Finally, figure 4 f) shows the distribution of the portion of genes involved in mouse phenotypes predicted using random networks and compared with the gene predicted using the original bipartite graph (). As expected, the solution returned using original data is more biologically meaningful than those returned using a randomized risk locus-gene association dataset.
4 Conclusion
This article proposes a novel method, Relations-Maximization Method, to identify the single most likely causal gene at GWAS risk loci. Relations-Maximization Method associates each causal variant with the most probable causal gene identifying the set of genes (i.e., one for each casual variant) with the highest density in a weighted gene co-regulation network. Unlike previous network-based disease genes prioritization algorithms such as dmGWAS or DOMINO, Relations-Maximization Method considers only a subgraph consisting of edges connecting nodes that do not overlap the same locus. Then, It searches for a subset of nodes, one per each locus, that maximizes the total number of connections. Furthermore, instead of leveraging PPI topology, this framework exploits the structure of a CO-regulation network where a pair of genes is connected if they are co-regulated by the same transcription factors.
We biologically validated our framework on COPD, a complex disease with a set of 82 risk loci previously discovered through GWAS. Since there is no ground truth about the proper association between COPD risk loci and the causal gene at each risk locus, we compared the Relations-Maximization Method with the existing methods on three different axes: i) statistically significant Reactome and KEGG Pathways identified by each prioritized set gene of putative causal genes, ii) the portion of drug targets found by each heuristics, and iii) the portion of genes that have been previously identified to be involved in respiratory system mouse phenotypes.
Although our gene prioritization results for COPD GWAS were plausible based on prior COPD research, there is no ground truth for the causal genes and biologic networks underlying COPD pathogenesis. Thus, we did not have a way to compute and compare the specificity and sensitivity of each gene prioritization algorithm for COPD. Consequently, we validated the consistency of Relations-Maximization Method in the face of data incompleteness. To reduce the signal present in the COPD GWAS study, We divided the risk loci into two independent sets containing risk loci in Even and Odd chromosomes. We ran Relations-Maximization Method and other GWAS prioritization algorithms considering these sets as inputs, and we analyzed the results using two different approaches. First, we compared the prioritized gene sets in terms of biological similarity, comparing the set of biological processes they are involved in. Secondly, we compare the outputs based on their distance in the PPI network. Except for DEPICT, we found that all the algorithm shows similar results and predict meaningful results even if the input is subjected to data incompleteness. Furthermore, we repeated this experiment on Breast Cancer disease to see if the performances were consistent. We downloaded several GWAS studies, and we analyzed the biological and topological similarities of the prioritized gene sets.
Finally, we generalized the internal validation, randomly removing a portion of risk loci from the input and compared an incomplete solution with that one in which all the GWAS data is considered. We found that Relations-Maximization Method is resilient to missing information and return a meaningful solution even if the 25% of data is removed. Unfortunately, since MendelVar and FUMA are web servers, we did not have the chance to repeat this experiment on them.
This framework showed promising results when compared with the state-of-the-art. However, we can still improve this heuristic to return more reliable predictions. Firstly, it is relatively easy to adapt the framework to work with other data types, such as e-QTLs, to help the heuristic choose the optimal casual gene for a given locus. Secondly, the method can leverage only one network. Still, we may consider modeling the problem on a multi-layer graph, considering other networks such as PPI and CO-Expression.
In summary, we introduce the Relations-Maximization Method for jointly prioritizing putative causal genes across all GWAS loci for a trait or disease and selecting one biologically similar potential causal gene at each genetic risk locus. The Relations-Maximization Method outperforms related gene prioritization methods in capturing biologically-relevant information measured by drug targets and mouse phenotypes while remaining robust to incomplete and noisy GWAS data.
5 Acknowledgement
This work is partially supported by the ERC Advanced Grant 788893 AMDROMA “Algorithmic and Mechanism Design Research in Online Markets”, the EC H2020RIA project “SoBigData++” (871042), and the MIUR PRIN project ALGADIMAR “Algorithms, Games, and Digital Markets”. BDH is supported by NIH K08 HL136928, U01 HL089856, R01 HL135142, R01 HL139634, and R01 HL147148; an Alpha-1 Foundation Research Grant; and receives grant support from Bayer.
References
- [ABF+20] Aris Anagnostopoulos, Luca Becchetti, Adriano Fazzone, Cristina Menghini, and Chris Schwiegelshohn. Spectral relaxations and fair densest subgraphs. In Proceedings of the 29th ACM International Conference on Information & Knowledge Management, CIKM ’20, page 35–44, New York, NY, USA, 2020. Association for Computing Machinery.
- [AGS+13] Chloé-Agathe Azencott, Dominik Grimm, Mahito Sugiyama, Yoshinobu Kawahara, and Karsten M Borgwardt. Efficient network-guided multi-locus association mapping with graph cuts. Bioinformatics, 29(13):i171–i179, 2013.
- [AWB05] Francisco Azuaje, Haiying Wang, and Olivier Bodenreider. Ontology-driven similarity approaches to supporting gene functional assessment. In Proceedings of the ISMB’2005 SIG meeting on Bio-ontologies, volume 2005, pages 9–10, 2005.
- [BGL11] Albert-László Barabási, Natali Gulbahce, and Joseph Loscalzo. Network medicine: a network-based approach to human disease. Nature reviews genetics, 12(1):56–68, 2011.
- [BLP17] E. A. Boyle, Y. I. Li, and J. K. Pritchard. An expanded view of complex traits: From polygenic to omnigenic. Cell, 169(7):1177–1186, 2017.
- [BMP+16] Olivier Boucherat, Mathieu C Morissette, Steeve Provencher, Sebastien Bonnet, and François Maltais. Bridging lung development with chronic obstructive pulmonary disease. relevance of developmental pathways in chronic obstructive pulmonary disease pathogenesis. American Journal of Respiratory and Critical Care Medicine, 193(4):362–375, 2016.
- [BO04] A. L. Barabasi and Z. N. Oltvai. Network biology: understanding the cell’s functional organization. Nature reviews. Genetics, 5(2):101–13, 2004.
- [CBL+17] Steven M Corsello, Joshua A Bittker, Zihan Liu, Joshua Gould, Patrick McCarren, Jodi E Hirschman, Stephen E Johnston, Anita Vrcic, Bang Wong, Mariya Khan, et al. The drug repurposing hub: a next-generation drug library and information resource. Nature medicine, 23(4):405–408, 2017.
- [CDA+20] François M Carlier, Sébastien Dupasquier, Jérôme Ambroise, Bruno Detry, Marylene Lecocq, Charline Biétry-Claudet, Yassine Boukala, Jean-Luc Gala, Caroline Bouzin, Stijn E Verleden, et al. Canonical wnt pathway is activated in the airway epithelium in chronic obstructive pulmonary disease. EBioMedicine, 61:103034, 2020.
- [CGLL+21] Héctor Climente-González, Christine Lonjou, Fabienne Lesueur, GENESIS study group, Dominique Stoppa-Lyonnet, Nadine Andrieu, and Chloé-Agathe Azencott. Boosting gwas using biological networks: A study on susceptibility to familial breast cancer. PLoS computational biology, 17(3):e1008819, 2021.
- [Con04] Gene Ontology Consortium. The gene ontology (go) database and informatics resource. Nucleic acids research, 32(suppl_1):D258–D261, 2004.
- [Con15] G. TEx Consortium. Human genomics. the genotype-tissue expression (gtex) pilot analysis: multitissue gene regulation in humans. Science, 348(6235):648–60, 2015.
- [DKR+08] Marcus T Dittrich, Gunnar W Klau, Andreas Rosenwald, Thomas Dandekar, and Tobias Müller. Identifying functional modules in protein–protein interaction networks: an integrated exact approach. Bioinformatics, 24(13):i223–i231, 2008.
- [dLMHP15] Christiaan A de Leeuw, Joris M Mooij, Tom Heskes, and Danielle Posthuma. Magma: generalized gene-set analysis of gwas data. PLoS computational biology, 11(4):e1004219, 2015.
- [FKK+15] Rudolf SN Fehrmann, Juha M Karjalainen, Małgorzata Krajewska, Harm-Jan Westra, David Maloney, Anton Simeonov, Tune H Pers, Joel N Hirschhorn, Ritsert C Jansen, Erik A Schultes, et al. Gene expression analysis identifies global gene dosage sensitivity in cancer. Nature genetics, 47(2):115–125, 2015.
- [FSG+16] Antonio Fabregat, Konstantinos Sidiropoulos, Phani Garapati, Marc Gillespie, Kerstin Hausmann, Robin Haw, Bijay Jassal, Steven Jupe, Florian Korninger, Sheldon McKay, et al. The reactome pathway knowledgebase. Nucleic acids research, 44(D1):D481–D487, 2016.
- [Fur13] Laura I Furlong. Human diseases through the lens of network biology. Trends in genetics, 29(3):150–159, 2013.
- [GBV+17] Frederik Gwinner, Gwénola Boulday, Claire Vandiedonck, Minh Arnould, Cécile Cardoso, Iryna Nikolayeva, Oriol Guitart-Pla, Cécile V Denis, Olivier D Christophe, Johann Beghain, et al. Network-based analysis of omics data: the lean method. Bioinformatics, 33(5):701–709, 2017.
- [GNZ+14] Mika Gustafsson, Colm E Nestor, Huan Zhang, Albert-László Barabási, Sergio Baranzini, Sören Brunak, Kian Fan Chung, Howard J Federoff, Anne-Claude Gavin, Richard R Meehan, et al. Modules, networks and systems medicine for understanding disease and aiding diagnosis. Genome medicine, 6(10):1–11, 2014.
- [Gol84] Andrew V Goldberg. Finding a maximum density subgraph. Technical report, University of California Berkeley, 1984.
- [GVS+14] C. Giambartolomei, D. Vukcevic, E. E. Schadt, L. Franke, A. D. Hingorani, C. Wallace, and V. Plagnol. Bayesian test for colocalisation between pairs of genetic association studies using summary statistics. PLoS Genet, 10(5):e1004383, 2014.
- [HML+14] C. P. Hersh, B. J. Make, D. A. Lynch, R. G. Barr, R. P. Bowler, P. M. Calverley, P. J. Castaldi, M. H. Cho, H. O. Coxson, D. L. DeMeo, M. G. Foreman, M. K. Han, B. J. Harshfield, J. E. Hokanson, S. Lutz, J. W. Ramsdell, E. A. Regan, S. I. Rennard, J. D. Schroeder, F. C. Sciurba, R. M. Steiner, R. Tal-Singer, Jr. van Beek, E., E. K. Silverman, J. D. Crapo, Copdgene, and Eclipse Investigators. Non-emphysematous chronic obstructive pulmonary disease is associated with diabetes mellitus. BMC Pulm Med, 14:164, 2014.
- [JZL+11] Peilin Jia, Siyuan Zheng, Jirong Long, Wei Zheng, and Zhongming Zhao. dmgwas: dense module searching for genome-wide association studies in protein–protein interaction networks. Bioinformatics, 27(1):95–102, 2011.
- [KCA+18] A. V. Khera, M. Chaffin, K. G. Aragam, M. E. Haas, C. Roselli, S. H. Choi, P. Natarajan, E. S. Lander, S. A. Lubitz, P. T. Ellinor, and S. Kathiresan. Genome-wide polygenic scores for common diseases identify individuals with risk equivalent to monogenic mutations. Nat Genet, 50(9):1219–1224, 2018.
- [KCW+19] A. V. Khera, M. Chaffin, K. H. Wade, S. Zahid, J. Brancale, R. Xia, M. Distefano, O. Senol-Cosar, M. E. Haas, A. Bick, K. G. Aragam, E. S. Lander, G. D. Smith, H. Mason-Suares, M. Fornage, M. Lebo, N. J. Timpson, L. M. Kaplan, and S. Kathiresan. Polygenic prediction of weight and obesity trajectories from birth to adulthood. Cell, 177(3):587–596 e9, 2019.
- [KDD19] E. A. King, J. W. Davis, and J. F. Degner. Are drug targets with genetic support twice as likely to be approved? revised estimates of the impact of genetic support for drug mechanisms on the probability of drug approval. PLoS Genet, 15(12):e1008489, 2019.
- [KV99] Ravi Kannan and V Vinay. Analyzing the structure of large graphs. Rheinische Friedrich-Wilhelms-Universität Bonn Bonn, 1999.
- [LBB+18] D. A. Lipson, F. Barnhart, N. Brealey, J. Brooks, G. J. Criner, N. C. Day, M. T. Dransfield, D. M. G. Halpin, M. K. Han, C. E. Jones, S. Kilbride, P. Lange, D. A. Lomas, F. J. Martinez, D. Singh, M. Tabberer, R. A. Wise, S. J. Pascoe, and Impact Investigators. Once-daily single-inhaler triple versus dual therapy in patients with copd. N Engl J Med, 378(18):1671–1680, 2018.
- [LBR+17] Yuanlong Liu, Myriam Brossard, Damian Roqueiro, Patricia Margaritte-Jeannin, Chloé Sarnowski, Emmanuelle Bouzigon, and Florence Demenais. Sigmod: an exact and efficient method to identify a strongly interconnected disease-associated module in a gene network. Bioinformatics, 33(10):1536–1544, 2017.
- [LERR13] Mark DM Leiserson, Jonathan V Eldridge, Sohini Ramachandran, and Benjamin J Raphael. Network analysis of gwas data. Current opinion in genetics & development, 23(6):602–610, 2013.
- [LES21] Hagai Levi, Ran Elkon, and Ron Shamir. Domino: a network-based active module identification algorithm with reduced rate of false calls. Molecular systems biology, 17(1):e9593, 2021.
- [LVW+15] Mark DM Leiserson, Fabio Vandin, Hsin-Ta Wu, Jason R Dobson, Jonathan V Eldridge, Jacob L Thomas, Alexandra Papoutsaki, Younhun Kim, Beifang Niu, Michael McLellan, et al. Pan-cancer network analysis identifies combinations of rare somatic mutations across pathways and protein complexes. Nature genetics, 47(2):106–114, 2015.
- [MSK+15] Jörg Menche, Amitabh Sharma, Maksim Kitsak, Susan Dina Ghiassian, Marc Vidal, Joseph Loscalzo, and Albert-László Barabási. Uncovering disease-disease relationships through the incomplete interactome. Science, 347(6224), 2015.
- [MSS+20] M. Moll, P. Sakornsakolpat, N. Shrine, B. D. Hobbs, D. L. DeMeo, C. John, A. L. Guyatt, M. J. McGeachie, S. A. Gharib, M. Obeidat, L. Lahousse, S. R. A. Wijnant, G. Brusselle, D. A. Meyers, E. R. Bleecker, X. Li, R. Tal-Singer, A. Manichaikul, S. S. Rich, S. Won, W. J. Kim, A. R. Do, G. R. Washko, R. G. Barr, B. M. Psaty, T. M. Bartz, N. N. Hansel, K. Barnes, J. E. Hokanson, J. D. Crapo, D. Lynch, P. Bakke, A. Gulsvik, I. P. Hall, L. Wain, Copd Genetics Consortium International, Consortium SpiroMeta, S. T. Weiss, E. K. Silverman, F. Dudbridge, M. D. Tobin, and M. H. Cho. Chronic obstructive pulmonary disease and related phenotypes: polygenic risk scores in population-based and case-control cohorts. Lancet Respir Med, 8(7):696–708, 2020.
- [NTP+15] M. R. Nelson, H. Tipney, J. L. Painter, J. Shen, P. Nicoletti, Y. Shen, A. Floratos, P. C. Sham, M. J. Li, J. Wang, L. R. Cardon, J. C. Whittaker, and P. Sanseau. The support of human genetic evidence for approved drug indications. Nat Genet, 47(8):856–60, 2015.
- [PHTH+14] Simon D Pouwels, Irene H Heijink, N Ht Ten Hacken, Peter Vandenabeele, Dmitri V Krysko, Martijn C Nawijn, and A Jm Van Oosterhout. Damps activating innate and adaptive immune responses in copd. Mucosal immunology, 7(2):215–226, 2014.
- [PPA+19] Allison Piovesan, Maria Chiara Pelleri, Francesca Antonaros, Pierluigi Strippoli, Maria Caracausi, and Lorenza Vitale. On the length, weight and gc content of the human genome. BMC research notes, 12(1):1–7, 2019.
- [RB07] Nadia Rosenthal and Steve Brown. The mouse ascending: perspectives for human-disease models. Nature cell biology, 9(9):993–999, 2007.
- [Res95] Philip Resnik. Using information content to evaluate semantic similarity in a taxonomy. arXiv preprint cmp-lg/9511007, 1995.
- [SGP21] Maria K Sobczyk, Tom R Gaunt, and Lavinia Paternoster. Mendelvar: gene prioritization at gwas loci using phenotypic enrichment of mendelian disease genes. Bioinformatics, 37(1):1–8, 2021.
- [SHG12] Paul N Schofield, Robert Hoehndorf, and Georgios V Gkoutos. Mouse genetic and phenotypic resources for human genetics. Human mutation, 33(5):826–836, 2012.
- [SPL+19a] P. Sakornsakolpat, D. Prokopenko, M. Lamontagne, N. F. Reeve, A. L. Guyatt, V. E. Jackson, N. Shrine, D. Qiao, T. M. Bartz, D. K. Kim, M. K. Lee, J. C. Latourelle, X. Li, J. D. Morrow, M. Obeidat, A. B. Wyss, P. Bakke, R. G. Barr, T. H. Beaty, S. A. Belinsky, G. G. Brusselle, J. D. Crapo, K. de Jong, D. L. DeMeo, T. E. Fingerlin, S. A. Gharib, A. Gulsvik, I. P. Hall, J. E. Hokanson, W. J. Kim, D. A. Lomas, S. J. London, D. A. Meyers, G. T. O’Connor, S. I. Rennard, D. A. Schwartz, P. Sliwinski, D. Sparrow, D. P. Strachan, R. Tal-Singer, Y. Tesfaigzi, J. Vestbo, J. M. Vonk, J. J. Yim, X. Zhou, Y. Bosse, A. Manichaikul, L. Lahousse, E. K. Silverman, H. M. Boezen, L. V. Wain, M. D. Tobin, B. D. Hobbs, M. H. Cho, SpiroMeta Consortium, and International COPD Genetics Consortium. Genetic landscape of chronic obstructive pulmonary disease identifies heterogeneous cell-type and phenotype associations. Nat Genet, 51(3):494–505, 2019.
- [SPL+19b] Phuwanat Sakornsakolpat, Dmitry Prokopenko, Maxime Lamontagne, Nicola F Reeve, Anna L Guyatt, Victoria E Jackson, Nick Shrine, Dandi Qiao, Traci M Bartz, Deog Kyeom Kim, et al. Genetic landscape of chronic obstructive pulmonary disease identifies heterogeneous cell-type and phenotype associations. Nature genetics, 51(3):494–505, 2019.
- [Wor21] World Health Organization, 2021.
- [WTVBP17] Kyoko Watanabe, Erdogan Taskesen, Arjen Van Bochoven, and Danielle Posthuma. Functional mapping and annotation of genetic associations with fuma. Nature communications, 8(1):1–11, 2017.
- [WYZJ15] Quan Wang, Hui Yu, Zhongming Zhao, and Peilin Jia. Ew_dmgwas: edge-weighted dense module search for genome-wide association studies and gene expression profiles. Bioinformatics, 31(15):2591–2594, 2015.
Appendix A Results
A.1 Cross Validation

A.2 Analysis of predicted Gene Sets
| Dataset | Pathways | DOMINO | FUMA | DEPICT | MENDELVAR | MRA |
| Reactome | Immune System | 3.91 | 0.04 | 0.16 | 0.14 | 2.23 |
| Cytokine Signaling in Immune system | 4.21 | 0.11 | 0.59 | 0.28 | 1.49 | |
| Adaptive Immune System | 1.38 | 0.07 | 0.30 | 0.18 | 1.49 | |
| MHC class II antigen presentation | 1.82 | 0.00 | 0.00 | 1.10 | 1.49 | |
| Innate Immune System | 0.91 | 0.32 | 0.33 | 0.18 | 2.23 | |
| Hemostasis | 0.67 | 0.04 | 0.99 | 0.23 | 1.47 | |
| Axon guidance | 0.40 | 0.38 | 0.89 | 0.28 | 1.49 | |
| Developmental Biology | 0.27 | 0.40 | 0.89 | 0.22 | 1.49 | |
| Nuclear Receptor transcription pathway | 0.00 | 0.50 | 0.90 | 0.55 | 1.49 | |
| TCF dependent signaling in response to WNT | 0.00 | 0.21 | 0.96 | 0.55 | 1.49 | |
| Deactivation of the beta-catenin transactivating complex | 0.00 | 0.00 | 0.00 | 0.50 | 1.49 | |
| WNT5A-dependent internalization of FZD4 | 0.00 | 0.00 | 0.00 | 0.52 | 1.49 | |
| Dectin-1 mediated noncanonical NF-kB signaling | 0.00 | 0.00 | 0.00 | 0.78 | 1.47 | |
| CLEC7A (Dectin-1) signaling | 0.00 | 0.00 | 0.00 | 0.72 | 1.49 | |
| C-type lectin receptors (CLRs) | 0.00 | 0.00 | 0.00 | 0.64 | 1.49 | |
| Chemokine receptors bind chemokines | 0.00 | 0.00 | 0.00 | 1.20 | 1.49 | |
| KEGG | Antigen processing and presentation | 3.8666 | 0.2606 | 0.0000 | 0.7843 | 2.1558 |
| Tuberculosis | 1.3978 | 0.0000 | 0.4267 | 0.4671 | 2.5623 | |
| C-type lectin receptor signaling pathway | 0.7868 | 0.0000 | 0.0000 | 0.8774 | 2.6169 | |
| Hippo signaling pathway | 0.7113 | 0.0000 | 0.7527 | 0.3770 | 2.6169 | |
| MAPK signaling pathway | 0.8027 | 0.2606 | 2.0726 | 0.4271 | 2.7119 | |
| PI3K-Akt signaling pathway | 0.7529 | 0.2606 | 0.9459 | 0.3876 | 1.4735 | |
| Gastric cancer | 1.8639 | 0.2606 | 2.2511 | 0.4135 | 2.1287 | |
| Proteoglycans in cancer | 1.7971 | 0.0000 | 1.4500 | 0.3517 | 1.7392 | |
| Pathways in cancer | 1.5196 | 0.2606 | 2.7269 | 0.3510 | 1.7392 | |
| TGF-beta signaling pathway | 0.0000 | 0.2606 | 2.1576 | 0.4636 | 1.9723 | |
| Signaling pathways regulating pluripotency of stem cells | 0.0000 | 0.2434 | 0.5587 | 0.3970 | 2.7119 | |
| Chemokine signaling pathway | 0.0000 | 0.2062 | 0.0000 | 0.5249 | 1.7858 | |
| Mitophagy | 0.0000 | 0.0000 | 0.0000 | 0.5385 | 1.5257 | |
| Transcriptional misregulation in cancer | 0.0000 | 0.0000 | 0.0000 | 0.6232 | 1.7858 |
